Feedback
Table Of Contents
CTRS Alarms and System Errors Messages
Troubleshooting CTRS
September 2010The following sections describe the Troubleshooting tools for the Cisco TelePresence Recording Server (CTRS):
•
CTRS Alarms and System Errors Messages
System Information
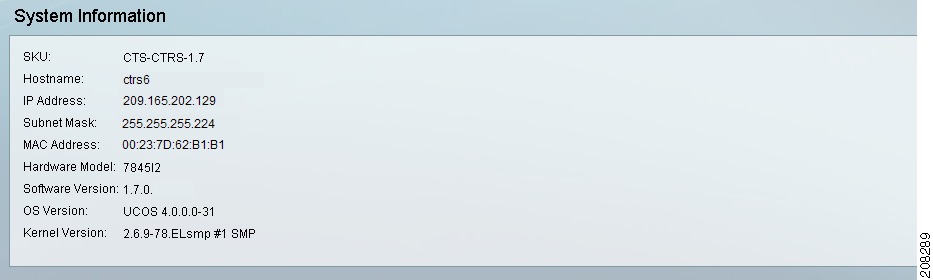
Click System Information in the left navigation to view information about the CTRS (see Figure 6-1). The information displayed under System Information is configured during CTRS software installation.
Figure 6-1 Troubleshooting > System Information
•
•
•
•
•
•
•
•
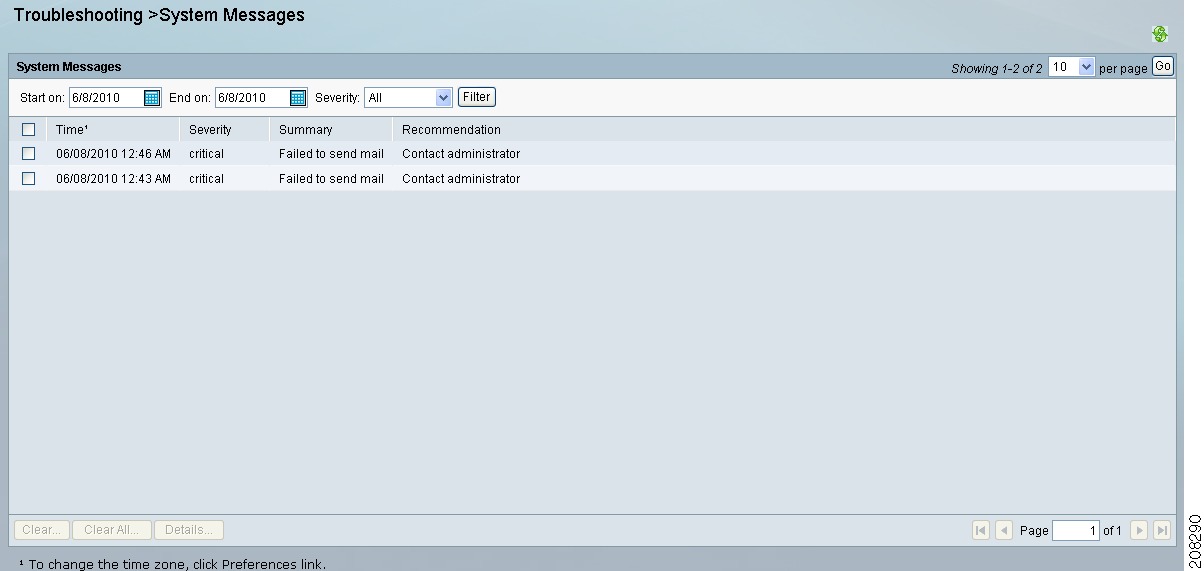
CTRS Alarms and System Errors Messages
You can view CTRS system messages in one of two ways:
•
Figure 6-2 Troubleshooting > System Messages
•
The following table provides field descriptions for all system error and warning displays:
•
•
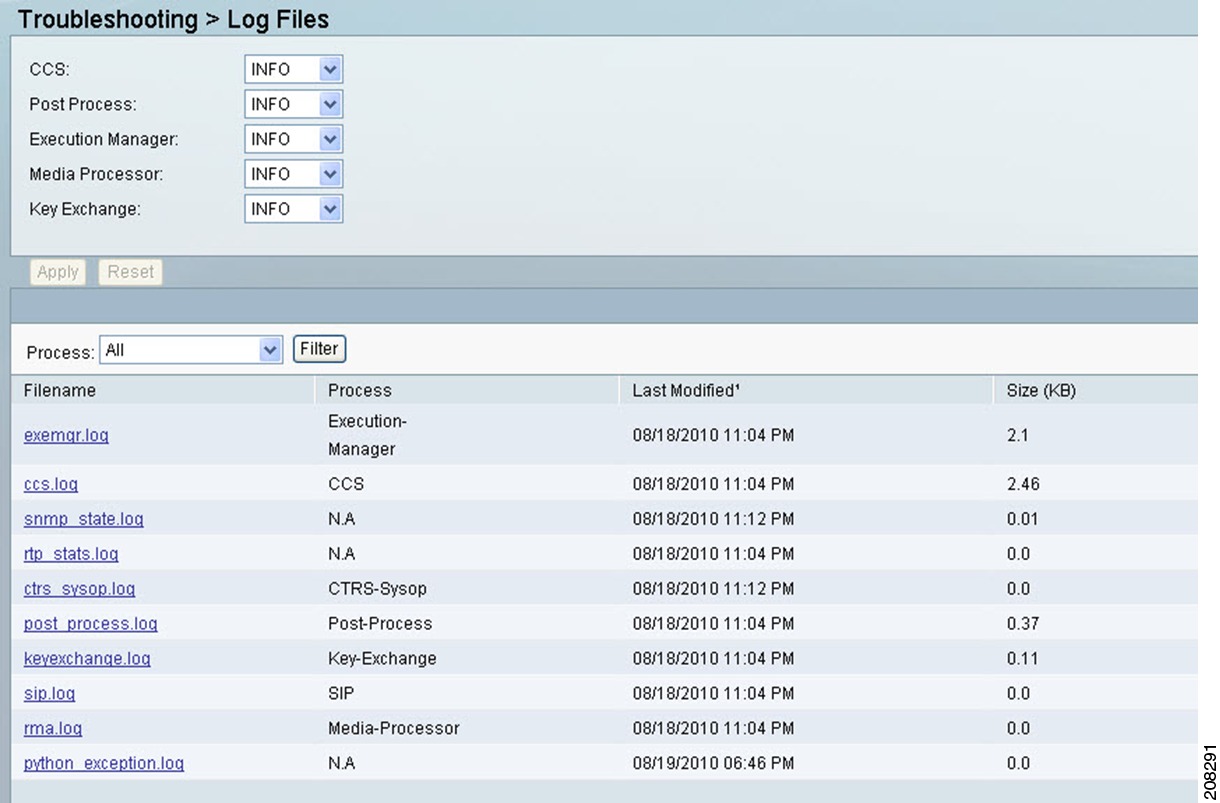
Log Files
Click Log Files in the left menu to display or modify log information (see Figure 6-3).
Figure 6-3 Troubleshooting > Log Files
Use the Log File page to set severity levels for alarms associated with specific system processes, to filter log files displayed, and to download log files.
Configuring the Severity Level of System Error Messages
To configure the severity level of system level error messages and alarms for specific process areas:
Step 1
Step 2
•
•
•
•
•
To the right of each process is a drop-down menu with these severity levels:
•
•
•
•
•
•
Click the down arrow to display the defined levels of severity. Choose the level at which logs are captured.
Note
Filtering the Log File Table Listings
To filter the log files displayed in the Log File Table:
Step 1
Step 2
•
•
•
•
•
•
•
•
•
•
•
•
Step 3
Downloading Log Files
To download log files from the Log File table:
Step 1
Step 2
Step 3