-
Cisco Content Security and Control SSM Administrator Guide, 6.1.1569.0
-
Cisco Content Security and Control Version 6.1.1569.0 Patch Release Notes
-
Cisco Content and Control SSM Administrator Guide, Version 6.1.1567.0
-
About This Guide
-
Contents
-
Introducing the CSC SSM
-
Verifying Initial Setup
-
Configuring SMTP and POP3 Mail Traffic
-
Configuring Web (HTTP) and File Transfer (FTP)
-
Managing Updates and Log Queries
-
Administering Trend Micro InterScan
-
Monitoring Content Security
-
Troubleshooting Trend Micro InterScan for Cisco CSC SSM
-
Reimaging and Configuring the CSC SSM Using the CLI
-
Using CSC SSM with Trend Micro Control Manager
-
Glossary
-
Index
-
 Feedback
Table Of Contents
Troubleshooting Trend Micro InterScan
for Cisco CSC SSMWhat To Do If Installation Fails
Troubleshooting Basic Functions
Summary Status and Log Entries Out of Synch
Access to Some Websites Is Slow or Inaccessible
Reimaging or Recovery of CSC Module
Troubleshooting Scanning Functions
Cannot Update the Pattern File
Cannot Create a Spam Stamp Identifier
Unacceptable Number of Spam False Positives
Cannot Accept Any Spam False Positives
Virus Is Detected but Cannot Be Cleaned
Scanning Not Working Because of Incorrect ASA Firewall Policy Configuration
Scanning Not Working Because the CSC SSM Is in a Failed State
Status LED Flashing for Over a Minute
SSM Cannot Communicate with ASDM
Logging in Without Going Through ASDM
CSC SSM Throughput is Significantly Less Than ASA
Using the Security Information Center
Understanding the CSC SSM System Log Messages
SSM Application Mismatch [1-105048]
Data Channel Communication Failure [3-323006]
Traffic Dropped Because of CSC Card Failure [3-421001]
Drop ASDP Packet with Invalid Encapsulation [3-421003]
Data Channel Communication OK [5-505010]
New Application Detected [5-505011]
Application Stopped [5-505012]
Application Version Changes [5-505013]
Skip Non-applicable Traffic [6-421002]
Account Host Toward License Limit [6-421005]
Traffic Dropped Because of CSC Card Failure [6-421007]
Failed to Inject Packet [7-421004]
Connection capacity has been reached
Connection capacity has been restored
CSC has actively disconnected a connection
Failover service communication failed
Failover service email could not be sent
Failover service encountered an internal error
Resource availability of the CSC SSM falls below the desired level
Resource availability of the CSC SSM has been restored
Service module cannot create FIFO
Service module encountered a problem when communicating with the ASA chassis
Service module informational report
Service module internal communication error
Service module show module 1 details
Spyware/Grayware detection event
Time synchronization with the ASA chassis failed
Troubleshooting Trend Micro InterScan
for Cisco CSC SSM
This chapter describes how to troubleshoot various issues, and includes the following sections:
•
What To Do If Installation Fails
•
•
•
Troubleshooting Installation
The following describes how to install using the CLI. If problems occur during the installation, see the "What To Do If Installation Fails" section.
To install the CSC SSM via the CLI, perform the following steps.
Step 1
hostname(config)# hw-module module 1 recover configureOutput similar to the following appears:
Image ` [tftp://171.69.1.129/dqu/CSCSSM-6.1.1519.0.img]:Port IP Address [0.0.0.0]:VLAN ID [0]:Gateway IP Address [0.0.0.0]:hostname(config)# hw-module module 1 recover bootThe module in slot 1 will be recovered. This mayerase all configuration and all data on that device andattempt to download a new image for it.Recover module in slot 1? [confirm]Recover issued for module in slot 1hostname(config)#hostname(config)# debug module-bootdebug module-boot enabled at level 1Step 2
hostname(config)# Slot-1 206> Cisco Systems ROMMON Version (1.0(10)0) #0: Sat Mar 26
00:13:50 PST 2005
Slot-1 207> domainname@yourdomain.com:/pixab/biosbuild/1.0.10.0/boot/rommonSlot-1 208> Platform ASA-SSM-AIP-10-K9Slot-1 209> GigabitEthernet0/0Slot-1 210> Link is UPSlot-1 211> MAC Address: 000b.fcf8.01b3Slot-1 212> ROMMON Variable Settings:Slot-1 213> ADDRESS=30.0.0.3Slot-1 214> SERVER=171.69.1.129Slot-1 215> GATEWAY=30.0.0.254Slot-1 216> PORT=GigabitEthernet0/0Slot-1 217> VLAN=untaggedSlot-1 218> IMAGE=dqu/CSCSSM-6.1.1519.0.imgSlot-1 219> CONFIG=Slot-1 220> LINKTIMEOUT=20Slot-1 221> PKTTIMEOUT=2Slot-1 222> RETRY=20Slot-1 223> tftp dqu/CSCSSM-6.1.1519.0.img@171.69.1.129 via 30.0.0.254Step 3
Slot-1 224>
!!!!!!!!!!!!!!!!!!!!!!!!!!!!!!!!!!!!!!!!!!!!!!!!!!!!!!!!!!!!!!!!!!!!!!!!!!!!!!!!
Slot-1 225> !!!!!!!!!!!!!!!!!!!!!!!!!!!!!!!!!!!!!!!!!!!!!!!!!!!!!!!!!!!!!!!!!!!!!!!!!!!!!!!!Slot-1 226> !!!!!!!!!!!!!!!!!!!!!!!!!!!!!!!!!!!!!!!!!!!!!!!!!!!!!!!!!!!!!!!!!!!!!!!!!!!!!!!!Slot-1 227> !!!!!!!!!!!!!!!!!!!!!!!!!!!!!!!!!!!!!!!!!!!!!!!!!!!!!!!!!!!!!!!!!!!!!!!!!!!!!!!!Slot-1 228> !!!!!!!!!!!!!!!!!!!!!!!!!!!!!!!!!!!!!!!!!!!!!!!!!!!!!!!!!!!!!!!!!!!!!!!!!!!!!!!!. . . [ output omitted ]. . .Slot-1 400> !!!!!!!!!!!!!!!!!!!!!!!!!!!!!!!!!!!!!!!!!!!!!!!!!!!!!!!!!!!!!!!!!!!!!!!!!!!!!!!!Slot-1 401> !!!!!!!!!!!!!!!!!!!!!!!!!!!!!!!!!!!!!!!!!!!!!!!!!!!!!!!!!!!!!!!!!!!!!!!!!!!!!!!!Slot-1 402> !!!!!!!!!!!!!!!!!!!!!!!!!!!!!!!!!!!!!!!!!!!!!!!!!!!!!!!!!!!!!!!!!!!!!!!!!!!!!!!!Slot-1 403> !!!!!!!!!!!!!!!!!!!!!!!!!!!!!!!!!!!!!!!!!!!!!!!!!!!!!!!!!!!!!!!!!!!!!!!!!!!!!!!!Slot-1 404> !!!!!!!!!!!!!!!!!!!!!!!!!!!!!!!!!!!!!!!!!!!!!!!!!!!!!!!!!!!!!!!!!!!!!!!!!!!!!!!!Slot-1 405> !!!!!!!!!!!!!!!!!!!!!!!!!!!!!!!!!!!!!!!!!!!!!!Slot-1 406> Received 59501255 bytesThe TFTP download is complete. Note the number of received bytes, which should be the same size as the CSC SSM image.
Step 4
Slot-1 407> Launching TFTP Image...The image is being unpacked and installed.
Step 5
Slot-1 408> Cisco Systems ROMMON Version (1.0(10)0) #0: Sat Mar 26 00:13:50 PST 2005Slot-1 409> morlee@bowmore:/pixab/biosbuild/1.0.10.0/boot/rommonSlot-1 410> Platform ASA-SSM-AIP-10-K9Slot-1 411> Launching BootLoader...After a minute or two, the CSC SSM boots up.
Step 6
hostname(config)# show module 1Output similar to the following appears:
Mod Card Type Model Serial No.--- -------------------------------------------- ------------------ -----------1 ASA 5520/5530 AIP Security Service Module-10 ASA-SSM-AIP-10-K9 P00000000TTMod MAC Address Range Hw Version Fw Version Sw Version--- --------------------------------- ------------ ------------ ---------------1 000b.fcf8.01b3 to 000b.fcf8.01b3 1.0 1.0(10)0 CSC SSM 6.1.1519.0Mod SSM Application Name Status SSM Application Version--- ------------------------------ ---------------- --------------------------1 CSC SSM Down 6.1.1519.0Mod Status Data Plane Status Compatibility--- ------------------ --------------------- -------------1 Up Up
Note
What To Do If Installation Fails
Table 8-1 describes what to do if installation fails during the procedure described in the "Troubleshooting Installation" section.
Troubleshooting Activation
Before taking any other action, make sure that the clock is set correctly on the adaptive security appliance. For more information, see Cisco ASA 5500 Series Adaptive Security Appliance Getting Started Guide and the ASDM online help.
Use the show module, show module 1, and show module 1 details commands to verify that the CSC SSM has been activated successfully. If you cannot resolve the problem using the output from these commands, contact Cisco TAC.
Troubleshooting Basic Functions
This section describes issues you may encounter with basic functions, and includes the following topics:
•
•
•
Cannot Log On
You specified an administrator password when you installed Trend Micro InterScan for Cisco CSC SSM with the Setup Wizard. You must use the password you created during installation to log in, which is not the same password that you use to access ASDM. Passwords are case-sensitive; be sure you have entered the characters correctly.
If you forget your password, it can be recovered. For more information, see Recovering a Lost Password.
Recovering a Lost Password
The two passwords used to manage the CSC SSM are as follows:
•
•
The default entry for both passwords is "cisco."
To recover your passwords in case you lose one or more of them, consider the following:
•
•
Caution
•
To reimage the CSC SSM and recover the configuration, perform the following steps:
Step 1
After reimaging, all passwords are restored to their default value.
Step 2
Step 3
Step 4
Step 5
Summary Status and Log Entries Out of Synch
You may occasionally notice that the counters displayed on the Mail (SMTP), Mail (POP3), Web (HTTP), and File Transfer (FTP) tabs of the Summary window do not synchronize with the statistics displayed in the log reports. In the CSC SSM console, choose Logs > Query to access the logs. This mismatch happens because of the following:
•
•
Delays in HTTP Connections
A delay of approximately 30 seconds can occur if you have URL filtering enabled on the CSC SSM, but the CSC SSM does not have access to the Internet via HTTP. Trend Micro maintains an online database that stores URLs in different categories. The CSC SSM first checks the local URL filtering database. If no entry is located, then the CSC SSM tries to access the URL database when processing an HTTP request from a client. If you cannot grant Internet access to the CSC SSM (either direct or indirect via a proxy), disable URL filtering.
In addition, disabling Deferred Scanning may cause large file transfers to be slow or time out.
Access to Some Websites Is Slow or Inaccessible
There are some websites, such as banks, online shopping sites, or other special purpose servers that require extra backend processing before responding to a client request. The CSC SSM has a non-configurable, 90-second timeout between the client request and the server response to prevent transactions from tying up resources on the CSC SSM for too long. This means that transactions that take a longer time to process will fail. The workaround is to exclude the site from scanning.
For example, for a site on the outside network with the IP address, 100.100.10.10:
exempt http traffic to 123.123.10.10access-list 101 deny tcp any host 123.123.10.10 eq httpcatch everything elseaccess-list 101 permit tcp any eq httpclass-map my_csc_classmatch access-list 101policy-map my_csc_policyclass my_csc_classcsc fail-closeservice-policy my_csc_policy interface insideThis configuration exempts HTTP traffic to 100.100.10.10 from being scanned by the CSC SSM.
Performing a Packet Capture
If there are sites you can access without going through the CSC SSM, but cannot access when traffic is being scanned, report the URL to Cisco TAC. If possible, do a packet capture and send the information to Cisco TAC also.
For example, if the client has an IP address, 1.1.1.1, and the outside website has an IP address, 2.2.2.2:
access-list cap_acl permit tcp host 1.1.1.1 host 2.2.2.2access-list cap_acl permit tcp host 2.2.2.2 host 1.1.1.1capture cap access-list cap_acl interface insidecapture cap access-list cap_acl interface outsideTo perform a packet capture, perform the following steps:
Step 1
Step 2
hostname(config)# capture csc_cap interface asa_dataplance buffer 10485760
Note
Step 3
Step 4
hostname(config)# copy /pcap capture:csc_cap tftp://IP/pathStep 5
hostname(config)# no capture csc_cap interface asa_dataplane
Note
FTP Download Does Not Work
If your FTP login works, but you cannot download via FTP, do the following:
•
•
For more information, see the Cisco ASA 5500 Series Adaptive Security Appliance Getting Started Guide.
Reimaging or Recovery of CSC Module
During reimaging or recovery of a CSC module, it is possible to type the address of the TFTP server or the file name incorrectly. If this occurs, the CSC module will continuously reboot, attempting the reimaging using the invalid configuration information provided. To stop the reimaging process and correct the configuration, enter the hw module 1 recover stop command in the specified configuration mode.
Troubleshooting Scanning Functions
This sections describes issues you may encounter with scanning for viruses or spam, and includes the following topics:
•
•
•
•
•
Cannot Update the Pattern File
If the pattern file is out-of-date and you are unable to update it, the most likely cause is that your Maintenance Agreement has expired. Check the Expiration Date field in the Administration > Product License window. If the date shown is in the past, you cannot update the pattern file until you renew your Maintenance Agreement.
If the pattern file is current, the following may be true:
•
•
Spam Not Being Detected
If the anti-spam feature does not seem to be working, be sure that the following is true:
•
•
•
•
Cannot Create a Spam Stamp Identifier
A spam stamp identifier is a message that appears in the e-mail message subject. For example, for a message titled "Q3 Report," if the spam stamp identifier is defined as "Spam:," the message subject would appear as "Spam:Q3 Report."
If you are having problems creating a spam identifier, make sure you are using only English uppercase and lowercase characters, the digits 0-9, or the set of special characters shown in Figure 8-1.
Figure 8-1 Special Characters for Spam Stamp Identifier
Note
Unacceptable Number of Spam False Positives
Your spam filtering threshold may be set at a level that is too aggressive for your organization. Assuming you adjusted the threshold to Medium or High, try a lower setting in the threshold fields on the Mail (SMTP) > Anti-spam > SMTP Incoming Anti-spam window and the Mail (POP3) > Anti-spam > POP3 Anti-spam windows. Also enable the anti-spam "stamp message" feature on the SMTP Incoming Anti-spam window and the POP3 Anti-spam windows. For more information, see the online help for these two windows.
Also, if users in your network are receiving newsletters through e-mail, this type of message tends to trigger a high number of false positives. Add the e-mail address or domain name to the approved senders list to bypass spam filtering on these messages.
Cannot Accept Any Spam False Positives
Some organizations, such as banks and other financial institutions, cannot risk any message being identified as a false positive. In this case, disable the anti-spam feature for SMTP and POP3.
Unacceptable Amount of Spam
You may have set your spam filtering threshold at a level that is too lenient for your organization. Try a higher setting in the threshold fields on the Mail (SMTP) > Anti-spam > SMTP Incoming Anti-spam window and the Mail (POP3) > Anti-spam > POP3 Anti-spam window. If you still receive an unacceptable amount of spam, enable the network-based, anti-spam (NRS) setting. Choose Mail (SMTP) > Anti-spam > Network Reputation Services.
Virus Is Detected but Cannot Be Cleaned
Not all virus-infected files are cleanable. For example, a password-protected file cannot be scanned or cleaned.
If you think you are infected with a virus that does not respond to cleaning, go to the following URL:
http://subwiz.trendmicro.com/SubWiz/Default.asp
This link takes you to the Trend Micro Submission Wizard, which includes information about what to do, including how to submit your suspected virus to TrendLabs for evaluation.
Virus Scanning Not Working
This section describes why virus scanning may not work, and includes the following topics:
•
•
Ensure that no one has disabled the virus scanning feature on the SMTP Incoming, SMTP Outgoing, POP3, HTTP, and FTP Scanning windows. If scanning is enabled but viruses are not being detected, contact Cisco TAC for assistance.
Also, test the virus scanning feature by following the instructions described in the "Testing the Antivirus Feature" section on page 2-3.
Scanning Not Working Because of Incorrect ASA Firewall Policy Configuration
Another possible cause is that a file has not been scanned because of an incorrect firewall policy configuration. Use the show service-policy csc command to configure the SSM to process traffic.
The following example shows how to configure the SSM to process traffic:
hostname(config)# show service-policy flow tcp host 192.168.10.10 host 10.69.1.129 eq httpGlobal policy:Service-policy: global_policyClass-map: trendMatch: access-lit trendAccess rule: permit tcp any any eq wwwAction:Output flow: csc fail-closeInput flow set connection timeout tcp 0:05:00Class-map: perclientMatch: access-lit perclientAccess rule: permit IP any anyAction:Input flow: set connection per-client-max 5 per-client-embryonic-max 2Scanning Not Working Because the CSC SSM Is in a Failed State
If the CSC SSM is in the process of rebooting, or has experienced a software failure, system log message 421007 is generated.
Enter the following command to view the status of the SSM card:
hostname(config)# show module 1The output appears in several tables, as shown in the following example. The third table, SSM Application Name, displays status, which is "Down."
Mod Card Type Model Serial No.--- -------------------------------------------- -----------------------------1 ASA 5500 Series Security Services Module-10 ASA-SSM-10 JAB092400TXMod MAC Address Range Hw Version Fw Version Sw Version--- --------------------------------- ------------ ---------------------------1 0013.c480.ae4c to 0013.c480.ae4c 1.0 1.0(10)0 CSC SSM 6.1.1519.0Mod SSM Application Name Status SSM Application Version--- ------------------------------ ------------------------------------------1 CSC SSM Down 6.1.1519.0Mod Status Data Plane Status Compatibility--- ------------------ --------------------- -------------1 Up UpThe three possible states that could display in the Status field for the third table are as follows:
•
•
•
To view the state for each individual process, enter the following command:
hostname(config)# show module 1 detailExample output similar to the following appears:
Getting details from the Service Module, please wait...ASA 5500 Series Security Services Module-10Model: ASA-SSM-10Hardware version: 1.0Serial Number: JAB092400TXFirmware version: 1.0(10)0Software version: CSC SSM 6.1.1519.0MAC Address Range: 0013.c480.ae4c to 0013.c480.ae4cApp. name: CSC SSMApp. Status: DownApp. Status Desc: CSC SSM scan services are not availableApp. version: 6.1.1519.0Data plane Status: UpStatus: UpHTTP Service: DownMail Service: DownFTP Service: DownActivated: NoMgmt IP addr: <not available>Mgmt web port: 8443Peer IP addr: <not enabled>The status for the CSC SSM appears in the App. Status field. In the example, the status is "Down." The possible states for this field are as follows:
•
•
•
•
•
•
•
•
Downloading Large Files
Handling of very large files may be a potential issue for the HTTP and FTP protocols. On the Target tabs of the HTTP Scanning and FTP Scanning windows, you configured large file handling fields, which included a deferred scanning option.
If you did not enable deferred scanning, Trend Micro InterScan for Cisco CSC SSM must receive and scan the entire file before passing the file contents to the requesting user. Depending on the file size, this action could:
•
•
If you enabled deferred scanning, part of the content of the large file is delivered without scanning to prevent a timeout from occurring. Subsequent portions of the content are being scanned in the background and are then downloaded if no threat is detected. If a threat is detected, the rest of the file is not downloaded; nevertheless, the unscanned portion of the large file is already stored on the user machine and may introduce a security risk.
Note
Restart Scanning Service
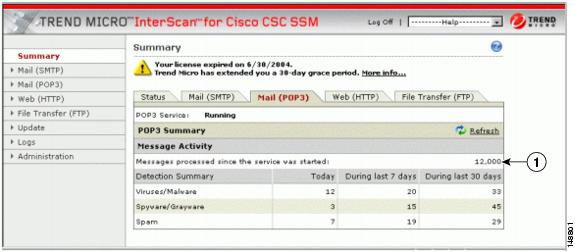
In the Message Activity area, the Mail (SMTP and POP3) tabs on the Summary window display a count of Messages processed since the service was started. For an example, see Figure 8-2.
Figure 8-2 Messages Processed Counter on the Mail (POP3) Tab of the Summary Window
Several events can cause these counters to reset to zero:
•
•
•
The statistics in the Detection Summary area of the window do not reset; these statistics continue to update as trigger events occur.
When the counters reset, it is normal behavior. If, however, you have a continuous zero in the Messages processed... fields, e-mail traffic is not being scanned and you should investigate.
Troubleshooting Performance
This section describes issues you may encounter with performance, and includes the following topics:
•
•
•
•
CSC SSM Console Timed Out
If you leave the CSC SSM console active and no activity is detected for approximately ten minutes, your session times out. Log in again to resume work. Unsaved changes are lost. If you are called away, save your work and log off until you return.
Status LED Flashing for Over a Minute
If the Status LED continues flashing for more than one minute, the scanning service is not available. To resolve this problem, reboot the system from ASDM, or contact Cisco TAC for assistance.
Caution
SSM Cannot Communicate with ASDM
For information about resetting port access control, see the "Resetting the Management Port Access Control" section on page A-16.
Logging in Without Going Through ASDM
If for some reason ASDM is unavailable, you can log directly into the CSC SSM via a web browser. To log in, perform the following steps:
Step 1
https://{SSM IP addresss}:8443For example:
https://10.123.123.123:8443/The Logon window appears.
Step 2
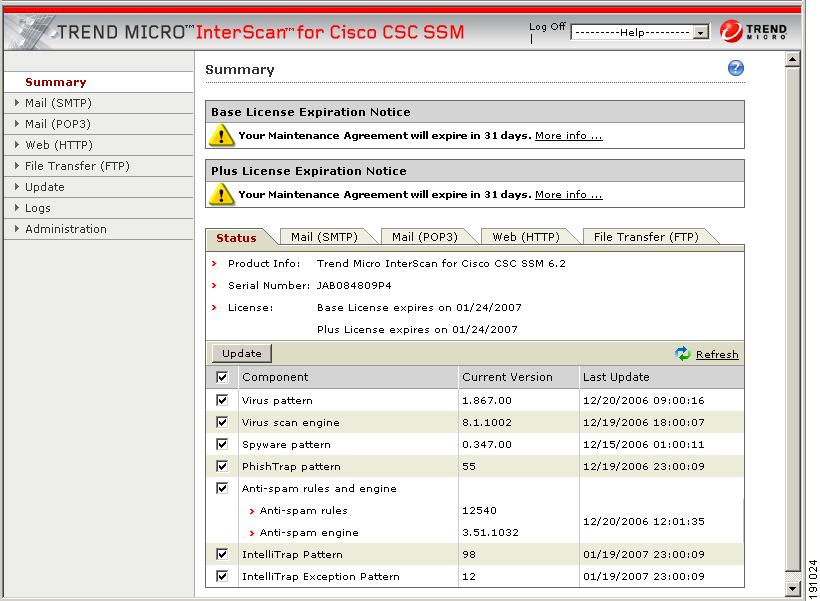
The default view of the CSC SSM console is the Status tab on the Summary window, as shown in Figure 8-3.
Figure 8-3 Status Tab of the Summary Screen on the CSC SSM Console
CSC SSM Throughput is Significantly Less Than ASA
Restoring files from TCP connections and scanning them is a processor-intensive operation, which involves more overhead than the protocol-conformance checking that is usually done by a firewall. The workaround is to divert only the connections that need to be scanned to the CSC SSM to mitigate the performance mismatch.
For example, HTTP traffic can be divided into outbound traffic (an inside user is accessing outside websites), inbound traffic (an outside user is accessing inside servers), and intranet traffic (traffic between internal sites or trusted partners). You can configure the CSC SSM to scan only outbound traffic for viruses, but ignore the inbound ones.
For more information, see Cisco Security Appliance Command Line Configuration Guide.
Using Knowledge Base
You can search for more information in the Trend Micro online Knowledge Base, available at the following URL:
http://esupport.trendmicro.com
The Knowledge Base search engine allows you to refine your search, by entering product name, problem category, and keywords. Thousands of solutions are available in the Knowledge Base, and more are added weekly.
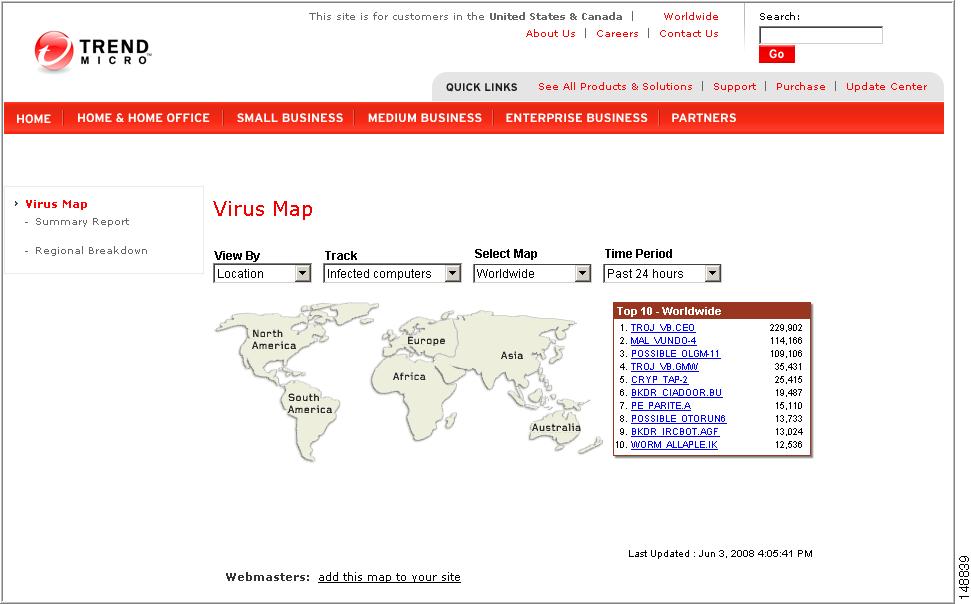
Using the Security Information Center
Comprehensive security information is available from the Trend Micro Security Information Center, a free online resource, at the following URL:
http://trendmicro.com/vinfo/
The Security Information Center provides the following information:
•
•
•
•
•
•
•
Figure 8-4 Virus Map
•
•
–
–
–
•
•
•
•
Understanding the CSC SSM System Log Messages
This section lists the CSC SSM-related system log messages, and includes the following topics:
•
•
•
•
•
•
•
•
•
•
•
•
•
•
•
•
•
•
•
•
•
•
•
•
•
•
SSM Application Mismatch [1-105048]
Error Message    %ASA-1-105048: (unit) Mate's service module (application) is different
from mine (application)
Explanation The failover process detected that different applications are running on the service modules in the active and standby units. The two failover units are incompatible if different service modules are used.
•
•
Recommended Action Make sure that both units have identical service modules before trying to reenable failover.
Data Channel Communication Failure [3-323006]
Error Message    %ASA-3-323006: Module in slot slot experienced a data channel
communication failure, data channel is DOWN.
Explanation This message indicates that a data channel communication failure occurred and the system was unable to forward traffic to the 4GE SSM. The failure triggers a failover when it occurs on the active adaptive security appliance in a failover pair. It also results in the configured fail-open or fail-closed policy being enforced on traffic that would normally be sent to the 4GE SSM. The message is generated whenever a communication problem occurs over the adaptive security appliance dataplane between the system module and the 4GE SSM. This communication problem can be caused when the 4GE SSM stops, resets, or is removed.
•
Recommended Action If this is not the result of the 4GE SSM reloading or resetting and a corresponding system log message 5-505010 does not appear after the 4GE SSM returns to an UP state, reset the module using the hw-module module 1 reset command.
Traffic Dropped Because of CSC Card Failure [3-421001]
Error Message    %ASA-3-421001: TCP|UDP flow from interface_name:ip/port to
interface_name:ip/port is dropped because application has failed.
Explanation A packet was dropped because the CSC SSM application failed. By default, this message is rate limited to one message every ten seconds.
•
•
•
•
Recommended Action Immediately investigate the problem with the service module.
Drop ASDP Packet with Invalid Encapsulation [3-421003]
Error Message %ASA-3-421003: Invalid data plane encapsulation.Explanation A packet injected by the service module did not have the correct data plane header. Packets exchanged on data backplane adhere to the ADSP protocol. Any packet that does not have the correct ASDP header is dropped.
Recommended Action Use the capture name type asp-drop [ssm-asdp-invalid-encap] command to capture the offending packets and contact Cisco TAC.
Daily Node Count [5-421006]
Error Message    %ASA-6-421006: There are number users of application accounted during
the past 24 hours.
Explanation This system log message identifies the total number of users who have used application for the past 24 hours. This message is generated every 24 hours to give the total number of hosts that have used services provided by the service module.
Recommended Action If the overall count exceeds the user license you have purchased, contact Cisco to upgrade your license.
Data Channel Communication OK [5-505010]
Error Message %ASA-5-505010: Module in slot slot data channel communication is UP.Explanation This message is generated whenever the data channel communication recovers from a DOWN state. This message indicates that data channel communication is operating normally. It occurs after the data channel communication fails and then recovers.
•
Recommended Action If this message was generated as a result of a previous data channel communication failure (system log message 3-323006), check the 4GE SSM system log messages to determine the cause of the communication failure.
New Application Detected [5-505011]
Error Message    %ASA-5-505011: Module in slot slot, application detected application,
version version.
Explanation A new application was detected on a 4GE SSM. This may occur when the adaptive security appliance boots, when the 4GE SSM boots, or when the 4GE SSM starts a new application.
•
•
•
Recommended Action None.
Application Stopped [5-505012]
Error Message    %ASA-5-505012: Module in slot slot, application stopped application,
version version
Explanation This message is generated whenever an application is stopped or removed from a 4GE SSM. This may occur when the 4GE SSM upgrades an application or when an application in the 4GE SSM is stopped or uninstalled.
•
•
•
Recommended Action If an upgrade was not occurring on the 4GE SSM or the application was not intentionally stopped or uninstalled, review the logs from the 4GE SSM to determine why the application stopped.
Application Version Changes [5-505013]
Error Message    %ASA-5-505013: Module in slot slot application changed from:
application version version to: newapplication version newversion.
Explanation This message is generated whenever an application version changes, such as after an upgrade. This occurs when a software update for the application on the module is complete.
•
•
•
•
•
•
•
•
Recommended Action Verify that the upgrade was expected and that the new version is correct.
Skip Non-applicable Traffic [6-421002]
Error Message    %ASA-6-421002: TCP|UDP flow from interface_name:IP_address/port to
interface_nam:IP_address/port bypassed application checking because the protocol
is not supported.
Explanation The connection bypassed the service module security checking because the protocol it is using cannot be scanned by the service module. For example, the CSC SSM is not capable of scanning Telnet traffic. If the user configures Telnet traffic to be scanned, the traffic will bypass the scanning service. By default, this message is rate limited to one message every ten seconds.
•
•
•
•
Recommended Action The configuration should be modified to only include protocols that are supported by the service module.
Account Host Toward License Limit [6-421005]
Error Message    %ASA-6-421005: interface_name:IP_address is counted as a user of
application
Explanation A host has been counted toward the license limit. The specified host was counted as a user of application. The total number of users in 24 hours is calculated at midnight for license validation.
•
•
•
Recommended Action If the overall count exceeds the user license you have purchased, contact Cisco to upgrade your license.
Traffic Dropped Because of CSC Card Failure [6-421007]
Error Message    %ASA-3-421007: TCP|UDP flow from interface_name:IP_address/port to
interface_name:IP_address/port is skipped because application has failed.
Explanation This message is generated when a flow is skipped because the service module application has failed. By default, this message is rate limited to one message every ten seconds.
•
•
•
•
Recommended Action Immediately investigate the problem with the service module.
Failed to Inject Packet [7-421004]
Error Message    %ASA-7-421004: Failed to inject {TCP|UDP} packet from IP_address/port
to IP_address/port
Explanation The adaptive security appliance has failed to inject a packet, as instructed by the service module. This could happen if the adaptive security appliance tries to inject a packet into a flow that has already been released or because the adaptive security appliance maintains its connection table independent of the service module.
•
•
Recommended Action If this affects adaptive security appliance performance, contact Cisco TAC.
Connection capacity has been reached
Error Message    The maximum number of connections for protocol has been reached. New
connections will be kept in a backlog and may time out.
Example:
The maximum number of connections for HTTP has been reached. New connections will be kept
in a backlog and may time out.
Explanation This system log message is generated when the CSC SSM reaches the maximum number of concurrent connections set for a given protocol.
•
Recommended Action Configure the adaptive security appliance to bypass certain traffic from CSC SSM scanning or segment the network to another adaptive security appliance.
Connection capacity has been restored
Error Message The number of current protocol connections has returned to normal.Example:
ActiveUpdate: VirusScanEngine/uptodate, VirusPattern/3.189.00, AntiSpamEngine/failed,
GraywarePattern/unlicensed, PhishTrap/187
Explanation This system log message is generated when the number of concurrent connections has returned to a range that the CSC SSM can process promptly.
•
Recommended Action None.
CSC has actively disconnected a connection
Error Message    CSCSSM: A protocol session has been disconnected from the client at
client_ip to the server at server_ip due to internal error or timeout.
Example:
CSCSSM: A HTTP session has been disconnected from the client at 1.1.1.1 to the server at
2.2.2.2 due to internal error or timeout.
Explanation This system log message is generated when a socket timeout is experienced when the CSC SSM proxies a connection, or an internal problem is encountered.
•
•
•
Recommended Action None.
CSC SSM status message
Error Message    SysMonitor: INFO: Set CSC SSM Application Status to
data_channel_status.
Example:
SysMonitor: INFO: Set CSC SSM Application Status to UP.Explanation This system log message is generated to indicate the current status of the CSC SSM. When the CSC SSM is healthy, the status is set to UP and traffic can be processed. When the CSC SSM is updating the configuration, or an engine or pattern, the status is set to RELOAD and the adaptive security appliance will perform a fail-open or fail-close. When the CSC SSM is unable to process traffic, the status is set to DOWN and traffic bypasses CSC SSM processing. The adaptive security appliance will perform a fail-open, fail-close, or fail-over according to how it has been configured.
•
Recommended Action No action is required for UP and RELOAD status. When the status is DOWN, either restart the services on the CSC SSM or contact Cisco TAC.
Failover service communication failed
Error Message    is-failover-daemon[process_id]: request_type FAILED. Status code code;
Status description: text
Example:
is-failover-daemon[5532]: HEARTBEAT FAILED. Status code 403; Status description:
Connection or request timed out.
Explanation This system log message is generated when the failover daemon could not send a heartbeat to its peer to verify network connectivity.
•
•
•
•
Recommended Action If this error occurs while configuring CSC failover, follow the recommended action display in the Device Failover Settings screen of the CSC management console. Otherwise, check all hardware connections between the adaptive security appliances or contact Cisco TAC.
Failover service email could not be sent
Error Message    is-failover-daemon[process_id]: action_type failed notification could
not be sent
Example:
is-failover-daemon[5532]: HELLO failed notification could not be sent.Explanation This system log message is generated when the automatic "heartbeat failure" notification e-mailed to the administrator cannot be sent.
•
•
Recommended Action Restart all services on the CSC SSM, reload the CSC SSM, or contact Cisco TAC.
Failover service encountered an internal error
Error Message    is-failover-daemon[process_id]: Could not create failover sync server
socket; Could not open failover sync server socket; Could not create failover
request handler thread; Could not create failover sync server thread; Could not
create failover sync server; Could not create failover IPC server thread; Could
not create failover IPC server; Cannot open IPC sockets; Could not create heartbeat
thread
Example:
is-failover-daemon[process_id]: Could not create failover sync server socketExplanation This system log message is generated when the failover service encounters an unrecoverable internal error.
•
A list of possible failover daemon errors follows:
–
–
–
–
–
–
–
–
–
–
Recommended Action Restart all services on the CSC SSM, reload the CSC SSM, or contact Cisco TAC.
HTTP URL blocking event
Error Message is-url-blocking: time|blocked_url|client_ip|blocking_ruleExample:
is-url-blocking: 2006/01/01 17:10:59|blocked.com/|10.2.3.4|PhishTrap|Explanation This system log message is generated when the CSC SSM detects a URL blocking event in the HTTP scanning.
•
•
•
•
Recommended Action None.
HTTP URL filtering event
Error Message is-url-filtering: time|filtered_url|client_ip|url_categoryExample:
is-url-filtering: 2006/01/01 17:10:59|forbidden.com/|10.2.3.4|Company Prohibited Sites|Explanation This system log message is generated when the CSC SSM detects a URL filtering event in the HTTP scanning.
•
•
•
•
Recommended Action Adjust the URL filtering setting if you want this URL category to be allowed.
License upgrade notice
Error Message    license-upgrade-notice: Your daily node counts (daily_count) has
exceeded your licensed seats (seats) by offset. Please upgrade your license.
Example:
License-upgrade-notice: Your daily node counts (300) has exceeded your licensed seats
(100) by 200. Please upgrade your license.
Explanation This system log message is generated when CSC SSM detects more nodes connected to the CSC SSM than are specified in the current license. In addition to this message, a notification e-mail is sent to the administrator.
•
•
•
Recommended Action Contact Cisco for a license upgrade.
Resource availability of the CSC SSM falls below the desired level
Error Message    SysMonitor: INFO: RESOURCE: resource_name free space
current_free_space K is below desired_free_space K
Example:
SysMonitor: INFO: RESOURCE: Compact Flash free space 1234K is below 5120K.Explanation This system log message is generated when one of the storage spaces on the CSC SSM falls below the desired level.
•
–
–
–
–
•
•
Recommended Action If the message is sent more than once, contact Cisco TAC.
Resource availability of the CSC SSM has been restored
Error Message    SysMonitor: INFO: RESOURCE: resource_title free space is back to normal
(more than desired_free_space K)
Example:
SysMonitor: INFO: RESOURCE: Compact Flash free space is back to normal (more than 5120K).Explanation This system log message is generated when the CSC SSM has recovered from a previous storage shortage.
•
–
–
–
–
•
Recommended Action None.
Scan service failed
Error Message    SysMonitor: INFO: service_title service is DOWN, count = counter,
restarting
Example:
SysMonitor: INFO: FTP service is DOWN, count = 1, restartingExplanation This system log message is generated when a scan service stops; the counter increments for each restart attempt.
Recommended Action If a service goes down, restart all services by accessing the CSC SSM CLI Menu. If the failure persists, reset the CSC SSM or contact Cisco TAC.
Scan service recovered
Error Message SysMonitor: INFO: service_title service is UP.Example:
SysMonitor: INFO: FTP service is UP.Explanation This system log message is generated when a scan service recovers from a previous failure.
•
Recommended Action None.
Scheduled update report
Error Message ActiveUpdate: component/status component/status.Example:
ActiveUpdate: VirusScanEngine/uptodate, VirusPattern/3.189.00, AntiSpamEngine/failed,
GraywarePattern/unlicensed, PhishTrap/187
Explanation This system log message is generated when a scheduled pattern/engine update occurs.
•
•
Recommended Action If you see consecutive update failures, either troubleshoot the Internet connectivity, the CSC SSM update settings, or contact Cisco TAC.
Service module cannot create FIFO
Error Message    is-service-module[process_id]: Cannot create fifo_name; Cannot open
csc subsystem IPC fifos
Example:
is-service-module[5532]: Cannot create /var/run/isvw/servmodfifo.1Explanation This system log message is generated when the system is unable to create FIFOs for IPC with another CSC subsystem.
•
•
•
Recommended Action Restart all services on the CSC SSM, reload the CSC SSM, or contact Cisco TAC.
Service module encountered a problem when communicating with the ASA chassis
Error Message    is-service-module[process_id]: Could not send the node count request
to the ASA; Could not get time from the ASA; Could not send the time sync request
to the ASA; ASA auto time sync failed on SSM reboot; Management port IP change
report to the ASA failed; Management port IP change report failed; Could not
increase the process priority
Example:
is-service-module[5532]: Could not send the node count request to the ASA.Explanation This system log message is generated when the Service Module fails to communicate with the adaptive security appliance chassis.
•
Recommended Action None.
Service module informational report
Error Message    is-service-module[process_id]: Software version: text; Increased
process priority to -5; Application name: text; Application version: text;
Application state: up/down
Example:
is-service-module[553]: Software version: CSC SSM 6.1.1519.0Explanation This system log message displays the CSC application name, version, and running state during Service Module startup.
•
•
•
Recommended Action None.
Service module internal communication error
Error Message    is-service-module[process_id]: Received unrecognized ipc_operation
request; ipc_operation peer closed with no request sent; Bad ipc_operation request
from InterScan
Example:
is-service-module[5532]: Received unrecognized time sync requestExplanation This system log message is generated when the IPC is unable to communicate with another CSC subsystem.
•
•
Recommended Action None.
Service module show module 1 details
Error Message    is-service-module[process_id]: Syslog Number and Format: Software
version: text; HTTP Service: up/down; Mail Service: up/down; FTP Service: up/down;
Activated: Yes/No; Mgmt IP addr: IP_address; Mgmt web port: port; Peer IP addr:
ip/not_enabled
Example:
is-service-module[553]: Software version: CSC SSM 6.1.1519.0Explanation This system log message displays the output of the "show module 1 details" command produced by the Service Module.
•
•
•
•
•
•
•
Recommended Action None.
SMTP/POP3 anti-spam event
Error Message    is-anti-spam: time|from_email_address|to_email_address|
email_subject|action_on_the_content|action_on_the_email|
Example:
is-content-filter: 2006/01/01
19:37:02|fromtester@trendmicro|totester@trendmicro.com|subject|Delete|Deliver|
Explanation This system log message is generated when the CSC SSM detects an anti-spam event in the SMTP or POP3 scanning. The spam mail has been processed or blocked according to the policy setting.
•
•
•
•
•
Recommended Action If the spam mail is generated from a similar source, you may add this source to the Blocked Sender list to reduce the e-mail volume.
Spyware/Grayware detection event
Error Message    is-protocol-virus: time|malware_name|malware_type|from_address|
to_address|email_subject|action_on_the_content|action_on_the_email|
Example:
is-mail-grayware: 2006/01/01 16:33:01|
|Spyware|fromtester@trendmicro.com|totester@trendmicro.com|subject|Delete|Deliver|
Explanation This system log message is generated when the CSC SSM detects a spyware or grayware event in the connection. The suspicious file has been processed or blocked according to the policy setting.
•
•
•
•
•
•
•
•
Recommended Action If the file is originated from an internal machine, perform virus scanning on that machine.
Syslog adaptor starting
Error Message is-syslog: ISSyslog Adaptor 1.0Example:
is-syslog: ISSyslog Adaptor 1.0Explanation This system log message is generated when the CSC SSM starts the InterScan Syslog Adaptor.
Recommended Action None.
System monitor started
Error Message SysMonitor: INFO: SysMonitor started.Example:
SysMonitor: INFO: SysMonitor started.Explanation This system log message is generated when the system monitor has started.
Recommended Action None.
Time synchronization with the ASA chassis failed
Error Message is-service-module[process_id]: ASA time sync failedExample:
is-service-module[5532]: ASA time sync failed.Explanation This system log message is generated when the Service Module is unable to synchronize the SSM system time with the adaptive security appliance system time.
•
Recommended Action None required.
Virus detection event
Error Message    is-protocol-virus: time|malware_name|malware_type|from_address|
to_address|email_subject|action_on_the_content|action_on_the_email|
Example:
is-mail-virus: 2006/01/01 16:33:01|
WORM_GREW.A|Virus|fromtester@trendmicro.com|totester@trendmicro.com|subject|Delete|Deliver
|
Explanation This system log message is generated when the CSC SSM detects a virus event in the connection. The infected file has been processed or blocked according to the policy setting.
•
•
•
•
•
•
•
•
Recommended Action If the file is originated from an internal machine, perform virus scanning on that machine.
Before Contacting Cisco TAC
Before you contact the Cisco Technical Assistance Center (TAC), check the documentation and online help to see whether it contains the information you need. If you have checked the documentation and the Knowledge Base and still need help, be prepared to give the following information to Cisco TAC:
•
•
•
•
•
•
For more information, see Obtaining Technical Assistance, page xvi.