Feedback
Table Of Contents
Viewing the Switch Information
Setting Up NBAR Protocol Discovery
Enabling and Disabling Port Stats (Mini-RMON)
Applying Router System Information
Understanding NetFlow Interfaces
Understanding NetFlow Flow Records
Configuring NetFlow on Devices
Configuring VACL on a WAN Interface
Configuring VACL on a LAN VLAN
Testing the Router Community Strings
Understanding Wide Area Application Services
ART Monitoring from WAAS Data Sources
Managing a WAAS Monitored Server
Adding a WAAS Monitored Server
Deleting a WAAS Monitored Server
Automatic Discovery of MPLS VPN Labels
Setting Up Layer 3 VRF Data Sources
Setting Up Layer 2 Virtual Circuit Data Sources
Setting Up MPLS Label Data Sources
Creating a VRF/VC Configuration File
Importing a VRF/VC Configuration File
Exporting a VRF/VC Configuration File
Sending ERSPAN Data to Layer 3 Interface
Sending ERSPAN Data Directly to the NAM Management Interface
Setting Up Response Time Configuration
Setting Up Response Time Data Monitoring
Creating a Response Time Monitoring Collection
Editing a Response Time Monitoring Collection
Deleting Response Time Data Collections
Setting Up the DiffServ Profile
Monitoring URL Collection Data
Setting Up Autolearned Protocols
Setting Up URL-Based Applications
Creating a URL-Based Application
Editing a URL-Based Application
Deleting a URL-based Application
Setting Up Alarm Events and Thresholds
Alarm Thresholds - Selecting a Variable
Alarm Thresholds - Selecting Parameters
Setting Up Voice/Video Stream Thresholds
Setting Chassis or Managed Device Thresholds
Creating Chassis or Managed Device Thresholds
Editing Chassis or Managed Device Thresholds
Deleting Chassis or Managed Device Thresholds
Creating a NAM Trap Destination
Editing a NAM Trap Destination
Deleting a NAM Trap Destination
Setting Up the Application
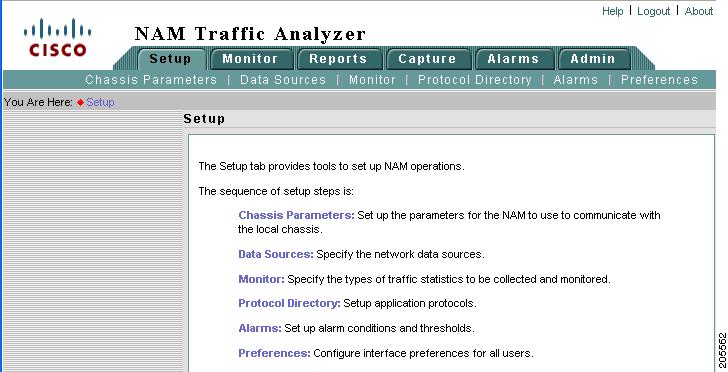
Use the Setup window, Figure 3-1, to set up and configure the NAM application. Set up the NAM application in the sequence shown.
Figure 3-1 Setup Window
Note
The Setup window does not support IPv6 except for the setting of alarm events and thresholds.
This chapter contains the following sections:
•
Chassis Parameters
From the Chassis Parameter window, you can view the switch system information, enable and disable NBAR, enable and disable port stats (mini-Rmon), and configure switch login configuration.
•
•
•
Viewing the Switch Information
Note
To view the Switch Information, Table 3-1, choose Setup > Chassis Parameters.
Setting Up NBAR Protocol Discovery
Note
From the Chassis Parameter window, you can view the NBAR Status information and enable or disable NBAR on all interfaces.
To set up NBAR protocol discovery:
Step 1
Note
The NBAR Status window appears with the following options:
•
•
•
•
Note
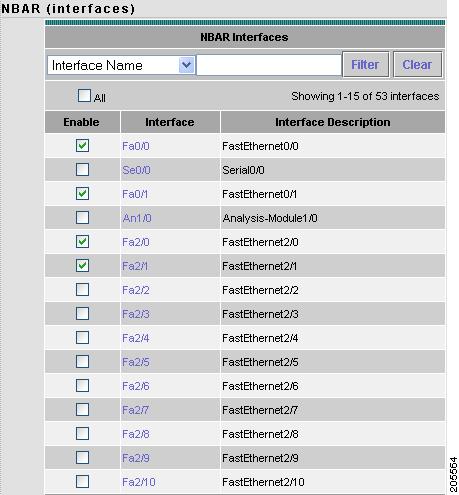
The NBAR Interfaces window displays. Figure 3-2 shows an example of the NBAR Interfaces window.
Figure 3-2 NBAR Interfaces Window
The NBAR Interfaces window lists known interfaces by name and type. Check its check box to enable an interface.
You must enable the NBAR Interfaces feature for the NAM to provide information about ethernet ports on the Monitor > NBAR window. Select the ports you want to enable, then click Submit to turn on NBAR for those ports.
The All check box affects only the ports displayed on the current screen. Click the All check box to select all ports displayed on the current window. Clear the All check box to deselect all ports displayed on the current window. The Reset button resets the any changes you might have made to the NBAR window and it reverts to its previous settings.
To view details on an individual Port Stat, click on the Port Name. A Port Statistics detail window displays with the following information:
•
•
•
•
•
•
•
•
Tip
Note
Tip
Enabling and Disabling Port Stats (Mini-RMON)
Note
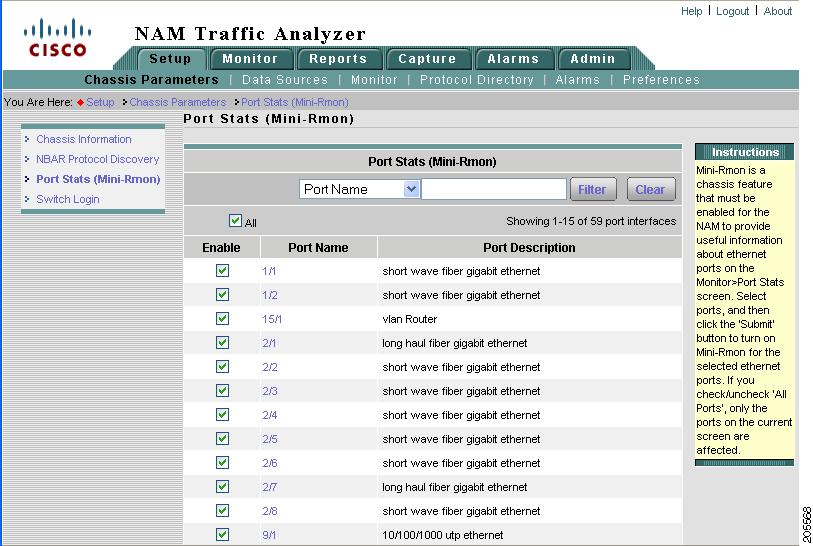
You must enable the Mini-Rmon switch feature for the NAM to provide information about ethernet ports on the Monitor > Port Stats window. Select the ports you want to enable, then click Submit to turn on Mini-Rmon for those ports. Click the All check box to select or deselect the ports displayed on the current screen.
The Reset button resets the any changes you might have made to the Mini-RMON ports window and it reverts to its previous settings.
Note
To enable and disable interfaces or view Port Stats details:
Step 1
The Switch Information, Table 3-1, displays.
Step 2
The Port Stats (Mini-RMON) window displays listing known ports and their type. Figure 3-3 shows an example of the top portion of the Port Statistics (Mini-RMON) window.
Figure 3-3 Port Stats (Mini-RMON) Window
Port Stats (Mini-RMON) Details
Table 3-3 describes the fields of the Port Stats (Mini-RMON) window.
Step 3
After you make changes to this window, click Submit to apply the changes, then click Save to save the changes to the start-up configuration.
The Refresh button causes the NAM to update the switch configuration information with the current configuration. The All check box affects only the ports listed on this window. The Reset button resets the any changes you might have made to the Mini-RMON ports window and it reverts to its previous settings.
Step 4
A Port Statistics detail window displays with the following information:
•
•
•
•
•
•
•
•
Tip
Configuring Switch Login
The NAM uses switch login information to log in to switches to monitor MPLS. You must provide a user name, password (if required), and login method, either telnet or SSH. Table 3-4 describes the fields and functions of the Switch Login Configuration window.
Note
Router Parameters
From the Router Parameter window you can view the router information and set up NBAR Protocol Discovery.
•
•
Applying Router System Information
This section describes how to set router parameters.
Note
Step 1
The Router System Information displays as shown in Table 3-5.
Step 2
•
•
•
Managed Device Parameters
From the Managed Device Parameters window, you can set up and view managed device information, enable and disable port stats (mini-Rmon), enable and disable NBAR, and configure managed device login configuration.
Note
To view or set up managed device parameters,
Step 1
The Managed Device Parameters window appears. The Managed Device Information displays the following from the appliance's configuration:
•
•
•
•
•
•
Step 2
Enter the same IP address that was configured on the managed device.
Step 3
Enter the same read-write community string that was configured on the managed device or the NAM cannot communicate via SNMP with the managed device.
Step 4
Step 5
Note
Data Sources
There are several versions of the Cisco NAM:
•
•
•
•
•
–
–
–
•
•
–
–
The NME-NAM device has two Gigabit Ethernet ports—an internal interface and an external interface. The NM-NAM device has two FastEthernet data ports—an internal interface and an external interface. One of the two interfaces must be selected as the NAM management port for IP traffic (such as HTTP and SNMP). The NAM can monitor traffic for analysis on the internal interface, the external interface, or both simultaneously. A typical configuration is to monitor LAN and WAN traffic on the internal interface. However, the external interface can be used to monitor LAN traffic.
Depending on the IOS running on the Supervisor, port names are displayed differently. Earlier versions of CatOS displayed port names as 2/1 and 3/1 meaning module 2, port 1 and module 3 port 1. Newer versions of IOS software display a port name as Gi2/1 to represent a Gigabit port on module 2 port 1. In the VSS, a port name might be displayed as Gi1/2/1to represent a Gigabit port on switch 1, module2, port 1.
The following information describes how to set up NetFlow and SPAN sessions for the WS-SVC-NAM-1 and WS-SVC-NAM 2 devices.
WS-SVC-NAM-1 devices can have only one active SPAN session. You can select a switch port, VLAN, or EtherChannel as the SPAN source; however, you may select only one SPAN type. WS-SVC-NAM-2 devices and switch software support two SPAN destination ports.
Before you can monitor data, you must direct specific traffic flowing through a switch to the NAM for monitoring purposes. Use the methods described in the Methods of Directing Traffic table (Table 3-6).
SPAN Sessions
Note
Table 3-7, SPAN Sources, describes the streams of traffic you can use as SPAN data sources.
You can also use locally generated NDE records (the NDE source) as a packet stream to populate NAM collections. You can activate only a subset of the NAM collection types defined in the NDE Collection Types Table, Table 3-8, on the NDE source.
Note
Table 3-9 Active SPAN Sessions Dialog
Monitor Session
Monitor session of the SPAN.
Note
Type
Type of SPAN source
Source - Direction
Source of the SPAN session and direction of the SPAN traffic.
For port SPAN types, the source displays the port name and source status after you SPAN it—down, testing, or dormant.
When creating a SPAN session, you can select all ports regardless of their state. See Table 3-10 for a description of the possible SPAN states.
Note
Dest. Port
Destination port of the SPAN session.
Dest. Module
Destination module of the SPAN session.
Status
Status of the SPAN session:
Active—Traffic at the SPAN source is being copied to the SPAN destination
Inactive—Traffic at the SPAN source will not be copied to the SPAN destination
Unknown—A mixture of both active and inactive status
Create
Click to create a SPAN session.
Save
Saves the current active SPAN session in the running-configuration to the startup-configuration for switches running Cisco IOS software only.
Add Dest. Port 1
Click to add NAM Port 1 to the selected SPAN session as a SPAN destination.
Note
Add Dest. Port 2
Click to add NAM Port 2 to the selected SPAN session as a SPAN destination.
Note
Edit
Click to edit the selected SPAN session.
Delete
Click to delete the selected SPAN session.
Note
Table 3-10 lists the possible SPAN states. The SPAN state displays in parenthesis in the Source - Direction column.
Creating a SPAN Session
Note
Creating a SPAN session on a switch running Catalyst OS software and a switch running Cisco IOS software are different. The following procedure applies to switches running both Catalyst OS and Cisco IOS software unless otherwise stated.
Step 1
The Active SPAN Sessions Dialog (Table 3-9) displays. The SPAN session directed to the NAM is selected by default, otherwise the first radio button is selected.
Step 2
The Create SPAN Session Dialog (Table 3-11) displays. Switch Port is the default for the SPAN Type.
Step 3
Step 4
The Active SPAN Sessions window displays and the SPAN session is saved for switches running Catalyst OS software only.
Step 5
Note
Editing a SPAN Session
You can only edit SPAN sessions that have been directed to the NAM.
Note
To edit a SPAN session:
Step 1
The Active SPAN Sessions dialog box displays.
Step 2
The Edit SPAN Session Dialog Box, Table 3-12, displays.
Step 3
Deleting a SPAN Session
Note
To delete a SPAN session, select it from the Active SPAN Session dialog box, then click Delete.
Use this anchored frame for wider illustrations that align with left edge of text block.
VLAN Data Sources
Note
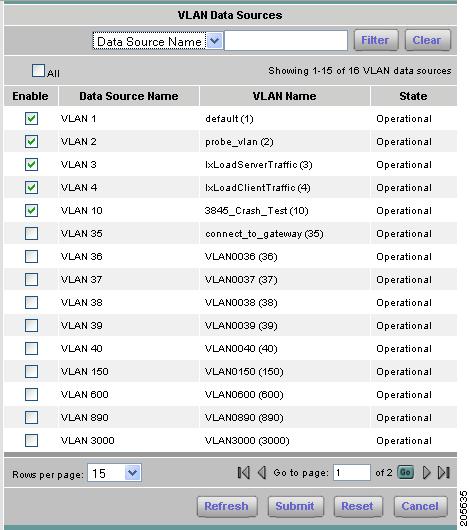
Unlike NAM-1 and NAM-2 devices where you can choose VLAN data sources from a drop-down menu, you must create VLAN data sources for the Cisco 2200 Series NAM appliance to monitor.
Figure 3-4 shows an example of the available VLAN Data Sources window.
You must create the VLAN data sources here first or they will not be available in the Data Source drop-down menu on the Setup > Monitor > Core Monitoring window.
To create a VLAN data source:
Step 1
The Active SPAN Sessions Dialog displays.
Step 2
The VLAN Data Sources window displays any VLAN data sources that have already been created.
Step 3
The VLAN Data Source window displays. This window lists available VLANs. The VLANs with check marks have data sources created. Figure 3-4 shows an example of the VLAN Data Source window.
The NAM appliance detects the available VLANs after you set up the IP address and Community String of the managed device on the Setup > Managed Device Parameters window.
Step 4
Click Refresh to refresh the database of the device to which the appliance is connected.
Click Submit to create or delete VLAN data sources, depending on the data source you checked.
Figure 3-4 Available VLANs
Deleting a VLAN Data Source
To delete a VLAN data source:
Step 1
The Active SPAN Sessions Dialog displays.
Step 2
The VLAN Data Sources window displays and lists VLAN data sources available on the NAM appliance.
Figure 3-4, Available VLANs, shows an example of the VLAN Data Sources window.
Step 3
Understanding NetFlow Interfaces
To use a managed device as an NDE data source for the NAM, you must configure the managed device itself to export NDE packets to UDP port 3000 on the NAM. You might need to configure the device itself on a per-interface basis. An NDE device is identified by its IP address. By default the switch's local supervisor engine is always available as an NDE device.
You can define additional NDE devices by specifying the IP addresses and (optionally) the community strings. Community strings are used to upload convenient text strings for interfaces on the managed devices that are monitored in NetFlow records.
Distinguishing among different interfaces on the remote NDE devices is a feature in this release that allows you to arbitrarily bundle groups of interfaces on each remote NDE device into a conceptual data source instead of simply grouping all flows into the same collections.
If you try to distinguish every interface on every managed device (potentially in both directions separately), this action could result in a large, unmanageable number of data sources. By using conceptual data sources, you have complete flexibility to group all interfaces in all directions into a single conceptual data source.
You could also choose to create a separate conceptual data source for each interface on the device. In general, you can combine any number of "simple flow paths" to form a conceptual data source. Each simple flow path can consist of a single interface in the input direction, the output direction, or both directions.
The following restrictions apply to creating conceptual data sources and assigning flow paths to them.
•
•
•
Understanding NetFlow Flow Records
An NDE packet contains multiple flow records. Each flow record has two fields:
•
•
Note
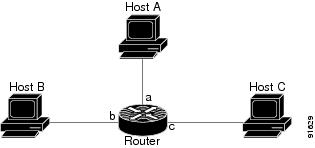
In most cases, turning on NetFlow on an interface populates the NetFlow cache in the device with flows that are in the input direction of the interface. As a result, the input SNMP ifIndex field in the flow record has the ifIndex of the interface on which NetFlow was turned on. Sample NetFlow Network, Figure 3-5, shows a sample network configuration with a NetFlow router.
Figure 3-5 Sample NetFlow Network
The Reporting Flow Records table (Table 3-13) lists the reported flows if NetFlow is enabled on interface a.
Table 3-13 Reporting Flow Records
a
b
Yes
a
c
Yes
b
c
No
b
a
No
c
a
No
c
b
No
Configuring NetFlow on Devices
The configuration commands for NetFlow devices to export NDE packets to the NAM are platform and device specific. The example configuration commands provided here are the ones most commonly found for devices running Cisco IOS or Catalyst OS. For more detailed information, see your device documentation.
For Devices Running Cisco IOS
Step 1
Prompt#configure terminalPrompt(config)# interface <type slot/port>Prompt(config-if)# ip route-cache flowStep 2
Prompt(config)# ip flow-export destination <NAM IP address> 3000
For Devices Supporting Multi-Layer Switching Cache Running Cisco IOS
Step 1
Prompt(config)# mls nde sender version <version-number>
Note
Step 2
Prompt(config)# mls flow ip fullStep 3
Prompt(config)# mls nde senderStep 4
Prompt(config)# ip flow-export destination <NAM IP address> 3000
For Devices Supporting NDE v8 Aggregations Running Cisco IOS
Step 1
Prompt(config)# ip flow-aggregation cache <aggregation-type>Where aggregation-type can be:
•
•
•
•
Step 2
Prompt(config-flow-cache)# enableStep 3
Prompt(config-flow-cache)#export destination <NAM address> 3000
For Devices Running Catalyst OS
Step 1
Prompt>(enable) set mls nde version <nde-version-number>
Note
Step 2
Prompt>(enable) set mls flow fullStep 3
Prompt>(enable) set mls nde enableStep 4
Prompt>(enable) set mls nde <NAM address> 3000
For Devices That Support NDE Export From Bridged-Flows Statistics
Step 1
Prompt>(enable) set mls bridged-flow-statistics enable <vlan-list>Step 2
Prompt>(enable) set mls nde <NAM address> 3000
For NAMs Located in a Device Slot
If the NAM is located in one of the device slots, the device can be set up to export NDE packets to the NAM.
Step 1
Prompt>(enable) set mls nde version <nde-version-number>Step 2
Prompt>(enable) sel mls nde fullStep 3
Prompt>(enable) set mls nde enableStep 4
Prompt>(enable) set snmp extendedrmon netflow enable <NAM-slot>
Configuring VACL on a WAN Interface
Because WAN interfaces do not support the SPAN function, you must use the switch CLI to manually configure a VACL in order to monitor WAN traffic with the NAM. This feature only works for IP traffic over the WAN interface.
VACL can also be used of there is no available SPAN session to direct traffic to the NAM. In this case, a VACL can be set up in place of a SPAN for monitoring VLAN traffic.
The following example shows how to configure a VACL on an ATM WAN interface and forward both ingress and egress traffic to the NAM. These commands are for switches running Cisco IOS version 12.1(13)E1 or higher. For LAN VACLs on Catalyst OS, the security Access Control List (ACL) feature can be used to achieve the same result. For more information on using these features, see your accompanying switch documentation.
Cat6509#config terminalCat6509(config)# access-list 100 permit ip any anyCat6509(config)# vlan access-map wan 100Cat6509(config-access-map)# match ip address 100Cat6509(config-access-map)# action forward captureCat6509(config-access-map)# exitCat6509(config)# vlan filter wan interface AM6/0/0.1Cat6509(config)# analysis module 3 data-port 1 capture allowed-vlan 1-4094Cat6509(config)# analysis module 3 data-port 1 captureCat6509(config)# exitTo monitor egress traffic only, get the VLAN ID that is associated with the WAN interface by using the following command:
Cat6509#show cwan vlan
Hidden			VLAN		swidb->i_number					Interface
1017 94 ATM6/0/0.1
Once you have the VLAN ID, configure the NAM data port using the following command:Cat6509(config)# analysis module 3 data-port 1 capture allowed-vlan 1017To monitor ingress traffic only, replace the VLAN number in the capture configuration with the native VLAN ID that carries the ingress traffic. For example, if VLAN 1 carries the ingress traffic, you would use the following command:
Cat6509(config)# analysis module 3 data-port 1 capture allowed-vlan 1Configuring VACL on a LAN VLAN
For VLAN Traffic monitoring on a LAN, traffic can be sent to the NAM by using the SPAN feature of the switch. However, in some instances when the traffic being spanned exceeds the monitoring capability of the NAM, you might want to pre-filter the LAN traffic before it is forwarded. This can be done by using VACL.
The following example shows how to configure VACL for LAN VLAN interfaces. In this example, all traffic directed to the server 172.20.122.226 on VLAN 1 is captured and forwarded to the NAM located in slot 3.
Cat6509#config terminalCat6509#(config)#access-list 100 permit ip any anyCat6509#(config)#access-list 110 permit ip any host 172.20.122.226Cat6509#(config)#vlan access-map lan 100Cat6509#(config-access-map)match ip address 110Cat6509#(config-access-map)#action forward captureCat6509#(config-access-map)#exitCat6509#(config)#vlan access-map lan 200Cat6509#(config-access-map)#match ip address 100Cat6509#(config-access-map)#action forwardCat6509#(config-access-map)#exitCat6509#(config)#vlan filter lan vlan-list 1Cat6509#(config)#analysis module 3 data-port 1 capture allowed-vlan 1Cat6509#(config)#analysis module 3 data-port 1 captureCat6509#(config)#exitManaging NetFlow Devices
Before you can monitor NetFlow data, you must add the NetFlow devices to be monitored. The remote NDE device must also be configured to export NDE packets to the NAM. For more information on configuring NetFlow on devices, see the "Configuring NetFlow on Devices" section or your accompanying device documentation. The following topics help you set up and manage the devices used for NetFlow monitoring:
Adding NetFlow Devices
After you add a NetFlow device, NetFlow data sources are automatically created for that device. You can use the Listening Mode to verify that NDE packets are active on these data sources. For more information on using the Listening Mode, see the "Using the Listening Mode" section.
To create a device:
Step 1
The Active SPAN Sessions table displays.
Note
Step 2
The NetFlow Devices table displays.
Step 3
The New Device dialog box appears.
Step 4
•
•
•
Editing NetFlow Devices
Note
To edit a NetFlow device:
Step 1
Step 2
The Active SPAN Sessions table displays.
Step 3
The NetFlow Devices table displays.
Step 4
The Edit Device window appears.
Step 5
•
•
•
Deleting NetFlow Devices
To delete a NetFlow device:
Step 1
The Active SPAN Sessions table displays.
Step 2
The NetFlow Devices table displays.
Step 3
Note
Testing NetFlow Devices
You can test the SNMP community strings for the devices in the Devices table. To test a device, select it from the Devices table, then click Test. The Device System Information Dialog Box (Table 3-14) displays.
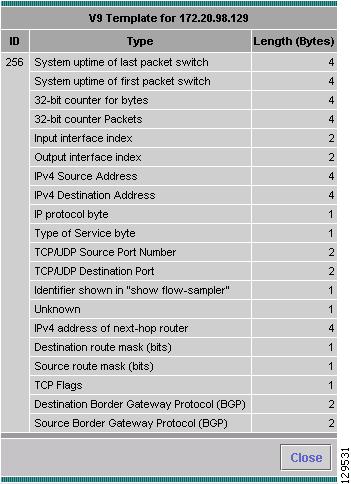
If the device is sending NetFlow Version 9 (V9) and the NAM has received the NDE templates, then a V9 Templates button appears below the Device System Information window.
Note
To view the NetFlow V9 templates, click the V9 Templates button. For more information, see Table 3-17 in Using the Listening Mode.
Creating Custom Data Sources
A NetFlow data sources are automatically learned when you create a device in the Devices section. For more information on creating NetFlow devices, see the "Adding NetFlow Devices" section. This option allows you to create custom data sources on NetFlow devices with specific interface information.
To create a custom data source:
Step 1
Step 2
The NetFlow Data Sources table displays.
Step 3
The following table shows the wizard used to create or edit a NetFlow data source.
Selecting a NetFlow Device
To select a NetFlow device:
Step 1
Step 2
Step 3
Selecting the Interfaces
To select an interface:
Step 1
Step 2
Tip
If no interfaces are listed, manually enter them in the Interface Index text box.
Step 3
The selected interfaces are displayed in the Selected Interfaces section.
•
•
Step 4
Special (0) Interface
NDE packets sometimes have NetFlow records reporting either (or both) input if-index and output if-index fields as being 0. This could be a result of one or more of the following reasons:
•
•
•
For more information, see the accompanying documentation for your NetFlow device.
Verifying NetFlow Data Source Information
To verify NetFlow data source information:
Step 1
Step 2
•
•
Editing a Custom Data Source
To edit a custom data source:
Step 1
Step 2
The NetFlow Data Sources table displays.
Step 3
The wizard used to edit NetFlow data sources displays.
Step 4
•
•
Deleting a Custom Data Source
To delete a data source, select it from the NetFlow Data Source table, then click Delete.
Note
Using the Listening Mode
The Listening Mode of the NAM allows you to view the IP addresses of devices sending NDE packets to the NAM, the number of NDE packets, and time that the last NDE packet was received. The NetFlow Listening Mode table only lists devices that the NAM currently receives NDE packets from.
To use listening mode:
Step 1
Step 2
The NetFlow Listening Mode Table (Table 3-15) displays.
Step 3
Step 4
Note
Viewing Details from the NetFlow Listening Mode Table
Select the device from the table, then click Details.
The Device Details Window (Table 3-16) displays.
If the device is sending NetFlow Version 9 (V9) and the NAM has received the NDE templates, then a V9 Templates button appears below the Device Details window. For more information, see:
http://www.cisco.com/en/US/products/sw/iosswrel/ps5187/products_feature_guide09186a00801b0696.html
Note
To view the NetFlow V9 templates, click the V9 Templates button.
The V9 Templates Window (Figure 3-6) displays (see example below).
Figure 3-6 V9 Templates Window
The V9 Templates Table (Table 3-17) describes the template data.
Table 3-17 V9 Templates Table
Type
Type of template data.
Length (Bytes)
Length of template data in bytes.
Adding a Device To Monitor
To add a device to monitor:
Step 1
The New Device Window displays.
Step 2
The new device is added to the NetFlow Devices table.
Testing the Router Community Strings
For NM-NAM or NME-NAM Devices Only
Before the router can send information to the NAM using SNMP, the router community strings set in the NAM Traffic Analyzer must match the community strings set on the actual router. The Router Parameters dialog box displays the router name, hardware, Supervisor engine software version, system uptime, location, and contact information.
The local router IP address and the SNMP community string must be configured so that the NAM can communicate with the local router.
To set the community strings on the router, use the router CLI. For information on using the CLI, see the documentation that accompanied your device.
Caution
To test router community strings:
Step 1
The Router Parameters dialog box displays.
Step 2
The Router Community String Test dialog box displays.
Setting Up an Interface
Note
Before you can view traffic statistics and the TopN traffic for applications, hosts, and conversations, you must first set up the interfaces.
Click in the check box to enable Netflow NDE on the selected interface and all of its sub-interfaces. A NAM NDE datasource will be created for each enabled sub-interface, and hosts, conversations and application NDE data sources will also be created. This action populates the Monitor > Router detail window with the hosts, conversations and application statistics.
In the case of parent interfaces with sub-interfaces, only the leaf child will be enabled. For example, ATM2/0.1-atm-subif has child ATM2/0.1-aal5-layer. Only the aal5-layer will be enabled. NDE will only be seen on this child interface.
Note
To set up interfaces to enable you to view traffic statistics:
Step 1
NAM 4.0 supports up to 1,500 datasources.
Step 2
The Interfaces window displays.
Router interfaces and SNMP Read/Write Community strings must also be configured. See Router Parameters for more information.
Step 3
Understanding Wide Area Application Services
Cisco wide area application services (WAAS) optimizes the performance of TCP-based applications operating in a wide area network (WAN) environment and preserves and strengthens branch security. The WAAS solution consists of a set of devices called Wide Area Application Engines (WAEs) that work together to optimize WAN traffic over your network.
When client and server applications attempt to communicate with each other, the network devices intercepts and redirects this traffic to the WAEs to act on behalf of the client application and the destination server.
WAE flow agents provide information about packet streams traversing through both LAN and WAN interfaces of WAAS WAEs. Traffic of interest can include specific servers and types of transaction being exported. NAM processes the data exported from WAAS flow agents and performs application response time calculations and enters the data into reports you set up.
The WAEs examine the traffic and using built-in application policies to determine whether to optimize the traffic or allow it to pass through your network not optimized.
You can use the WAAS Central Manager GUI to centrally configure and monitor the WAEs and application policies in your network. You can also use the WAAS Central Manager GUI to create new application policies so that the WAAS system will optimize custom applications and less common applications.
Cisco WAAS helps enterprises to meet the following objectives:
•
•
•
•
•
–
–
–
For more information about WAAS and configuring the WAAS components, see the document:
Cisco Wide Area Application Services Configuration Guide, OL-16376-01
http://www.cisco.com/en/US/docs/app_ntwk_services/waas/waas/v4019/configuration/guide/
waas4cfg.htmlART Monitoring from WAAS Data Sources
The NAM processes the TCP flow data exported from WAAS Flow Agents and performs application response time (ART) calculations and reports. You use the NAM GUI to create a WAAS data source to monitor WAAS traffic statistics. In addition to ART, NAM monitors and reports other traffic statistics of the WAAS data sources including application, host, and conversation information.
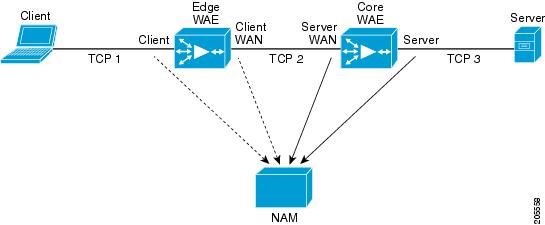
The NAM provides different ART metrics by collecting data at different points as packets flow along their paths. The NAM provides five different collection points, four represented by a WAAS data source. Figure 3-7 shows an example of the data collection points. In Figure 3-6, the solid line represents data exported from a WAAS device and/or directly monitored traffic like SPAN. The broken line represents data exported from a WAAS device only.
Figure 3-7 WAAS Data Sources (Data Collection Points)
You can use the NAM GUI to configure data sources at the following locations in the network:
•
•
•
•
You can also configure a data source to use Export Passthrough data. For more information about configuring WAAS data sources, see Configuring WAAS Data Sources.
Monitoring Client Data Sources
By monitoring the TCP connections between the client and the WAE device (Client segment in Figure 3-7), you can measure the following ART metrics:
•
•
•
•
•
Monitoring WAN Data Sources
By monitoring the TCP connections between the edge and core WAE devices (Client WAN and Server WAN segments in Figure 3-7), you can measure the following:
•
•
Monitoring Server Data Sources
By monitoring the TCP connections between the core WAE devices and the servers (Server segment in Figure 3-7), you can measure the following ART metrics:
•
•
Note
Managing WAAS Devices
Before you can monitor WAAS traffic, you must first configure the WAAS device to export WAAS flow record data to the NAM using the WAAS command-line interface (CLI) flow monitor command like the following:
flow monitor tcpstat-v1 host <nam IP address>
flow monitor tcpstat-v1 enable
After you enable flow export to the NAM using WAAS CLI commands like those above, WAAS devices will be detected and automatically added to the NAM's WAAS device list.
You must then configure which WAAS segments you want to monitor as WAAS data sources: Client, Client WAN, Server WAN, and/or Server. See Configuring WAAS Data Sources, for more detailed information.
You can also use the Central Manager (CM) to centrally to issue WAAS CLI commands to configure a large number of WAEs at one time.
Note
For more information about WAAS and configuring the WAAS components, see the document:
Cisco Wide Area Application Services Configuration Guide, OL-16376-01
http://www.cisco.com/en/US/docs/app_ntwk_services/waas/waas/v4019/configuration/guide/
waas4cfg.htmlThis section contains the following topics:
•
Adding a WAAS Device
Note
To manually add a WAAS device to the list of devices monitored by the NAM:
Step 1
Step 2
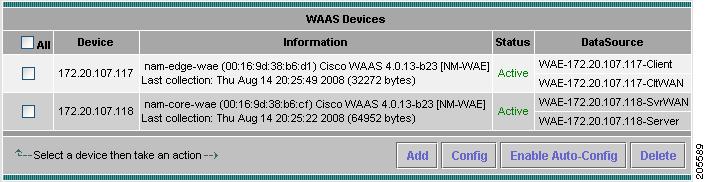
The WAAS Custom Data Sources table displays. Figure 3-8 shows an example of the WAAS Custom Data Source table.
Figure 3-8 WAAS Custom Data Sources Table
Step 3
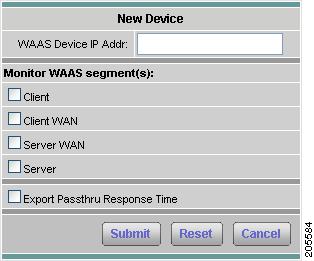
The New Device dialog box displays. Figure 3-9 shows an example of the Add New WAAS Device window.
Figure 3-9 Add New WAAS Device
Step 4
See Configuring WAAS Data Sources, for more information.
Step 5
Configuring WAAS Data Sources
The NAM uses WAAS data sources to monitor traffic collected from different WAAS segments: Client, Client WAN, Server WAN, and Server. Each WAAS segment is represented by a data source. You can set up the NAM to monitor and report other traffic statistics of the WAAS data sources such as application, host, and conversation information in addition to the monitored ART metrics.
To configure a WAAS device's custom data source:
Step 1
Step 2
The WAAS Device table displays.
Step 3
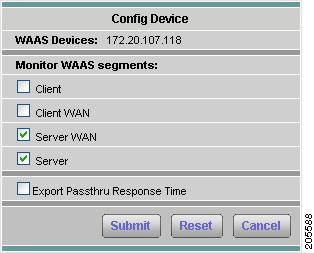
The Config Device dialog box displays the WAAS device IP address and the WAAS segments previously set to monitor. Figure 3-10 shows an example of the Configure WAAS Device window.
Figure 3-10 Configure WAAS Device
You can configure the WAAS data sources to monitor the following WAAS segments as shown in Figure 3-7, WAAS Data Sources (Data Collection Points):
•
•
•
•
Table 3-18, WAAS Data Source Configurations, lists six different deployment scenarios you might consider to monitor the optimized traffic on your WAAS network. Scenario #1 is typical when using NAM-1 and NAM-2 blades. Scenario #2 is typical when using NM-NAM and NME-NAM devices.
SPAN data sources might take the place of the WAE Server data sources listed in Table 3-18. For example, if you already configure SPAN to monitor the server LAN traffic, its not necessary to enable the Server data source on the WAE device.
Note
Step 4
Note
See Response Time Export, page 2-22, for more information.
Deleting a WAAS Data Source
To delete a WAAS custom data source:
Step 1
Step 2
The WAAS Custom Data Sources table displays.
Step 3
A dialog box displays the device address and asks if you are sure you want to delete the device.
Auto-Config New WAAS Devices
If you have numerous WAE devices, you can setup the NAM to configure newly discovered WAE devices using a pre-defined configuration template using the NAM Auto Config option.
Note
To configure WAAS auto-config:
Step 1
Step 2
The WAAS Device table displays. Figure 3-8 shows an example of the WAAS Custom Data Source table.
Step 3
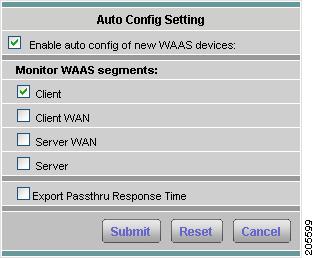
The Auto-Config Setting window displays. Figure 3-11 shows an example of the WAAS Device Auto Config Setting window.
Figure 3-11 WAAS Device Auto Config Setting Window
Step 4
Note
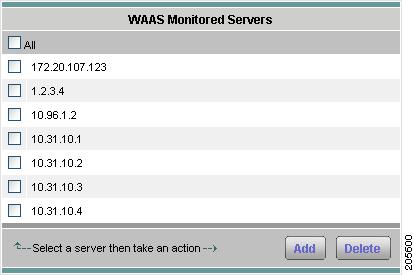
Managing a WAAS Monitored Server
WAAS monitored servers specify the servers a NAM monitors. To enable WAAS monitoring, you must list the servers to be monitored by the NAM using the WAAS device's flow monitoring.
Note
This section contains the following topics:
•
•
Adding a WAAS Monitored Server
To add a WAAS monitored server:
Step 1
Step 2
The WAAS Monitored Servers table displays. Figure 3-12 shows an example of the WAAS Monitored Servers table.
Figure 3-12 WAAS Monitored Servers Table
Step 3
The New Device dialog box displays.
Step 4
Step 5
Deleting a WAAS Monitored Server
To delete a WAAS monitored server data source:
Step 1
Step 2
The WAAS Monitored Servers table displays any WAAS monitored servers.
Step 3
A confirmation dialog displays to ensure you want to delete the selected WAAS monitored server.
Step 4
MPLS Data Sources
When data packets containing MPLS labels are spanned to the NAM, the traffic can be monitored by the tag inside the data packets. This feature is especially useful in a network that deploys MPLS/VPN where traffic from each VPN can be uniquely identified by a combination of MPLS labels. When the NAM encounters stacked MPLS labels, only the relevant inner-most label (the bottom tag in the label stack) is used for monitoring.
To enable RMON monitoring for MPLS, you must first configure an MPLS data source. To enable MPLS traffic monitoring, you must create a form of virtual interface that can be tied to a particular MPLS tag. After setting up the custom MPLS data source, you can enable monitoring of the following:
•
•
•
This section contains the following topics:
•
•
•
•
•
•
•
Automatic Discovery of MPLS VPN Labels
In an MPLS VPN environment, the NAM can monitor traffic using either VPN routing/forwarding (VRF) table name or virtual circuit (VC) ID configured at the switch. This higher level of abstraction hides the underlying label associations.
The VRF and VC information can only be obtained from the switch CLI. This requires you to provide the switch login credentials, username and password, and whether to access the switch CLI through telnet or ssh. Enable mode password is not required.
After the VRF, VC, and the associated labels are discovered, you can reference the VRF or VC using either the VRF name or VC ID directly without any knowledge of the underlying labels using the NAM monitoring functions.
The labels associated with each VRF or VC are allocated dynamically by the switch. As a result, the labels will not be persistent when the switch is rebooted or a supervisor switch-over occurred. The NAM will have to re-discover VRF and VC information from the switch under these situations. A manual refresh feature is also provided for on-demand refresh.
Setting Up Layer 3 VRF Data Sources
To set up layer 3 VPN routing/forwarding (VRF) table (L3 VRF) data sources:
Step 1
The Active SPAN Sessions table displays.
Step 2
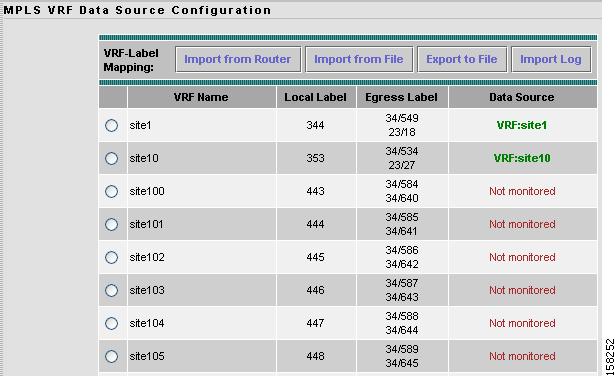
The MPLS VRF Data Source Configuration window displays shown in Figure 3-13.
Figure 3-13 MPLS VRF Data Source Configuration Window
Step 3
If the list is still empty after clicking Import from Router, the NAM failed to automatically import VRF configuration from the router. In this case, perform Step 4. If the VRF information is available, proceed to Step 5.
If the NAM failed to automatically import VRF configuration from the router, click Import Log. The MPLS Import log contains information that might help you diagnose the problem in the connection. See Importing Log, for more information about the Import Log.
Step 4
After clicking Import from File, the Import VRF/VC Configuration window displays enabling you to specify the location from which to import the VRF/VC configuration file. The VRF/VC configuration file might be on your local machine or at a remote URL.
See Creating a VRF/VC Configuration File, for information about how to create the text VRF/VC configuration file.
Step 5
Creating or deleting a NAM data source does not affect the switch configuration.
Setting Up Layer 2 Virtual Circuit Data Sources
To set up layer 2 (L2) virtual circuit data sources:
Step 1
The Active SPAN Sessions table displays.
Step 2
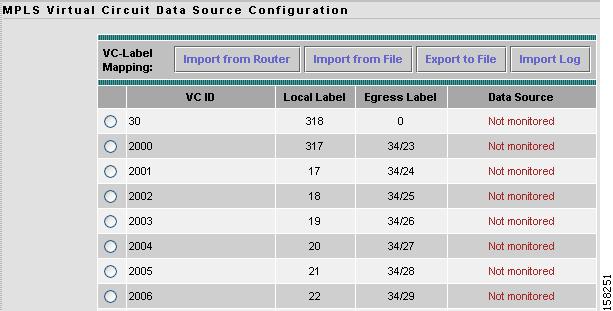
The MPLS Virtual Circuit Data Source Configuration window displays shown in Figure 3-14.
Figure 3-14 MPLS Virtual Circuit Data Source Configuration Window
Step 3
If the list is still empty after clicking Import from Router, the NAM failed to automatically import VC configuration from the router. In this case, perform Step 4. If the VRF information is available, proceed to Step 5.
If the NAM failed to automatically import VC configuration from the router, click Import Log. The MPLS Import log contains information that might help you diagnose the problem in the connection. See Importing Log, for more information about the Import Log.
Step 4
After clicking Import from File, the Import VRF/VC Configuration window displays enabling you to specify the location from which to import the VRF/VC configuration file. The VRF/VC configuration file might be on your local machine or at a remote URL.
See Creating a VRF/VC Configuration File, for information about how to create the text VRF/VC configuration file.
Step 5
Creating or deleting a NAM data source does not affect the switch configuration.
Setting Up MPLS Label Data Sources
To set up MPLS Label data sources:
Step 1
The Active SPAN Sessions table displays.
Step 2
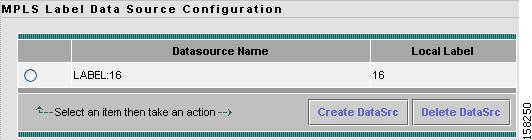
The MPLS Label Data Source Configuration window displays shown in Figure 3-15.
Figure 3-15 MPLS Label Data Source Configuration Window
Step 3
A dialog box asks you to select a VRF or VC first.
Step 4
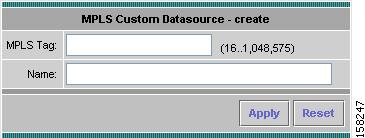
The Create MPLS Custom Datasource window displays as shown in Figure 3-16.
Figure 3-16 Create MPLS Custom Datasource Window
Step 5
The tag number must match the value in the packets, as only those will be represented in the data-source. You need to know the tag number from the router configuration. The NAM will assign a name based on the MPLS tag number you provide.
Step 6
You can use the name field to identify the MPLS tag value, the VRF tunnel name, or something else (such as VPN-San_Jose-RTP).
Step 7
Creating a VRF/VC Configuration File
The VRF/VC configuration file contains text information about the VRFs and VCs configured at the router. Each configuration line contains four fields separated by a space. Table 3-19 describes the format of a configuration line.
The following is an example of the VRF/VC configuration file:
# MPLS configuration file# Autogenerated at 2006-04-26 19:43VRF customer_A 114 0VRF customer_B 600 204/500,204/308VC 201 111 204/309VC 202 120 204/310VC 203 121 204/311VC 204 122 204/312VC 205 123 204/313VC 206 124 204/314VC 207 125 204/315VC 208 126 204/319VC 209 127 204/317VC 210 128 204/318Importing a VRF/VC Configuration File
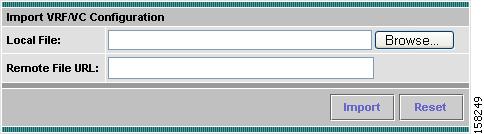
If you have a text file that contains the known VRF/VC configuration, you can import the configuration by clicking Import from File. You might have created this file by using the Export to File button. Figure 3-17 shows the Importing VRF/VC Configuration File window.
Click Browse to locate the configuration file you want to import, or enter the URL of a remote file, then click Import.
Figure 3-17 Importing VRF/VC Configuration File Window
Exporting a VRF/VC Configuration File
After you have the desired MPLS configuration on the NAM, you can export the configuration to a file to serve as a backup. Creating a backup file enables you reload the configuration if the configuration is lost or if you want to revert to an earlier configuration. Click Export to File to export your MPLS VRF/VC datasource configuration.
Importing Log
After you import the VRF/VC data source configuration from the router or VRF/VC datasource configuration file, you can view the log of the MPLS import by clicking Import Log. The MPLS Import log contains a listing of occurrences in the connection and can be useful in troubleshooting. The log might show an invalid user name or password, no connection to the switch, command-line parsing errors, or other problems that might have occurred. An MPLS import log should contain the message: VRF/VC update successful.
ERSPAN
This section describes how to configure Encapsulated Remote Switched Port Analyzer (ERSPAN) of the Catalyst 6500 switch or Cisco 7600 series router as a NAM data source. You configure ERSPAN as a NAM data source from the Catalyst 6500 switch or Cisco 7600 series router command line interface, not the NAM GUI.
There are two ways to configure ERSPAN so that the NAM receives the data:
•
•
Sending ERSPAN Data to Layer 3 Interface
To send the data to a layer 3 interface on the Switch housing the NAM, configure the ERSPAN source session. The ERSPAN destination session then sends the traffic to a NAM data-port. After performing this configuration, you can select the DATA PORT X data source to analyze the ERSPAN traffic.
Note
Sample Configuration of ERSPAN Source
monitor session 1 type erspan-sourceno shutsource interface Fa 3/47destinationerspan-id Nip address aa.bb.cc.ddorigin ip address ee.ff.gg.hhWhere:
•
•
•
Sample Configuration of ERSPAN Destination
monitor session 1 type erspan-destinationno shutdestination analysis-module 2 data-port 2sourceerspan-id Nip address aa.bb.cc.ddWhere:
•
•
You can now connect to the NAM to monitor and capture traffic of the Data Port 2 data source.
Sending ERSPAN Data Directly to the NAM Management Interface
To send the data directly to the NAM management IP address (management-port), configure the ERSPAN source session. No ERSPAN destination session configuration is required. After performing this configuration on the Catalyst 6500 switch or Cisco 7600 series router, the ERSPAN data source should appear on the NAM GUI and can then be selected to analyze the ERSPAN traffic.
Note
Sample Configuration
monitor session 1 type erspan-sourceno shutsource interface Fa3/47destinationerspan-id Yip address aa.bb.cc.ddorigin ip address ee.ff.gg.hhWhere:
•
•
•
•
Monitoring
Before you can monitor data, you must set up the data collections in the Monitor option of the Setup tab. For information on data collections, see the "Overview of Data Collection and Data Sources" section on page 4-2. There are options to set up the following:
•
•
•
•
Monitoring Core Data
You can enable or disable individual core data collections on each available data source. The following core collections are available:
•
•
•
•
•
•
•
•
•
•
•
Note
Note
Note
To set up core monitoring functions:
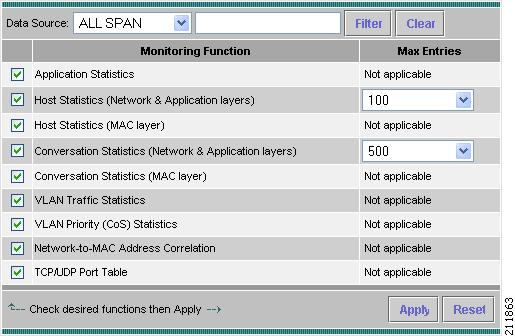
Step 1
The Core Monitoring Functions Dialog Box (Figure 3-18) displays.
Figure 3-18 Core Monitoring Functions Dialog Box
Step 2
To turn on core monitoring for the router, select Router from the Data Source drop-down menu. For routers, the following Data Sources are available:
•
•
•
•
To turn on core monitoring data for the switch or managed device, choose Supervisor from the drop-down menu. For switches and appliances, the following Data Sources are available:
•
•
•
•
•
You can enter a partial name of a data source and click Filter to find data sources that match. Click Clear to return to the entire list of data sources.
Step 3
•
•
•
•
•
•
•
•
•
Step 4
Step 5
Enabling Mini-RMON Collection
Note
Enabling Mini-RMON on the switch Supervisor allows you to monitor port statistics data from each switch port. You must enable Mini-RMON in privileged mode from the CLI. To enable Mini-RMON, do one of the following:
For Switches Running Catalyst OS
Enter the set snmp rmon enable command.
For Switches Running Cisco IOS Software
You must enable Mini-RMON on each individual interface.
Enter the following commands:
Supervisor name(config) # interface interface-nameSupervisor name(config-if) # rmon collection stats collection-control-index owner monitorSupervisor name(config-if) # endwhere:
•
•
been used.Monitoring Voice Data
After you setup the NAM to monitor voice data, use the Monitor tab to view the collected voice data. For more information on viewing the voice data, see Viewing Voice and Video Data, page 4-23.
Note
To set up voice monitoring:
Step 1
The Core Monitoring Functions table displays.
Step 2
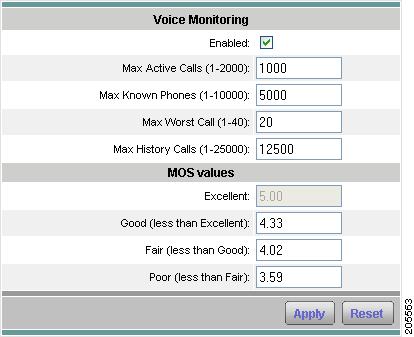
The Voice Monitor Setup Window(Table 3-20) displays. Figure 3-19 shows an example of the Voice Monitoring Setup Window.
Figure 3-19 Voice Monitoring Setup Window
Step 3
Step 4
Table 3-21, Maximum and Default Voice/Video and RTP Stream Parameters per Platform, provides the maximum numbers allowed for various voice, video, and RTP streams depending on the NAM platform. The default values for each parameter are in parenthesis.
Note
http://www.cisco.com/en/US/products/sw/voicesw/ps556/tsd_products_support_series_home.htmlStep 5
Monitoring RTP Stream Traffic
The NAM enables you to identify and monitor all RTP stream traffic among all SPANed traffic without having to know the signalling traffic used in negotiating the RTP channels. When RTP Stream Monitoring is enabled, the NAM:
•
•
•
By default, the NAM can monitor up to 30 concurrent RTP streams, but you can set up the NAM to monitor from 1 to 4,000 streams. See Setting Up Voice/Video Stream Thresholds for more information about how to set up NAM RTP Stream packet loss thresholds for the following:
•
The valid threshold value is 1 to 10 inclusive. Each RTP packet has an RTP header that contains a sequence number. The sequence number increments by one for each RTP packet received in the same RTP stream. A gap in the sequence numbers identifies a packet loss. If the gap in sequence numbers jump is more than the threshold, the NAM raises an alarm condition.
•
This value is accumulative per-million packet loss rate from 1 to 100 inclusive. Every time NAM detects a packet loss (sequence gap) event, the NAM calculates the per-million packet loss rate. If the computed per-million packet loss rate crosses this threshold, the NAM raises an alarm condition.
You can set up these thresholds at Setup > Alarms > NAM RTP Stream Thresholds.
You can define filter entries to narrow down to the subset of RTP streams so the NAM monitors only those RTP streams matching the filter criteria. For example, a filter to set up the NAM to monitor RTP streams from the subnet 209.165.201.0 to host 1.1.1.1 would be:
source = 209.165.201.0source mask = 255.255.255.0destination = 1.1.1.1destination mask = 255.255.255.255To set up RTP Stream monitoring:
Step 1
The Core Monitoring Functions table displays.
Step 2
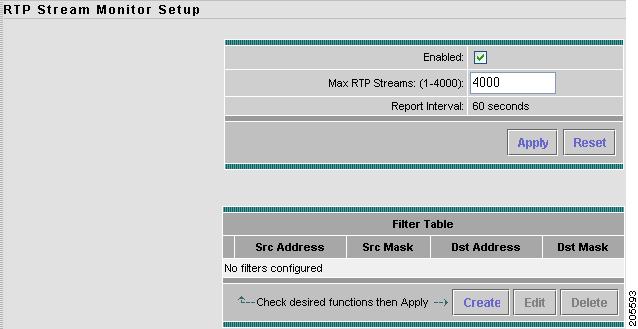
The RTP Stream Setup window displays with two distinct areas. Figure 3-20 shows an example of the RTP Stream Monitoring Setup window.
Figure 3-20 RTP Stream Monitoring Setup Window
Step 3
Step 4
Step 5
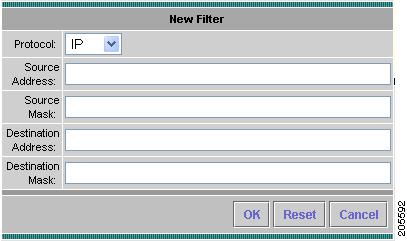
The New Filter window (Figure 3-21) appears with fields for you to enter both the source and destination IP address and address mask for the RTP streams to monitor.
Figure 3-21 Setup RTP Stream Monitoring New Filter Window
Step 6
Step 7
Click Reset to clear all fields of the New Filter dialog box.
Step 8
Click Reset to clear the values you might have modified to their previous set values.
Monitoring Response Time Data
You can monitor response time to collect the response time between a client and a server. You can enable or disable response time monitoring on individual collection data sources. When you enable response time monitoring, the application supplies the default collection parameters.
The response time monitoring option is on by default; however to monitor response time data, you must enable response time monitoring in the NAM Traffic Analyzer application.
These topics help you set up and manage response time monitoring:
•
•
•
•
•
Setting Up Response Time Configuration
To configure the timing parameters (or buckets) for response time data collections:
Step 1
The Core Monitoring Functions table displays.
Step 2
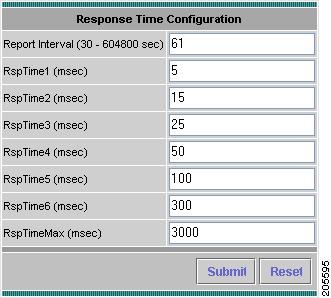
The Response Time Monitoring Setup, Collection Configuration window displays. See Figure 3-22, Response Time Configuration Window. The settings you make on this window comprise the time distribution in milliseconds for the detailed Server Application Response Time data collection.
Table 3-22 lists the time settings for the Response Time Configuration window.
Note
Figure 3-22 Response Time Configuration Window
Step 3
Setting Up Response Time Data Monitoring
To configure response time monitoring:
Step 1
The Core Monitoring Functions table displays.
Step 2
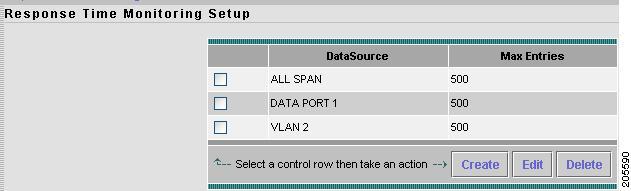
The Response Time Monitoring Setup table displays any data sources you might have already set up for response time monitoring as shown in Figure 3-23, Response Time Monitoring Setup.
Figure 3-23 Response Time Monitoring Setup
Click Create to add another data source for which you want to monitor response time data. Check a data source and click Edit to modify the data source. Check a data source and click Delete to remove the data source.
Creating a Response Time Monitoring Collection
To create a response time monitoring collection:
Step 1
The Core Monitoring Functions table displays.
Step 2
The Response Time Monitoring Setup table displays any data sources you might have already set up for response time monitoring as shown in Figure 3-23, Response Time Monitoring Setup.
Step 3
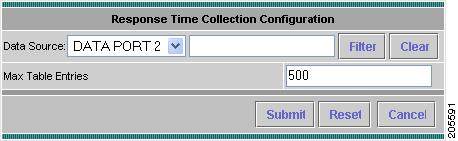
The Response Time Monitoring Setup, Collection Configuration window displays as shown in Figure 3-24.
Figure 3-24 Response Time Monitoring Setup, Collection Configuration
Step 4
NAM 4.0 will build a table of response time data based on the number of entries you specify in Max. Table Entries and the timings you configured in Setting Up Response Time Configuration.
Step 5
The new data source is listed as a Data Source when the Response Time Monitoring Setup window displays.
Editing a Response Time Monitoring Collection
To edit a response time monitoring collection:
Step 1
The Core Monitoring Functions table displays.
Step 2
The Response Time Monitoring Setup table displays any data sources you might have already set up for response time monitoring as shown in Figure 3-23, Response Time Monitoring Setup.
Step 3
The Response Time Monitoring Setup, Collection Configuration window displays as shown in Figure 3-24.
Step 4
The modified data source displays as a Data Source when the Response Time Monitoring Setup window displays.
Deleting Response Time Data Collections
To delete one or more response time data collections:
Step 1
The Core Monitoring Functions table displays.
Step 2
The Response Time Monitoring Setup table displays any data sources you might have already set up for response time monitoring.
Step 3
Monitoring DiffServ Data
Differentiated services monitoring (DSMON or DiffServ) is designed to monitor the network traffic usage of differentiated services code point (DSCP) values.
To monitor DiffServ data, you must configure at least one aggregation profile and one or more aggregation groups associated with each profile. For more information on configuring an aggregation profile, see the "Creating a DiffServ Profile" section.
To set up monitoring of differentiated services:
Step 1
The Core Monitoring Functions table displays.
Step 2
The DiffServ Monitor Setup Dialog Box (Table 3-23) displays.
You can enter a partial name of a data source and click Filter to find data sources that match. Click Clear to return to the entire list of data sources.
Step 3
Step 4
Setting Up the DiffServ Profile
A DiffServ profile is a set of aggregation groups that can be monitored as a whole. After you create the proper profile(s), you can enable DiffServ collection. For more information on setting up DiffServ collections, see the "Monitoring DiffServ Data" section.
These topics help you set up and manage the DiffServ profile:
Creating a DiffServ Profile
To create a DiffServ profile:
Step 1
The Core Monitoring Functions table displays.
Step 2
The DiffServ Monitor Profile Dialog Box displays.
Step 3
The DiffServ Profile Setup Dialog Box (Table 3-24) displays.
Step 4
Step 5
Editing a DiffServ Profile
To edit a DiffServ profile:
Step 1
The Core Monitoring Functions table displays.
Step 2
The DiffServ Monitor Profile Table displays.
Step 3
The DiffServ Profile Setup Dialog Box (Table 3-24) displays.
Step 4
Deleting a DiffServ Profile
To delete one or more DiffServ profiles, simply select the profiles from the DiffServ Monitor Profile table, then click Delete.
Monitoring URL Collection Data
The URL collection listens to HTTP traffic (TCP port 80) on a selected datasource and collects URLs. Only one collection on a single datasource can be enabled at a time.
A URL, for example: http://host.domain.com/intro?id=123, consists of a host part (host.domain.com), a path part (intro), and an arguments part (?id=123).
The collection can be configured to collect all parts or it can configured to collect only some of the parts and ignore others.
This section contains the following sections:
Enabling a URL Collection
To enable a URL collection:
Step 1
The Core Monitoring Functions table displays.
Step 2
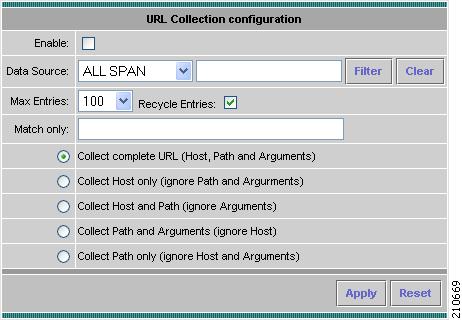
The URL Collection Configuration Dialog Box (Figure 3-25) displays.
Figure 3-25 URL Collection Configuration Dialog Box
Step 3
Step 4
You can enter a partial name of a data source and click Filter to find data sources that match. Click Clear to return to the entire list of data sources.
Note
:
Step 5
Step 6
•
•
•
•
•
Step 7
Changing a URL Collection
To change a URL collection:
Step 1
Step 2
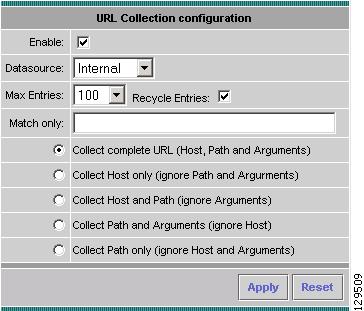
The URL Collection Configuration Dialog Box (Figure 3-26) displays.
Figure 3-26 URL Collection Configuration Dialog Box
Step 3
Note
Step 4
Disabling a URL Collection
To disable a URL collection:
Step 1
Step 2
Step 3
Step 4
Protocol Directory
The NAM contains a default set of protocols to be monitored. You can edit and delete protocols from the RMON2 protocol directory table on the NAM.
These topics enable you to manage the protocol directory:
•
•
•
Individual Applications
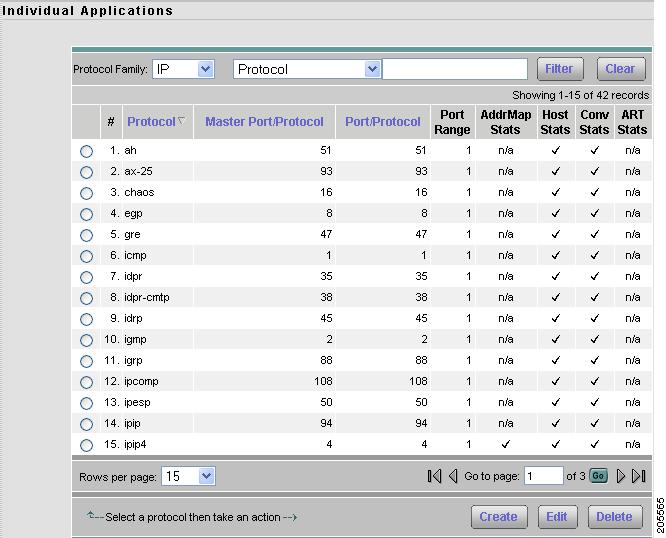
The Individual Applications window (Figure 3-27) lists protocols that have been set up for this NAM. To view the Individual Applications window, click Setup > Protocol Directory > Individual Applications. Use this window to view, add proprietary protocols, and to edit the settings for well-known protocols.
Figure 3-27 Protocol Directory Table
This section provides the following sections:
Creating a New Protocol
You can create additional protocol ports to enable the NAM to handle additional protocol traffic for standard protocols.
To create a new protocol:
Step 1
The Protocol Directory Table (Figure 3-27) displays.
Step 2
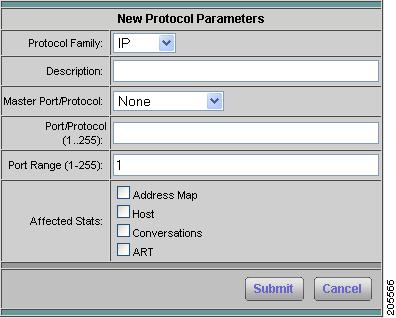
The New Protocol Parameters window (Figure 3-28) displays.
Figure 3-28 New Protocol Parameters Window
Table 3-26 describes the fields of the New Protocol Parameters Dialog.
Step 3
Choose the protocol for the type of traffic you want to create the additional protocol to handle.
Step 4
Step 5
If you select a Master Port/Protocol, this extends the master protocol to cover the port/protocol you assign as well. Traffic on the port/protocol you create is treated as though it were traffic on the Master Port/Protocol. In this case, you cannot edit the Description or Affected Stats.
If you do not choose a Master Port/Protocol (None), the protocol you create is an independent protocol. You must still provide values for the Description and Affected Stats.
Step 6
The range is 1-255 for IP and 1-65535 for TCP, UDP, and SCTP.
Step 7
If you assign the new protocol to port 239, for example, and enter a range of four (4), the protocol you create will use ports 239, 240, 241, and 242 to handle traffic for the new protocol.
Step 8
Step 9
Tip
Editing a Protocol
We recommend that you do not change any settings in the NAM protocol directory. Changing the default settings might cause unexpected behavior in SNMP-based management applications such as NetScout nGenius Real-Time Monitor. However, advanced users might want to monitor proprietary protocols or alter the normal settings for well-known protocols.
To edit a protocol:
Step 1
The Protocol Directory table displays.
Step 2
The Edit Protocol Dialog Box(Table 3-27) displays.
Step 3
Step 4
•
•
•
Tip
•
Deleting a Protocol
To delete a protocol, simply select it from the Protocol Directory table, then click Delete.
Tip
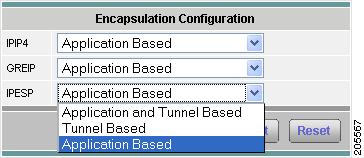
Setting Up Encapsulation
Using Encapsulation Configuration gives you increased flexibility when trying to monitor (such as counting or grouping) different types of application traffic. Encapsulation Configuration enables you to configure how you want the NAM to handle IP tunnel encapsulations.
You can use the NAM to set up the way you monitor different types of encapsulation in network traffic for the following protocols:
•
•
•
When set to IGNORE, the default mode, the NAM uses application-based counting. The encapsulation type is ignored, and the NAM counts all application traffic but ignores tunneled traffic. When you turn on Encapsulation Configuration for one or more protocols, you enable the NAM to count separately for tunnel-based counting in addition to application-based counting. When you turn off Encapsulation Configuration for one or more protocols, the NAM uses tunnel-based counting, and all traffic over the specified protocol is counted as the tunnel protocol. Figure 3-29 shows the Encapsulation Configuration dialog box.
To configure encapsulation:
Step 1
The Protocol Directory table appears.
Step 2
The Individual Applications Encapsulation Configuration window displays.
Figure 3-29 Encapsulation Configuration
Step 3
Step 4
Click Reset to revert to the previous settings since the last Submit.
Setting Up Application Groups
An application group is a set of application protocols that can be monitored as a whole. The following topics help you set up and manage the application group:
•
•
Creating an Application Group
To create an application group:
Step 1
The Protocol Directory table displays.
Step 2
Step 3
The New Application Group Dialog Box (Table 3-28) displays.
Step 4
Step 5
Step 6
Editing an Application Group
To edit an application group:
Step 1
The Individual Applications window displays.
Step 2
The Application Groups window displays.
Step 3
The Application Groups Edit window displays.
Step 4
Deleting an Application Group
To delete one or more application groups, simply select the profiles from the Application Groups table, then click Delete.
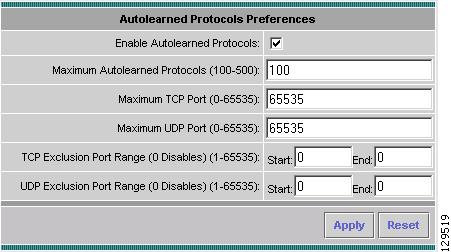
Setting Up Autolearned Protocols
The Autolearned Protocols Preferences window allows you to configure the NAM to automatically learn application information. You can set the following preferences:
•
•
•
•
•
To set up Autolearned Protocol preferences:
Step 1
Step 2
The Autolearned Protocols Preferences Dialog Box (Figure 3-30) displays.
Figure 3-30 Autolearned Protocols Preferences Dialog Box
Step 3
Step 4
Setting Up URL-Based Applications
URL-based applications are extensions to the protocol directory. When the URL in an HTTP request (a URL on TCP port 80) matches the criteria of a URL-based application, the traffic is classified as that protocol.
A URL-based application can be used the same way as any other protocol in the protocol directory. For example, a URL-based application can be used in collections, captures, and reports.
An incoming URL is matched against the criteria of the configured URL-based application, in the order of the index, until a match is found. When a match is found, the remaining URL-based applications are not considered.
This section contains the following sections:
•
•
•
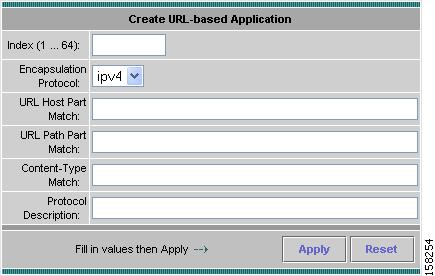
Creating a URL-Based Application
A URL consists of the following parts:
•
•
•
For example, in the URL http://host.domain.com/intro?id=123:
•
•
•
In the configuration of an URL-based application, the path part and the argument path are combined and called the path part.
Note
Note
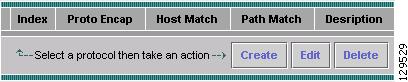
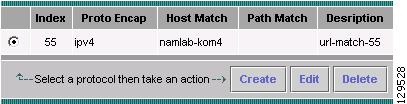
To set up URL-based applications:
Step 1
Step 2
The URL Matches Dialog Box (Figure 3-31) displays.
Figure 3-31 URL Matches Dialog Box
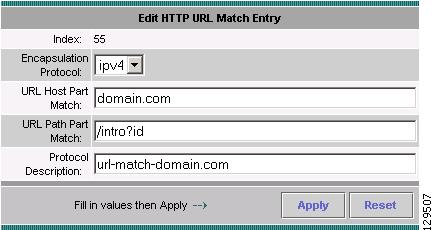
Step 3
The Create URL Match Entry Dialog Box (Figure 3-32) displays.
Figure 3-32 Create URL Match Entry Dialog Box
Step 4
RFC 2895 specifies rules for creating a protocol name. In accordance with these rules, only the following characters are allowed:
•
•
•
•
•
•
•
Note
Step 5
Editing a URL-Based Application
To edit URL-based applications:
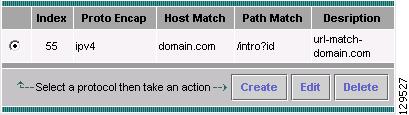
Step 1
Step 2
The URL Matches Dialog Box (Figure 3-33) displays.
Figure 3-33 URL Matches Dialog Box
Step 3
The Edit URL Match Entry Dialog Box (Figure 3-34) displays.
Note
Figure 3-34 Edit URL Match Entry Dialog Box
Change the information as described in the URL Match Entry Dialog Box (Table 3-30).
Step 4
Deleting a URL-based Application
To delete a URL-based application:
Step 1
Step 2
The URL Matches Dialog Box (Figure 3-35) displays.
Figure 3-35 URL Matches Dialog Box
Step 3
Setting Up Alarm Events and Thresholds
You can set up alarm thresholds by defining threshold conditions for the following monitored variables on the NAM:
•
•
•
•
•
•
•
•
•
•
Note
These topics help you set up and manage alarm threshold settings:
•
•
•
Setting Up Alarm Events
Use this window to set up the alarm events, then use these events to set up the alarms you want to use. These events are also used for the Capture Trigger events. After creating events, go to the Setup >
Alarm Events to see a list of the events you created. There you select which event you wish to be associated with that alarm. See Setting Alarm Thresholds.You do not need to set up logs and traps before you set up Alarm Event. Logs and traps are part of the event parameters and specify what the NAM should do after an alarm is triggered.
To create an alarm event:
Step 1
The Alarm Events table displays any configured Alarm Events.
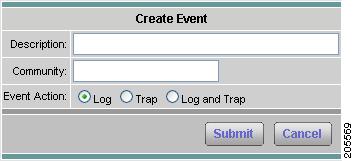
Step 2
The Create Alarm Events Dialog displays, as shown in Figure 3-36.
Figure 3-36 Create Alarm Events Dialog
Step 3
Enter up to 128 characters that describe this Alarm Event. This description displays on automatic captures you might configure.
Step 4
Step 5
Choose Log to log the event and display it in the Alarms tab. Choose Trap to send the event to traps processing. Choose Log and Trap to log the event and send it to trap processing.
Step 6
The Alarm Events table displays the newly configured Alarm Event in its list.
Editing Alarm Events
To edit an alarm event:
Step 1
The Alarm Events table displays any configured Alarm Events.
Step 2
Deleting Alarm Events
To delete an alarm event:
Step 1
The Alarm Events table displays any configured Alarm Events.
Step 2
Setting Alarm Thresholds
You use the NAM GUI to set up alarm thresholds for MIB variables with values that trigger alarms. To view currently set alarm thresholds:
Step 1
The Alarm Events table displays any configured Alarm Events.
Step 2
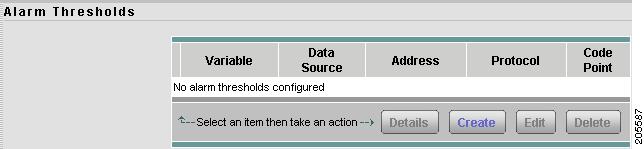
The Alarm Thresholds table displays any currently setup alarm thresholds. Figure 3-37 shows an example of the Alarm Thresholds table.
Figure 3-37 Alarm Thresholds
Step 3
Alarm Thresholds - Selecting a Variable
After you click Create on the Alarm Thresholds window, you must set up alarm threshold variable properties. To set up an alarm threshold variable:
Step 1
The Alarm Events table displays any configured Alarm Events.
Step 2
The Alarm Thresholds table displays any currently setup alarm thresholds. Figure 3-37 shows an example of the Alarm Thresholds table.
Step 3
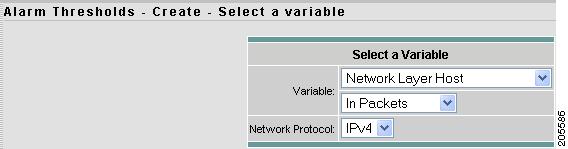
The Alarm Thresholds - Create - Select a Variable window displays. Figure 3-38 shows an example of the Alarm Thresholds - Create - Select a Variable window.
Figure 3-38 Alarm Thresholds - Create - Select a Variable
Step 4
You can choose from among the following:
•
•
•
•
•
•
•
•
•
•
Step 5
You can choose from among the following:
•
•
•
•
Step 6
Step 7
Alarm Thresholds - Selecting Parameters
After you click Next in the Alarm Thresholds - Create - Select a Variable window, you must set up the parameters for the alarm threshold variable.
To set up an alarm threshold variable parameters:
Step 1
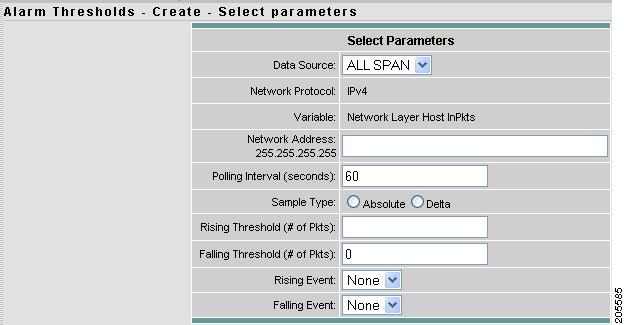
Figure 3-37 shows an example of the Alarm Thresholds table. The Alarm Thresholds - Create - Select Parameters window displays. Figure 3-39 shows an example of the Alarm Thresholds - Create - Select Parameters window.
Figure 3-39 Alarm Thresholds - Create - Select Parameters
Table 3-31 lists and describes the parameters for Alarm Thresholds - Create - Select Parameters window.
Step 2
Step 3
Viewing Alarm Details from the NAM MIB Thresholds Table
To view details of a specific alarm from the NAM MIB Thresholds table, select the radio button, then click Details. The Alarms Details Table(Table 3-32) displays.
Table 3-32 Alarm Details Table
Variable
Monitored variable.
Data Source
Data source being monitored.
Address
Destination and source address of the hose.
Interval (seconds)
Interval of the sampling period.
Sample Type
Sample type of the alarm—absolute or delta.
Rising Threshold
The number of rising packets or octets that triggers the alarm.
Falling Threshold
The number of falling packets or octets that triggers the alarm.
Alarm Action
Action to be taken when the alarm is triggered.
Community
SNMP community where traps are sent.
Trigger Set
None, Start or Stop. Start indicates a capture process would start when this alarm is triggered. Stop means a capture process would stop when this alarm is triggered. None means no capture trigger is set for this alarm.
See Using Alarm-Triggered Captures for information about how to use the alarm-triggered capture feature.
Editing an Alarm Threshold
To edit an alarm threshold:
Step 1
The Thresholds table displays.
Step 2
The Edit Event dialog box displays.
Step 3
Step 4
Deleting a NAM MIB Threshold
To delete a NAM MIB threshold, simply select it from the Alarms table, then click Delete.
Step 5
Setting Up Voice/Video Stream Thresholds
You can set up the NAM to monitor voice and video streams to display packet loss statistics based on the RTP sequence number. When you set up the RTP stream thresholds and enable alarms, an EMail alarm message is sent to those configured under Admin > System > EMail Configuration. See E-Mail Configuration, page 2-15 for information about how to configure EMail.
Step 1
The Alarm Events table displays.
Step 2
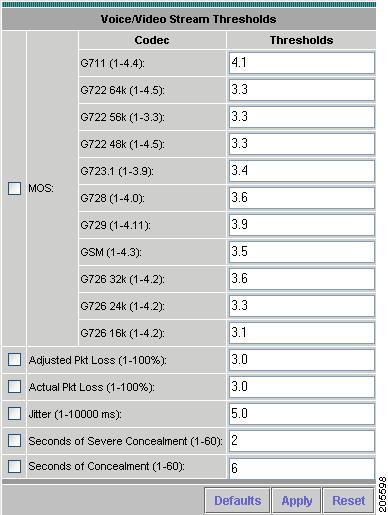
The Voice/Video Stream Thresholds window displays as shown in Figure 3-40.
Note
Figure 3-40 Setup Voice/Video Stream Thresholds Window
Table 3-33 describes the fields of the Voice/Video Stream Thresholds window.
Step 3
Step 4
Setting Up the NAM Syslog
NAM syslogs are created for alarm threshold events, voice threshold events, or system alerts. The NAM maintains two syslog files, one for logging RMON threshold events (for MIB and voice threshold events) and one for logging local NAM system alerts.
You can specify whether syslog messages should be logged locally on the NAM, on a remote host, or both. You can use the NAM Traffic Analyzer to view the local NAM syslogs.
For information on viewing the syslog, see Chapter 7, "Viewing Alarms." You can use a standard text editor to view syslog on remote hosts.
To set up the NAM syslog:
Step 1
The Alarm Events table displays.
Step 2
The NAM Alarms Syslog Dialog Box (Table 3-34) displays.
Step 3
Step 4
Setting Chassis or Managed Device Thresholds
Note
You can configure RMON thresholds in the switch Mini-RMON MIB. You can specify only variables from the etherStatsTable in the Mini-RMON MIB to monitor for threshold-crossing conditions.
These topics help you set up and manage switch thresholds:
•
•
•
Creating Chassis or Managed Device Thresholds
To create chassis or managed device thresholds:
Step 1
The Thresholds table displays.
Step 2
The Chassis Threshold table displays.
Step 3
The New Chassis Thresholds (Table 3-35) displays.
Step 4
Note
Editing Chassis or Managed Device Thresholds
Note
To edit chassis thresholds or managed device thresholds:
Step 1
The Thresholds table displays.
Step 2
The Switch Threshold Alarms dialog box displays.
Step 3
The Edit Alarm dialog box displays.
Step 4
Deleting Chassis or Managed Device Thresholds
Note
To delete an existing chassis threshold or managed device threshold, select it from the Chassis Threshold Alarms table, then click Delete.
Setting NAM Trap Destinations
Traps are used to store alarms triggered by threshold crossing events. When an alarm is triggered, you can trap the event and send it to a separate host.
These topics help you set up and manage NAM traps:
•
•
•
Creating a NAM Trap Destination
To create a NAM trap destination:
Step 1
The NAM MIB Thresholds table displays.
Step 2
The Traps dialog box displays.
Step 3
The Create Trap Dialog Box (Table 3-36) displays.
Step 4
Step 5
Editing a NAM Trap Destination
To edit a NAM trap destination:
Step 1
The Thresholds table displays
Step 2
The Traps dialog box displays.
Step 3
The Edit Trap dialog box displays.
Step 4
Step 5
Deleting a NAM Trap Destination
To delete an existing trap, simply select it from the Traps table, then click Delete.
Setting NAM Alarm Mail
Note
You can configure the NAM to send Email to one or more addresses in the case of a NAM alarm. To configure Email alarms:
Step 1
Step 2
The Alarm Mail Configuration dialog box displays.
Step 3
Use an Email address such as jdoe@cisco.com. Use a space to separate multiple Email addresses.
Setting Global Preferences
Global preferences settings apply to all users of the NAM and determine how data displays are formatted. To set up global preferences.
Step 1
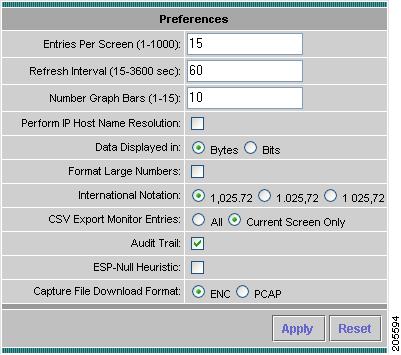
The Preferences Dialog Box (Figure 3-41) displays.
Figure 3-41 Preferences Dialog Box
Step 2
Table 3-37 Preferences Dialog Box
Entries Per Screen
The number of rows to display in tabular screens.
Enter a number from 1 to 100. The default is 15.
Refresh Interval
The number of seconds between monitor display refreshes.
Enter a number from 15 to 3600. The default is 60.
Number Graph Bars
The number of graph bars to display in TopN displays and charts.
Enter a number from 1 to 15. The default is 10.
Perform IP Host Name Resolution
Display DNS names, if available.
Select to enable or deselect to disable. Enabled by default.
Note
Data Displayed in
Option to display data in bits or bytes.
Select Bytes or Bits. Default is bytes.
Format Large Numbers
Display large integer values in appropriate units with prefixes such as Kilo (K), Mega (M), Giga (G) and Tera (T.)
Check box to format large numbers. If this box is unchecked, large numbers are not formatted. The default is unchecked.
International Notation
You have the option to print numbers in the following format:
1,025.72
1.025,72
1 025,72
Default is 1,025.72
CSV Export Monitor Entries
Provides the option to CSVexport all entries in a particular monitor table or just the current entries displayed on a particular window.
Default is Current Window Only.
Audit Trail
Check box to enable or disable the audit trail.
Enables the recording of critical user activities to an internal log file. By default, the audit trail is enabled.
See also:
•
•
ESP-Null Heuristic
Enables NAM to detect ESP-null encryption and parse content as described in Internet RFC 2410.
Enabling ESP-Null Heuristic forces the NAM to check all packets with an ESP header to see if it could be using Null encryption. The ESP-Null Heuristic feature adds processing overhead, so it is disabled by default.
Capture File Download Format
Check ENC or PCAP.
<to be supplied>
Step 3