Downloads |
 Feedback Feedback
|
Table Of Contents
Overview of the NAM Traffic Analyzer
Introducing the NAM Traffic Analyzer
Using the NAM Graphical User Interface
A Closer Look at Some User Interface Components
Common Navigation and Control Elements
Overview of the NAM Traffic Analyzer
These topics provide information about using the various components of the NAM Traffic Analyzer:
•
Introducing the NAM Traffic Analyzer
•
•
Introducing the NAM Traffic Analyzer
The Cisco Network Analysis Module (NAM) is an integrated module that enables network managers to understand, manage, and improve how applications and services are delivered to end-users. The NAM offers flow-based traffic analysis of applications, hosts, and conversations, performance-based measurements on application, server, and network latency, quality of experience metrics for network-based services such as voice over IP (VoIP) and video, and problem analysis using deep, insightful packet captures. The Cisco NAM includes an embedded, web-based Traffic Analyzer GUI that provides quick access to the configuration menus and presents easy-to-read performance reports on Web, voice, and video traffic.
Using the NAM Graphical User Interface
The Cisco NAM Traffic Analyzer supports browser-based access to the NAM graphical user interface (GUI). To access the NAM GUI, enter a machine name and its domain or an IP address in your browser address field. The NAM GUI prompts you for your user name and password. After you enter your user name and password, click Login to access the NAM GUI.
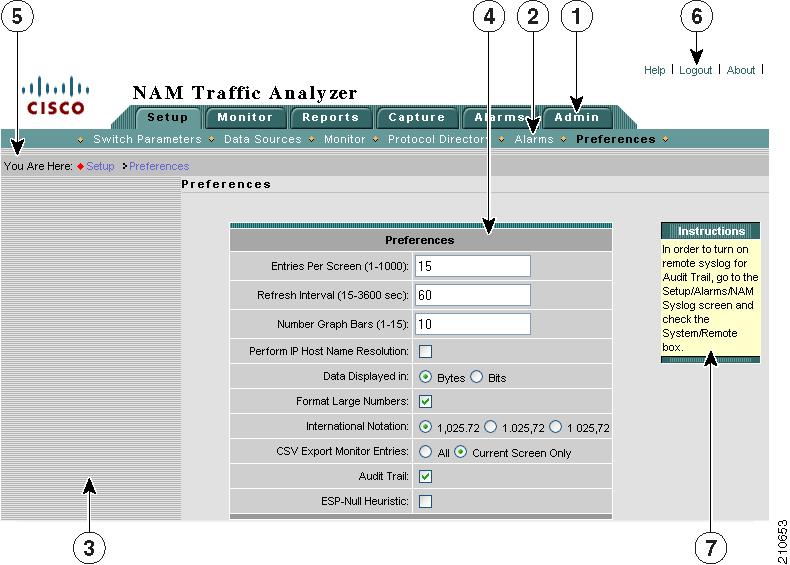
Figure 1-1 shows an example of the NAM Traffic Analyzer GUI.
Figure 1-1 NAM Traffic Analyzer GUI
Note
A Closer Look at Some User Interface Components
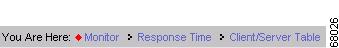
Context Line
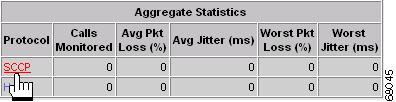
The Context line shows where you are in the hierarchy of operations. In this case, you would be viewing the Response Time Client/Server Table.
You can click:
•
•
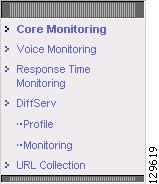
Contents
The contents (present in only some windows) displays options that are subordinate to the options within the individual tabs. The example above displays after you click Setup > Monitor.
Toolbar
The toolbar is displayed in the upper right corner of every window of the user interface.
•
•
•
Common Navigation and Control Elements
Common Navigation and Control Elements (Table 1-1) describes the common navigation and control elements in the user interface.
In addition to the common navigation and control elements, you can use these navigation aids:
Getting Started
To use the NAM Traffic Analyzer effectively, you must perform a specific sequence of tasks:
Step 1
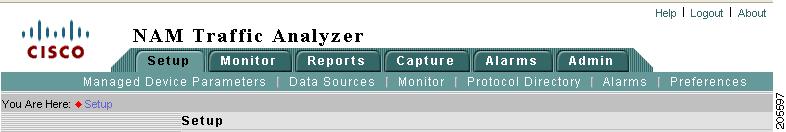
Figure 1-2 Setup Tab
These options are available from the Setup tab.
•
•
Note
•
Note
•
•
•
•
•
Step 2
For more information, see Chapter 2, "User and System Administration."
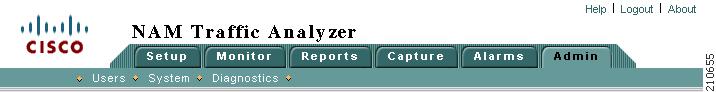
Figure 1-3 Admin Tab
These options are available from the Admin tab.
•
•
•
Step 3
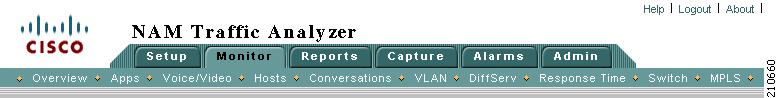
Monitor Tab
The Monitor tab provides tools for configuring specific monitoring collections on the NAM except for capture buffers and alarms. Examples include conversation collections, protocol collections, and voice collections. For more information, see Chapter 4, "Monitoring Data."
Figure 1-4 Monitor Tab
These options are available from the Monitor tab.
•
•
•
•
•
•
Note
•
•
•
•
Note
•
Note
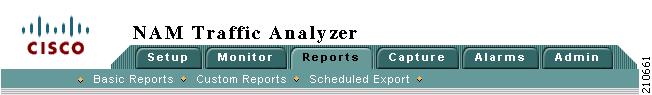
Reports Tab
Use the Reports function (Figure 1-5) to store and retrieve short- and medium-term historical data about the network traffic monitored by the NAM. For more information, see Chapter 5, "Creating and Viewing Reports."
Figure 1-5 Reports Tab
These options are available from the Reports tab:
•
•
•
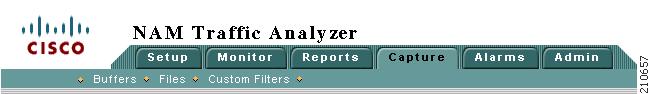
Capture Tab
The Capture tab (Figure 1-6) provides windows to set up and display capture buffer data. For more information, see Chapter 6, "Capturing and Decoding Packet Data."
Figure 1-6 Capture Tab
These options are available from the Capture tab:
•
•
•
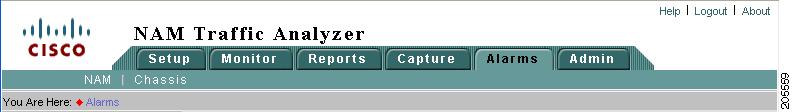
Alarms Tab
The Alarms tab (Figure 1-7) provides mechanisms for displaying alarms generated from thresholds established in the Setup tab. For more information, see Chapter 7, "Viewing Alarms."
Figure 1-7 Alarms Tab
These options are available from the Alarms tab:
•
•
Note