-
Cisco IOS Tcl IVR and VoiceXML Application Guide - 12.3(14)T and later
-
Title
-
Cisco IOS Tcl IVR and VoiceXML Feature Roadmap
-
Tcl IVR and VoiceXML Applications Overview
-
Configuring Basic Functionality for Tcl and VoiceXML Applications
-
Configuring Audio File Properties for Tcl and VoiceXML Applications
-
Configuring VoiceXML Voice Store and Forward
-
Configuring ASR and TTS Properties
-
Configuring Fax Detection for VoiceXML
-
Configuring Media Inactive Call Detection
-
Configuring Tcl IVR 2.0 Session Interaction
-
Configuring Telephony Call-Redirect Features
-
Configuring SIP and TEL URL Support
-
Monitoring and Troubleshooting Voice Applications
-
MGCP Scripting for VoiceXML
-
Index
-
 Feedback
Table Of Contents
Monitoring and Troubleshooting Voice Applications
Prerequisites for Voice Application Monitoring and Troubleshooting
Restrictions for Voice Application Monitoring and Troubleshooting
Information About Voice Application Monitoring and Troubleshooting Enhancements
Description of Voice Application Monitoring and Troubleshooting Features
Counters and Gauges for Voice Application Statistics
Monitoring Levels for Voice Applications
Application Instance Statistics
Application Interface Statistics
Benefits of Voice Application Monitoring and Troubleshooting Enhancements
Guidelines for Enabling Statistics and Event Logging for Voice Applications
Throttling Mechanism for Event Logging
Memory Requirements for Writing Event Logs to FTP
How to Configure Monitoring for Voice Applications
Enabling Event Logging and Statistics Globally for Voice Applications
Enabling Event Logging for a Specific Voice Application or Interface
Monitoring Voice Applications for Active Calls
Monitoring Voice Applications for Terminated Calls
Examples for Monitoring Voice Applications
Clearing Event Logs and Statistics for Application Instances and Interfaces
Displaying Event Logs for Applications or Call Legs in Real-Time
Modifying Event Log Settings for Application Instances
Modifying Event Log Settings for Application Interfaces
Modifying Event Log Settings for Call Legs
Modifying Event Log History Limits
Configuration Examples for Monitoring Voice Applications
Enabling Event Logs and Statistics Globally: Example
Customizing Event Logs and Statistics Example
Monitoring and Troubleshooting Voice Applications
Event logs and statistics introduced in the Voice Application Monitoring and Troubleshooting Enhancements feature enable detailed monitoring of voice application instances and call legs. Records for terminated application instances and call legs are saved in history to assist in fault isolation. This comprehensive management information helps you diagnose problems in the network and identify the causes.
Tip
To immediately begin using this feature, proceed to the "Enabling Event Logging and Statistics Globally for Voice Applications" section.
For more information about this and related Cisco IOS voice features, see the following:
•
•
Note
Feature History for Voice Application Monitoring and Troubleshooting Enhancements
Contents
•
•
•
•
Prerequisites for Voice Application Monitoring and Troubleshooting
•
•
Restrictions for Voice Application Monitoring and Troubleshooting
•
•
•
Information About Voice Application Monitoring and Troubleshooting Enhancements
To monitor and troubleshoot voice applications on the Cisco voice gateway, you should understand the following concepts:
•
•
•
•
•
Description of Voice Application Monitoring and Troubleshooting Features
Voice calls are setup, maintained, and terminated by different subsystems within Cisco IOS software. Before Cisco IOS Release 12.3(x)T, managing calls from a voice application perspective could be challenging when diagnosing call progress, delays, exceptions, and failures during post call-analysis. Although debug commands are available for the individual subsystems, the volume of output and the expertise required to understand all the subsystems make it difficult to use debug commands for identifying the cause of a failure or gathering specific details about a call.
This feature enables detailed monitoring of call applications by providing command-based event logging and statistics collection for voice application instances, application interfaces, and call legs on the Cisco voice gateway. The event logs and statistics provide a high-level view of application transactions in simple, nontechnical language. Event logs include subscriber dialog interactions and back-end server transactions. This event logging is separate from the generic message logging available with the logging buffered command. You can enable monitoring globally for all voice applications and application interfaces, or for individual applications, interfaces, or servers. These comprehensive management features help you diagnose performance problems and isolate faults in a production-level network.
After an application instance terminates, the event log and statistics information is moved from the active table to the history table in the application information system (AIS) database. You can view the event logs and statistics by using show commands on the voice gateway or by using SNMP to access the MIB call application tables. You can set the size of the event log buffer to meet your needs and the memory resources of your voice gateway. You can also configure the voice gateway to write the event logs to an external FTP server. The gateway saves the event logs to the selected server when the event log buffer becomes full or when the application instance or call leg terminates.
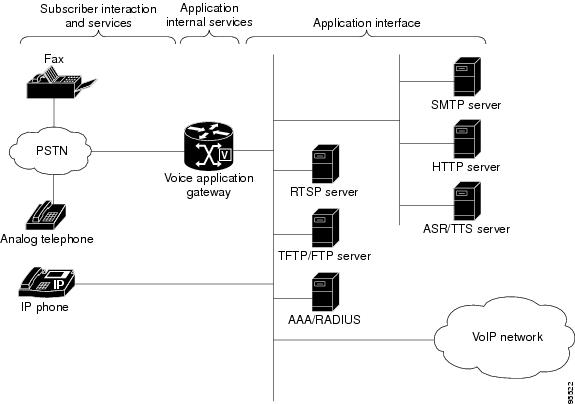
Figure 12-1 shows the major subsystem components involved in voice application calls.
Figure 12-1 Voice Application Network Components
The voice application monitoring features provide:
•
•
•
•
•
•
Counters and Gauges for Voice Application Statistics
Statistics for voice applications and call legs are presented as counters and gauges. These measurements are based on event counts or rates. They measure the total count of a specific event, or the derived rate of change of events during a period of time. Counters track totals, such as the number of errors, and do not reset to zero unless cleared. Gauges reflect real-time information for active calls, such as the number of currently connected calls. Gauges fluctuate over time and can return to zero. For example, a call is included in an active call gauge while it is active. When the call terminates, the active call gauge is decreased while counters in the history table increase. Gauges are available at the gateway level and application level for active calls and instances.
The accumulated statistics are stored in the gateway. You can configure the maximum duration to store the historical records according to your needs and the availability of system memory. You can display the application statistics on the gateway by using show commands.
Monitoring Levels for Voice Applications
Statistics and event logs for voice application instances are organized in a hierarchical model, providing a top-down approach to monitoring. You can detect faults or performance irregularities at a global level, then drill down to more specific details to isolate a fault. Data is available for both active application instances and terminated instances. After an application instance terminates, its data records move from active to history.
You monitor voice applications at three levels. Data is collected for each application instance at the lowest, most detailed level and propagated up to the highest level where the data is consolidated and presented in summary form. The three monitoring levels are:
•
•
•
You can also display application interface statistics for transactions between applications and back-end servers. For information, see the show call application interface command.
Table 12-1 lists the type of records available at each monitoring level.
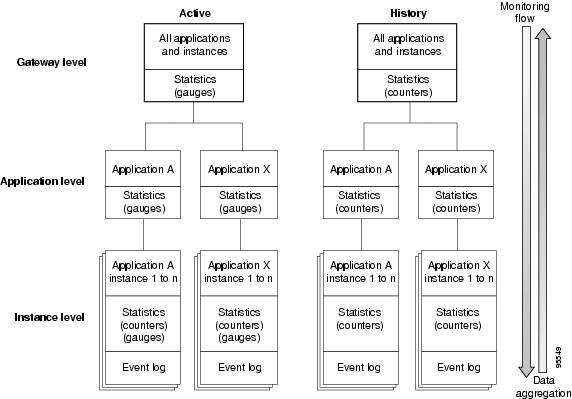
Figure 12-2 illustrates the monitoring levels for identifying application instances affected by an error.
Figure 12-2 Application Monitoring Levels
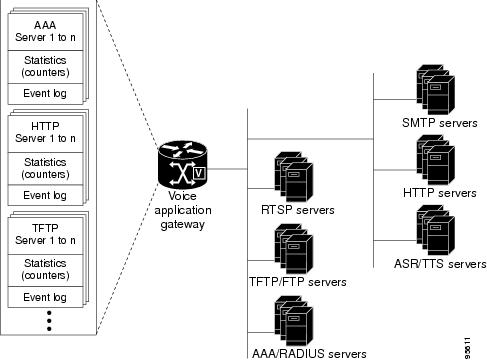
Figure 12-3 shows the type of information available for application interfaces.
Figure 12-3 Application Interface Event Logs and Statistics
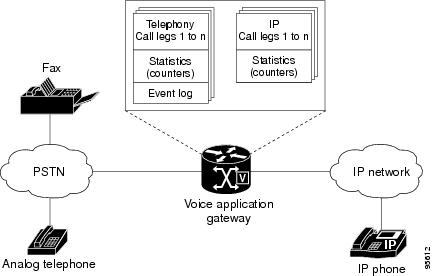
Figure 12-4 shows the type of information available for voice call legs.
Figure 12-4 Call Leg Event Logs and Statistics
Application Instance Statistics
The following statistics are available for application instances.
Subscriber Interaction
•
•
•
•
Subscriber Services
•
–
–
–
–
•
Application Internal Services
•
•
•
•
•
For a description of each statistic and an example of the output, see the show call application session-level command in the Cisco IOS Voice Command Reference, Release 12.3T at http://www.cisco.com/univercd/cc/td/doc/product/software/ios123/123tcr/123tvr/index.htm.
Application Interface Statistics
Statistics for application interfaces are available at the gateway level. The statistics are summarized for the gateway and can be viewed by service type or for a specific server. The following statistics are provided for each of the service types: AAA, ASR, flash memory, HTTP, gateway memory, RTSP, SMTP, TFTP, TTS.
•
•
•
•
For a description of the specific statistics supported for each interface type, and an example of the output, see the show call application interface command in the Cisco IOS Voice Command Reference, Release 12.3T at http://www.cisco.com/univercd/cc/td/doc/product/software/ios123/123tcr/123tvr/index.htm.
Benefits of Voice Application Monitoring and Troubleshooting Enhancements
•
•
•
Guidelines for Enabling Statistics and Event Logging for Voice Applications
The voice application monitoring and troubleshooting enhancements provide separate commands for enabling statistics and event logs. Statistics are useful for both monitoring and troubleshooting and you can enable statistics collection without a noticeable impact on system performance.
Event logging is designed primarily for troubleshooting faults after an error is indicated in the statistics. Depending on the amount of gateway traffic and the type of event logs or event log options that are enabled, the gateway could experience performance issues because of the impact on processor and memory resources. Use the following guidelines to selectively enable event logging:
•
•
•
Throttling Mechanism for Event Logging
Event logging consumes processor memory to store the event logs. To prevent event logging from adversely impacting system resources for production traffic, the gateway uses a throttling mechanism. When free processor memory drops below 20%, the gateway automatically disables event logging for all new application sessions, application interfaces, and call legs for which logging is enabled. It resumes event logging when free memory rises above 30%.
While throttling is occurring, the gateway does not capture any new event logs even if event logging is enabled through Cisco IOS commands. You should monitor free memory on the gateway and enable event logging only when necessary for isolating faults.
Memory Requirements for Writing Event Logs to FTP
You can enable the gateway to write event logs to an external FTP server. This could adversely impact gateway memory resources in some scenarios, for example, when:
•
•
•
•
You should enable FTP dumping only when necessary and not enable it in situations where it might adversely impact your system performance.
How to Configure Monitoring for Voice Applications
This section contains the following procedures:
•
•
•
•
•
•
•
•
•
•
•
Enabling Event Logging and Statistics Globally for Voice Applications
Perform this task to enable event logs and statistics globally for all voice application instances, application interface types, and call legs.
Note
SUMMARY STEPS
1.
2.
3.
4.
5.
6.
7.
8.
9.
10.
11.
12.
DETAILED STEPS
Enabling Event Logging for a Specific Voice Application or Interface
Perform this task to enable event logging and statistics collection for a specific voice application, application interface type, or server.
Note
SUMMARY STEPS
1.
2.
3.
4.
5.
6.
7.
8.
9.
10.
DETAILED STEPS
Monitoring Voice Applications for Active Calls
Perform this task to do basic load monitoring of voice applications when detecting faults or unacceptable ranges while a call is still active.
SUMMARY STEPS
1.
2.
3.
4.
5.
6.
7.
DETAILED STEPS
For examples of the command output for the steps in this task, see the "Examples for Monitoring Voice Applications" section.
Monitoring Voice Applications for Terminated Calls
Perform this task to monitor voice applications, detect faults, and identify the source of faults after a call terminates.
SUMMARY STEPS
1.
2.
3.
4.
5.
6.
7.
DETAILED STEPS
Examples for Monitoring Voice Applications
This section includes output examples demonstrating the task for isolating faults in your voice application network. In this sample scenario, one of the audio prompts used by an application is not available from the specified TFTP server, either because the gateway does not have connectivity to the server or the audio file is not located on the specified server.
Sample Output for show call application history gateway-level Command
In the following example, the show call application history gateway-level command shows that a media failure occurred during a prompt playout. The counters in the output are an aggregation of all application instances that were run and terminated on the gateway. You must next determine which application had the error.
Router# show call application history gateway-levelGateway level statistics for history application sessions:Sessions w/ stats: 7Last reset time: *Aug 26 17:56:34 PSTSubscriber Service - CallPSTN VOIPIncoming Outgoing Incoming OutgoingLegs setup: 7 0 0 0Total legs connected: 7 0 0 0Legs handed in: 0 0 0 0Legs handed in returned back: 0 0 0 0Legs handed out: 0 0 0 0Legs handed out came back: 0 0 0 0Legs disconnected normally: 7 0 0 0Legs disconnected for user error: 0 0 0 0Legs disconnected for system error: 0 0 0 0Subscriber Service - MediaPlay Record TTSMedia attempts: 9 0 1Media successes: 8 0 1Media aborts: 0 0 0Media failures: 1 0 0Total media duration (in seconds): 57 0 17Application Internal Service - Document Read-WriteRead WriteDoc requests: 1 0Doc successes: 1 0Doc failures: 0 0Subscriber Interaction - DTMFDTMFs not matched: 0DTMFs matched: 3DTMFs no input: 0DTMFs long pound: 0Sample Output for show call application history app-level summary Command
In the following example, the show call application history app-level summary command lists all applications that are loaded on the gateway and shows that an error occurred with the application named menu. You can then view statistics for this specific application.
Router# show call application history app-level summaryApplication level history Info:Sessions Last ResetApp Name Stats w/ Stats Total Errors Timesession N 0 0 0fax_hop_on N 0 0 0clid_authen N 0 0 0clid_authen_collect N 0 0 0clid_authen_npw N 0 0 0clid_authen_col_npw N 0 0 0clid_col_npw_3 N 0 0 0clid_col_npw_npw N 0 0 0Default N 0 0 0lib_off_app N 0 0 0fax_on_vfc_onramp_app N 0 0 0debitcard_20 N 0 0 0aaa_tcl N 0 0 0coapp N 0 0 0doc_write Y 1 1 0 *Aug 26 18:21:07generic Y 3 3 0 *Aug 26 18:05:26menu Y 3 3 1 *Aug 26 18:42:48Sample Output for show call application history app-level app-tag Command
In the following example, the show call application history app-level app-tag command for the application named menu shows that there was a media failure when the application tried to play an audio prompt. You must next determine which instance of the application had the error.
Router# show call application history app-level app-tag menuApplication level history Info:Application name: menuURL: tftp://sample/menu.vxmlTotal sessions: 3Sessions w/ stats: 3Last reset time: *Aug 26 18:42:48 PSTSubscriber Service - CallPSTN VOIPIncoming Outgoing Incoming OutgoingLegs setup: 3 0 0 0Total legs connected: 3 0 0 0Legs handed in: 0 0 0 0Legs handed in returned back: 0 0 0 0Legs handed out: 0 0 0 0Legs handed out came back: 0 0 0 0Legs disconnected normally: 3 0 0 0Legs disconnected for user error: 0 0 0 0Legs disconnected for system error: 0 0 0 0Subscriber Service - MediaPlay Record TTSMedia attempts: 6 0 0Media successes: 5 0 0Media aborts: 0 0 0Media failures: 1 0 0Total media duration (in seconds): 29 0 0Subscriber Interaction - DTMFDTMFs not matched: 0DTMFs matched: 3DTMFs no input: 0DTMFs long pound: 0Sample Output for show call application history session-level summary Command
In the following example, the show call application history session-level summary command shows all the instances in history for the menu application. You can next review the statistics and event log for the specific instance that had the error, which has a session ID of 14.
Router# show call application history session-level summarySID Application Name Stat Err Cnt Log Stop Time Duration7 generic Y 0 Y *Aug 26 18:05:2 00:00:128 generic Y 0 Y *Aug 26 18:05:3 00:00:109 generic Y 0 Y *Aug 26 18:05:4 00:00:09D doc_write Y 0 Y *Aug 26 18:21:0 00:00:1712 menu Y 0 Y *Aug 26 18:42:4 00:00:1113 menu Y 0 Y *Aug 26 18:43:0 00:00:1314 menu Y 1 Y *Aug 26 18:43:1 00:00:09Sample Output for show call application history session-level session-id Command
In the following example, the show call application history session-level session-id command for session 14 shows the event log for this instance. The event log shows the name and location of the audio prompt for which the error occurred. You can next review statistics for your application interfaces.
Router# show call application history session-level session-id 14Session Info:Session id: 14Session name:Application name: menuApplication URL: tftp://sample/menu.vxmlStart time: *Aug 26 18:43:09 PSTStop time: *Aug 26 18:43:19 PSTStatistics:Subscriber Service - CallPSTN VOIPIncoming Outgoing Incoming OutgoingLegs setup: 1 0 0 0Total legs connected: 1 0 0 0Legs handed in: 0 0 0 0Legs handed in returned back: 0 0 0 0Legs handed out: 0 0 0 0Legs handed out came back: 0 0 0 0Legs disconnected normally: 1 0 0 0Legs disconnected for user error: 0 0 0 0Legs disconnected for system error: 0 0 0 0Subscriber Service - MediaPlay Record TTSMedia attempts: 2 0 0Media successes: 1 0 0Media aborts: 0 0 0Media failures: 1 0 0Total media duration (in seconds): 9 0 0Subscriber Interaction - DTMFDTMFs not matched: 0DTMFs matched: 1DTMFs no input: 0DTMFs long pound: 0Event log:buf_size=4K, log_lvl=INFO<ctx_id>:<timestamp>:<seq_no>:<severity>:<msg_body>14:1061952189:450:INFO: Session started for App-type = menu, URL = tftp://sample/menu.vxml14:1061952189:451:INFO: Incoming Telephony call received, LegID = 3514:1061952189:452:INFO: LegID = 35: Calling = 4089023198, called = 52927, dial peer = 114:1061952189:453:INFO: LegID = 35: Leg State = LEG_INCCONNECTED14:1061952189:454:INFO: Playing prompt #1: tftp://sample/audio/menu.au14:1061952198:458:INFO: Prompt playing finished successfully.14:1061952199:459:INFO: DTMF digit matched pattern v0, user input = 214:1061952199:460:INFO: Playing prompt #1: tftp://demo/audio/spanish_menu.au14:1061952199:463:ERR : Prompt play setup failure.14:1061952199:464:INFO: Script received event = "error.badfetch"14:1061952199:465:INFO: LegID = 35: Call disconnected, cause = normal call clearing (16)14:1061952199:468:INFO: Session done, terminating cause =Sample Output for show call application interface summary Command
In the following example, the show call application interface summary command shows statistics for each of your interface types including TFTP where the error occurred. You can next display the event log for the specific TFTP server.
Router# show call application interface summaryAggregated statistics for tts service:Stats last reset time *Aug 26 18:41:01 PSTRead requests: 0Read successes: 0Read failures: 0Read aborts: 0Aggregated statistics for asr service:Stats last reset time *Aug 26 18:41:01 PSTRead requests: 0Read successes: 0Read failures: 0Read aborts: 0Aggregated statistics for tftp service:Stats last reset time *Aug 26 18:41:01 PSTRead requests: 2Read successes: 5Read failures: 1Read aborts: 0Total bytes read: 255047Sample Output for show call application interface Command
In the following example, the show call application interface command with the tftp keyword shows the event log for the TFTP server named demo. The event log shows that the gateway could not play the audio prompt because it could not find the TFTP server.
Router# show call application interface tftpServer name: sampleStatistics:Last reset time *Aug 26 18:41:01 PSTRead requests: 2Read successes: 2Read failures: 0Read aborts: 0Total bytes read: 255047Event log:Last reset time *Aug 26 18:05:13 PSTbuf_size=4K, log_lvl=INFO<ctx_id>:<timestamp>:<seq_no>:<severity>:<msg_body>sample:1061949913:173:INFO: ID = 653088C8: Read requested for URL = tftp://sample/audio/menu.ausample:1061949919:176:INFO: ID = 653088C8: Streamed read transaction Successful URL = tftp://sample/audio/menu.ausample:1061952156:416:INFO: ID = 651E5D6C: Read requested for URL = tftp://sample/audio/welcome_test.ausample:1061952166:423:INFO: ID = 651E5D6C: Streamed read transaction Successful URL = tftp://sample/audio/welcome_test.au--------------------------------------------------------------------------------Server name: demoStatistics:Last reset time *Aug 26 18:41:01 PSTRead requests: 1Read successes: 0Read failures: 1Read aborts: 0Total bytes read: 0Event log:Last reset time *Aug 26 18:38:05 PSTbuf_size=4K, log_lvl=INFO<ctx_id>:<timestamp>:<seq_no>:<severity>:<msg_body>demo:1061952199:461:INFO: ID = 6542D968: Read requested for URL = tftp://demo/audio/spanish_menu.audemo:1061952199:462:ERR : ID = 6542D968: Read transaction failed URL = tftp://demo/audio/spanish_menu.au, reason = IFS error 65540=Invalid IP address or hostname--------------------------------------------------------------------------------Monitoring Voice Call Legs
Perform this task to do basic monitoring of voice call legs. This can help you diagnose problems that occur during call setup before the call reaches the application.
Note
SUMMARY STEPS
1.
2.
3.
4.
5.
DETAILED STEPS
What To Do Next
•
•
•
–
–
–
–
Clearing Event Logs and Statistics for Application Instances and Interfaces
Perform this task to reset statistic counters to zero.
SUMMARY STEPS
1.
2.
3.
DETAILED STEPS
Displaying Event Logs for Applications or Call Legs in Real-Time
Perform this task to display event logs for active calls as the events occur. If you are debugging or testing a script in a production-level network, the high call volume can make it difficult to select and view a specific event log while a call is still active. This task enables dynamic logging so that you can view events as they happen for active application instances or call legs. The output continues until the call terminates or you stop the display by using the stop keyword.
SUMMARY STEPS
1.
2.
3.
DETAILED STEPS
Modifying Event Log Settings for Application Instances
Perform this task to modify the default settings for the event logs that are generated for voice application instances.
SUMMARY STEPS
1.
2.
3.
4.
5.
6.
7.
8.
9.
DETAILED STEPS
Modifying Event Log Settings for Application Interfaces
Perform this task to modify the default settings for event logs generated for types of server interfaces that communicate with voice applications.
SUMMARY STEPS
1.
2.
3.
4.
5.
6.
7.
8.
9.
10.
DETAILED STEPS
Modifying Event Log Settings for Call Legs
Perform this task to modify the default settings for event logs generated for voice call legs.
Restrictions
Event logs are available for telephony call legs only. Event logs for IP call legs are not supported.
SUMMARY STEPS
1.
2.
3.
4.
5.
6.
DETAILED STEPS
Modifying Event Log History Limits
Perform this task to modify the default settings for saving event logs to history.
SUMMARY STEPS
1.
2.
3.
4.
5.
6.
7.
8.
9.
10.
11.
DETAILED STEPS
Configuration Examples for Monitoring Voice Applications
This section includes the following examples:
•
•
Enabling Event Logs and Statistics Globally: Example
!version 12.3service timestamps debug datetime msecservice timestamps log uptimeno service password-encryption!hostname Router!!resource-pool disabletdm clock priority 1 1/0spe default-firmware spe-firmware-1aaa new-model!!ip domain name domain.comip host speech-asr 10.10.10.111ip host ftp-server 10.10.10.119!isdn switch-type primary-5ess!!voice service voipfax protocol t38 ls-redundancy 7 hs-redundancy 3 fallback none!ivr asr-server rtsp://speech-asr/recognizerivr tts-server rtsp://speech-asr/synthesizer!fax receive called-subscriber $d$fax send transmitting-subscriber 5550122fax send left-header Date: $a$fax send center-header $d$fax send right-header $s$fax send coverpage email-controllablefax send coverpage comment Cover Page commentfax interface-type fax-mailmta send server 10.10.10.112 port 25mta send subject sample subjectmta send postmaster postmaster@domain.commta send mail-from hostname Router.domain.commta send mail-from username user1mta receive aliases [10.10.10.100]mta receive maximum-recipients 1000dial-control-mib retain-timer 10dial-control-mib max-size 2!!controller T1 1/0framing esflinecode b8zspri-group timeslots 1-24!interface FastEthernet0/0ip address 10.10.10.100 255.255.0.0no ip route-cacheno ip mroute-cacheduplex autospeed autono cdp enable!interface FastEthernet0/1ip address 11.11.11.100 255.255.0.0no ip route-cacheno ip mroute-cacheduplex autospeed auto!!interface Serial1/0:23no ip addressisdn switch-type primary-5essisdn incoming-voice modemno cdp enable!interface Group-Async0no ip addressno ip route-cacheno ip mroute-cacheno peer default ip addressgroup-range 3/00 3/107!!interface Dialer1no ip addressno ip route-cacheno ip mroute-cache!ip default-gateway 10.10.10.1ip classlessip route 10.0.0.0 255.0.0.0 10.10.10.1ip route 11.0.0.0 255.0.0.0 11.11.11.1no ip http server!snmp-server community password RWsnmp-server enable traps tty!call leg event-log!applicationservice onramp tftp://demo/router/TCLware.2.0.1/app_libretto_onramp9.2.0.0.tcl!service offramp tftp://demo/router/TCLware.2.0.1/app_faxmail_offramp.2.0.1.1.tcl!service generic tftp://demo/scripts/master/generic.vxml!monitorinterface statsinterface event-logstatsevent-log!voice-port 1/0:D!dial-peer cor custom!dial-peer voice 1 potsservice genericincoming called-number .direct-inward-dial!dial-peer voice 2 mmoipservice fax_on_vfc_onramp_app out-bounddestination-pattern .information-type faxsession target mailto:$e$@[10.10.10.112]!line con 0exec-timeout 0 0logging synchronousline aux 0logging synchronousline vty 5 105line 2/00 3/107no flush-at-activationmodem InOut!scheduler allocate 10000 400!endCustomizing Event Logs and Statistics Example
...call leg event-log errors-onlycall leg event-log max-buffer-size 10call leg event-log dump ftp ftp-server/leg_elogs.log username myname password mypasscall leg event-log!applicationservice onramp tftp://demo/router/TCLware.2.0.1/app_libretto_onramp9.2.0.0.tcl!service offramp tftp://demo/router/TCLware.2.0.1/app_faxmail_offramp.2.0.1.1.tcl!service generic tftp://demo/scripts/master/generic.vxml!monitorinterface statsinterface event-loginterface event-log error-onlyinterface event-log max-buffer-size 50interface event-log dump ftp ftp-server/int_elogs.log username myname password mypassinterface event-log ram disableinterface max-server-records 20statsevent-logevent-log error-onlyevent-log max-buffer-size 8event-log dump ftp ftp-server/app_elogs.log username myname password mypass!
Additional References
•
•