Feedback
Contents
debug saa apm through debug snmp sync
- debug saa apm
- debug saa slm
- debug saa xml
- debug sampler
- debug satellite
- debug satellite firmware
- debug sccp
- debug sccp config
- debug qbm
- debug sdlc
- debug sdlc local-ack
- debug sdlc packet
- debug serial interface
- debug serial lead-transition
- debug serial packet
- debug service-group
- debug service-module
- debug sgbp dial-bids
- debug sgbp error
- debug sgbp hellos
- debug sgcp
- debug sgcp errors
- debug sgcp events
- debug sgcp packet
- debug shared-line
- debug smrp all
- debug smrp group
- debug smrp mcache
- debug smrp neighbor
- debug smrp port
- debug smrp route
- debug smrp transaction
- debug snasw dlc
- debug snasw ips
- debug snmp bulkstat
- debug snmp detail
- debug snmp mib nhrp
- debug snmp overhead
- debug snmp packet
- debug snmp requests
- debug snmp sync
- debug snmp tunnel-mib
debug saa apm
NoteEffective with Cisco IOS Release 12.3(14)T, the debug saa apmcommand is replaced by the debug ip sla monitor apmcommand. See the debug ip sla monitor apmcommand for more information.
To enable debugging output for Cisco IOS IP Service Level Agreements (SLAs) Application Performance Monitor (APM) operations, use the debug saa apm command in privileged EXEC mode. To disable debugging output, use the no form of this command.
Examples
The following is sample output from the debug saa apm command:
Router# debug saa apm
Router# configure terminal
Router(config)# saa apm operation 123 start ftp://apm/config/iptv.cf
21:40:27: SAA-APM-123: downloading file (apm/config/iptv.cf) of size (534)
21:40:29: SAA-APM-123: downloading file (apm/scheduler/master.sch) of size (2500)
21:40:30: SAA-APM-123: downloading file (apm/scripts/iptv.scr) of size (1647)
21:40:32: SAA-APM-123: downloading file (apm/data/iptv.dat) of size (118)
21:40:32: SAA-APM-123: sending APM_CAPABILITIES_REQUEST message
21:40:32: sending control msg:
21:40:32: Ver: 1 ID: 29 Len: 48
21:40:32: SAA-APM-123: apm_engine version: major<1>, minor<0>
21:40:32: SAA-APM-123: sending APM_SCRIPT_DNLD message
21:40:32: sending control msg:
21:40:32: Ver: 1 ID: 30 Len: 148
21:40:37: SAA-APM-123: sending APM_SCRIPT_DNLD_STATUS message
21:40:37: sending control msg:
21:40:37: Ver: 1 ID: 31 Len: 148
21:40:38: SAA-APM-123: starting the operation
21:40:38: SAA-APM-123: sending APM_SCRIPT_START message
21:40:38: sending control msg:
21:40:38: Ver: 1 ID: 32 Len: 148
21:40:41: SAA-APM: 0,2144,0
.
.
.
21:49:42: SAA-APM-123: waiting for ageout timer to expire
21:55:13: SAA-APM-123: sending APM_SCRIPT_DONE message
21:55:13: sending control msg:
21:55:13: Ver: 1 ID: 42 Len: 148
21:55:13: SAA-APM-123: operation done
Router(config)# no saa apm
21:55:13: SAA-APM-123: sending APM_SCRIPT_DONE message
21:55:13: sending control msg:
21:55:13: Ver: 1 ID: 42 Len: 148
21:55:13: SAA-APM-123: operation done
debug saa slm
NoteEffective with Cisco IOS Release 12.3(14)T, the debug saa slmcommand is replaced by the debug ip sla monitor slmcommand. See the debug ip sla monitor slmcommand for more information.
To enable debugging output of detailed event messages for Cisco IOS IP Service Level Agreements (SLAs) Service Level Monitoring (SLM) Asynchronous Transfer Mode (ATM) operations, use the debug saa slmcommand in privileged EXEC mode. To disable debugging output, use the no form of this command.
Usage Guidelines
IP SLAs SLM ATM performance statistics cannot be retrieved from Cisco IOS devices using Simple Network Management Protocol (SNMP). The IP SLAs SLM ATM feature was designed to provide data by responding to extensible markup language (XML) requests.
NoteThis command may generate a large number of debugging messages.
debug saa xml
NoteEffective with Cisco IOS Release 12.3(14)T, the debug saa xmlcommand is replaced by the debug ip sla monitor xmlcommand. See the debug ip sla monitor xmlcommand for more information.
To enable debugging output of eXtensible Markup Language (XML) requests and responses for Cisco IOS IP Service Level Agreements (SLAs) operations, use the debug saa xmlcommand in privileged EXEC mode. To disable debugging output, use the no form of this command.
debug sampler
To enable debugging output for Flexible NetFlow samplers, use the debug sampler command in privileged EXEC mode. To disable debugging output, use the no form of this command.
debug sampler [ detailed | error | [name] sampler-name [ detailed | error | sampling samples ] ]
no debug sampler [ detailed | error | [name] sampler-name [ detailed | error | sampling ] ]
Syntax Description
detailed
(Optional) Enables detailed debugging for sampler elements.
error
(Optional) Enables debugging for sampler errors.
name
(Optional) Specifies the name of a sampler.
sampler-name
(Optional) Name of a sampler that was previously configured.
sampling samples
(Optional) Enables debugging for sampling and specifies the number of samples to debug.
Command History
Release
Modification
12.4(9)T
This command was introduced.
12.2(31)SB2
This command was integrated into Cisco IOS Release 12.2(31)SB2.
12.0(33)S
This command was implemented on the Cisco 12000 series routers.
12.2(33)SRC
Support for this command was added for Cisco 7200 series routers.
12.2(33)SRE
This command was integrated into Cisco IOS Release 12.2(33)SRE for the Cisco 7300 Network Processing Engine (NPE) series routers.
12.2(50)SY
This command was integrated into Cisco IOS Release 12.2(50)SY.
Examples
The following sample output shows that the debug process has obtained the ID for the sampler named SAMPLER-1:
Router# debug sampler detailed *Oct 28 04:14:30.883: Sampler: Sampler(SAMPLER-1: flow monitor FLOW-MONITOR-1 (ip,Et1/0,O) get ID succeeded:1 *Oct 28 04:14:30.971: Sampler: Sampler(SAMPLER-1: flow monitor FLOW-MONITOR-1 (ip,Et0/0,I) get ID succeeded:1debug satellite
To enable debugging output for the Cisco IP VSAT satellite WAN network module (NM-1VSAT-GILAT), use the debug satellite command in privileged EXEC mode. To disable debugging output, use the no form of this command.
debug satellite { all | errors | events | hsrp | rbcp }
no debug satellite { all | errors | events | hsrp | rbcp }
Syntax Description
all
Displays all types of satellite debug information.
errors
Displays debug information for satellite error events.
events
Displays debug information for software events.
hsrp
Displays debug information for satellite Hot Standby Router Protocol (HSRP) events.
rbcp
Displays debug information for satellite Router Blade Control Protocol (RBCP) messages.
Usage Guidelines
The debug satellite errors command is useful for catching unusual conditions when troubleshooting unexpected behavior. Because this command typically generates very little output, you can enter the debug satellite errors command every time you troubleshoot satellite network connectivity.
Examples
Every 2 minutes, the NM-1VSAT-GILAT network module sends the router an RBCP message requesting any updates to the routing table. The following example shows how to monitor the route-update messages:
Router# debug satellite rbcp

...
The NM-1VSAT-GILAT network module requests IP route information:
*May 16 09:18:54.475:Satellite1/0 RBCP Request msg Recd:IPROUTE_REQ(0x22)The Cisco IOS software acknowledges that it received the message from the NM-1VSAT-GILAT network module:
*May 16 09:18:54.475:Satellite1/0 RBCP Response msg Sent:IPROUTE_REQ(0x22)The Cisco IOS software sends the IP route information to the NM-1VSAT-GILAT network module:
*May 16 09:18:54.475:Satellite1/0 RBCP Request msg Sent:IPROUTE_UPD(0x23)The NM-1VSAT-GILAT network module acknowledges that it received the routing update from the Cisco IOS software:
*May 16 09:18:54.475:Satellite1/0 RBCP Response msg Recd:IPROUTE_UPD(0x23)Examples
The following example shows how to monitor the periodic heartbeats that the NM-1VSAT-GILAT network module sends to the Cisco IOS software:
Router# debug satellite events

satellite major software events debugging is on
.Dec 16 12:57:52.108:Satellite1/0 FSM transition LINK_UP-->LINK_UP, ev=got_heartbeat
.Dec 16 12:58:08.888:Satellite1/0 FSM transition LINK_UP-->LINK_UP, ev=got_heartbeat
.Dec 16 12:58:25.664:Satellite1/0 FSM transition LINK_UP-->LINK_UP, ev=got_heartbeat
.Dec 16 12:58:42.440:Satellite1/0 FSM transition LINK_UP-->LINK_UP, ev=got_heartbeat
Examples
The following example shows the debug satellite hsrp command messages that appear when the active router is forced to standby status because the HSRP-tracked satellite interface is shut down:
Router# configure terminal

Enter configuration commands, one per line.  End with CNTL/Z.
Router(config)# interface satellite 1/0

Router(config-if)# shutdown

Router(config-if)# end

Router#
01:03:48:%SYS-5-CONFIG_I:Configured from console by console
01:03:49:%LINK-5-CHANGED:Interface Satellite1/0, changed state to administratively down
01:03:50:%LINEPROTO-5-UPDOWN:Line protocol on Interface Satellite1/0, changed state to down
01:04:22:%HSRP-6-STATECHANGE:FastEthernet0/0 Grp 1 state Active -> Speak
01:04:22:HSRP-sat:IPred group grp-x update state ACTIVE --> SPEAK
01:04:22:Satellite1/0 HSRP-sat:fsm crank ACTIVE-->STANDBY
01:04:22:Satellite1/0 HSRP-sat:send standby msg STANDBY
01:04:32:HSRP-sat:IPred group grp-x update state SPEAK --> STANDBY
01:04:32:Satellite1/0 HSRP-sat:fsm crank STANDBY-->STANDBY
01:04:32:Satellite1/0 HSRP-sat:send standby msg STANDBY
01:04:42:Satellite1/0 HSRP-sat:send standby msg STANDBY
01:04:52:Satellite1/0 HSRP-sat:standby msg STANDBY deferred, not in operational state
01:05:02:Satellite1/0 HSRP-sat:standby msg STANDBY deferred, not in operational state
01:05:12:Satellite1/0 HSRP-sat:standby msg STANDBY deferred, not in operational state
01:05:22:Satellite1/0 HSRP-sat:standby msg STANDBY deferred, not in operational state
01:05:32:Satellite1/0 HSRP-sat:standby msg STANDBY not sent, already in state
01:06:47:%VSAT-5-STANDBY_MODE:Satellite1/0 module configured for standby mode
01:09:32:Satellite1/0 HSRP-sat:fsm crank STANDBY-->STANDBY-UP
Examples
The following example shows HSRP-related debug output for both the router and the NM-1VSAT-GILAT network module when the router goes from standby to active state because the HSRP-tracked satellite interface is reenabled:
Router# show debugging

SATCOM:
  satellite HSRP events debugging is on
HSRP:
  HSRP Errors debugging is on
  HSRP Events debugging is on
  HSRP Packets debugging is on
The satellite interface is reenabled:
Router# configure terminal

Router(config)# interface satellite 1/0

Router(config-if)# no shutdown

Router(config-if)# end

Router#
The effective HSRP priority of the router changes as the tracked satellite interface comes up:
02:14:37:HSRP:Fa0/0 Grp 1 Hello  in  10.123.96.2 Active  pri 90 vIP 10.123.96.100
02:14:39:HSRP:Fa0/0 API 10.1.0.6 is not an HSRP address
02:14:39:HSRP:Fa0/0 Grp 1 Hello  out 10.123.96.3 Standby pri 90 vIP 10.123.96.100
02:14:39:HSRP:Fa0/0 Grp 1 Track 1 object changed, state Down -> Up
02:14:39:HSRP:Fa0/0 Grp 1 Priority 90 -> 100
Router#
The router changes from standby to active state because its priority is now highest in the hot standby group, and preemption is enabled:
02:14:40:HSRP:Fa0/0 Grp 1 Hello  in  10.123.96.2 Active  pri 90 vIP 10.123.96.100
02:14:40:HSRP:Fa0/0 Grp 1 Standby:h/Hello rcvd from lower pri Active router (90/10.123.96.2)
02:14:40:HSRP:Fa0/0 Grp 1 Active router is local, was 10.123.96.2
02:14:40:HSRP:Fa0/0 Grp 1 Standby router is unknown, was local
02:14:40:HSRP:Fa0/0 Redirect adv out, Active, active 1 passive 3
02:14:40:HSRP:Fa0/0 Grp 1 Coup   out 10.123.96.3 Standby pri 100 vIP 10.123.96.100
02:14:40:HSRP:Fa0/0 Grp 1 Standby -> Active
02:14:40:%HSRP-6-STATECHANGE:FastEthernet0/0 Grp 1 state Standby -> Active
The HSRP status of the satellite interface also changes from standby to active state because the service-module ip redundancy command was previously entered to link the HSRP status of the satellite interface to the primary HSRP interface, Fast Ethernet 0/0.
02:14:40:HSRP:Fa0/0 Grp 1 Redundancy "grp-x" state Standby -> Active
02:14:40:HSRP-sat:IPred group grp-x update state STANDBY --> ACTIVE
02:14:40:Satellite1/0 HSRP-sat:fsm crank STANDBY-UP-->ACTIVE-COND
02:14:40:HSRP:Fa0/0 Redirect adv out, Active, active 1 passive 2
02:14:40:HSRP:Fa0/0 Grp 1 Hello  out 10.123.96.3 Active  pri 100 vIP 10.123.96.100
02:14:40:HSRP:Fa0/0 REDIRECT adv in, Passive, active 0, passive 2, from 10.123.96.2
02:14:40:HSRP:Fa0/0 REDIRECT adv in, Passive, active 0, passive 1, from 10.123.96.15
02:14:40:HSRP:Fa0/0 Grp 1 Hello  in  10.123.96.2 Speak   pri 90 vIP 10.123.96.100
Line protocols come up, and HSRP states become fully active:
02:14:41:%LINK-3-UPDOWN:Interface Satellite1/0, changed state to up 02:14:42:%LINEPROTO-5-UPDOWN:Line protocol on Interface Satellite1/0, changed state to up 02:14:43:HSRP:Fa0/0 Grp 1 Hello out 10.123.96.3 Active pri 100 vIP 10.123.96.100 02:14:43:HSRP:Fa0/0 Grp 1 Redundancy group grp-x state Active -> Active 02:14:43:HSRP-sat:IPred group grp-x update state ACTIVE --> ACTIVE 02:14:43:Satellite1/0 HSRP-sat:fsm crank ACTIVE-COND-->ACTIVE-COND 02:14:43:HSRP:Fa0/0 Grp 1 Hello in 10.123.96.2 Speak pri 90 vIP 10.123.96.100 02:14:46:HSRP:Fa0/0 Grp 1 Hello out 10.123.96.3 Active pri 100 vIP 10.123.96.100 02:14:46:HSRP:Fa0/0 Grp 1 Redundancy group grp-x state Active -> Active 02:14:46:HSRP-sat:IPred group grp-x update state ACTIVE --> ACTIVE 02:14:46:Satellite1/0 HSRP-sat:fsm crank ACTIVE-COND-->ACTIVE-COND 02:14:46:HSRP:Fa0/0 Grp 1 Hello in 10.123.96.2 Speak pri 90 vIP 10.123.96.100 02:14:49:HSRP:Fa0/0 Grp 1 Hello out 10.123.96.3 Active pri 100 vIP 10.123.96.100 02:14:49:HSRP:Fa0/0 Grp 1 Hello in 10.123.96.2 Speak pri 90 vIP 10.123.96.100 02:14:50:HSRP:Fa0/0 Grp 1 Hello in 10.123.96.2 Standby pri 90 vIP 10.123.96.100 02:14:50:HSRP:Fa0/0 Grp 1 Standby router is 10.123.96.2 02:14:51:Satellite1/0 HSRP-sat:send standby msg ACTIVE 02:14:52:HSRP:Fa0/0 Grp 1 Hello out 10.123.96.3 Active pri 100 vIP 10.123.96.100 02:14:53:HSRP:Fa0/0 Grp 1 Hello in 10.123.96.2 Standby pri 90 vIP 10.123.96.100 02:14:55:HSRP:Fa0/0 Grp 1 Hello out 10.123.96.3 Active pri 100 vIP 10.123.96.100debug satellite firmware
To enable debugging output for the Cisco IP VSAT satellite WAN network module (NM-1VSAT-GILAT) firmware, use the debug satellite firmwarecommand in privileged EXEC mode. To disable debugging output, use the no form of this command.
Syntax Description
Usage Guidelines
The output from this command is generally useful for diagnostic tasks performed by technical support.
The level number affects which debug messages the system displays for subsequently entered debug satellite firmware commands. The table below describes what each command option displays at each debug level.
NoteLevel 3 debugging produces significant amounts of output that may negatively impact the performance of both the NM-1VSAT-GILAT network module and the router. When you enter debug level 3, a warning message and confirmation prompt appear.
Table 1 debug satellite firmware Command Level Options Option
Level 1 Output
Level 2 Output
Level 3 Output
bb
Backbone link information
Frame statistics for the backbone link to the hub
--
buf
Buffer information
Buffer owners
--
en
Satellite firmware-based encryption events
--
--
ip
IP statistics
--
Driver transmission statistics
rbcp
Number of transmitted and received RBCP messages
--
Satellite Control Protocol (SCP) message summaries
rpa
RPA statistics
Tunnel connect and disconnect events
--
tcp
TCP statistics
TCP connection information
TCP statistics and TCP connection information
sat
Inbound and outbound packet statistics
Inbound and outbound packet statistics
Inbound and outbound packet statistics
trc
--
--
Backbone receive and transmit traces
Examples
The following example shows all satellite firmware events and statistics:
Router# debug satellite firmware all

2d06h: Satellite2/0
buffers 4856 min 4486 list_str 683798 list_end 6885c8
emp 686030 fil 685de0 start 6885c8 end fb4fe8
2d06h: Satellite2/0
TCP stats: NetRXBytes=223 NetTXBytes=4775126 NetRxPkts=104213 ToIOSPkts=104166
2d06h: Satellite2/0
SAT stats: OUTbound_pkts=114131, INbound_pkts=182347
2d06h: Satellite2/0
RBCP statistics: TXcount=975 RXCount=975
2d06h: Satellite2/0
RPA stats: ToTunnel=0 FromTunnel=0
TunnelGets=0 TunnelNotGets=0
BlksUsed=0 BlksIn-Use=0 Max=300
2d06h: Satellite2/0
EN:
RX encrypted bytes received = 0
RX: compressed=0 -> Uncompressed=0
TX: compressed=0 -> Uncompressed=0
2d06h: Satellite2/0
BB 6 LINK state=INFO_STATE
     Status = 0x79,  LOW NOT READY,  HI PRI READY
     RSP Q free=230, Max HI=228, Max LOW=224, Max DG=232
     IN RA mode
     Curr DG BW=50000, HighDG BW=100000, Curr BW=98094
    MaxDG BW=1250000, Max BW=2500000
     PD Queue lengths:
        q_wtog=0, q_wtos=57,  q_wtos_high=0, q_defrag=d
     DG Queue lengths:
        q_dg_wtos=0, q_dg_wtos_hi=0, q_dg_defrag=0
     Congestion Levels:        TX LOCAL = 7, TX NET = 0
2d06h: Satellite2/0
IP stats: ToIOS_Pkts=234193, ToIOS_Bytes=183444492 FromIOS_Pkts=143 From_IOS_Bytes=12204
2d06h: Satellite2/0 NO Trace at levels 1 or 2
2d06h: Satellite2/0 NO Trace at levels 1 or 2
Examples
The following example shows backbone link information:
Router# debug satellite firmware level 1

Router# debug satellite firmware bb

satellite BackBone events debugging is on
Router#
2d06h: Satellite2/0
BB 6 LINK state=INFO_STATE
     Status = 0x79,  LOW NOT READY,  HI PRI READY
     RSP Q free=240, Max HI=228, Max LOW=224, Max DG=232
     IN RA mode
     Curr DG BW=50000, HighDG BW=100000, Curr BW=96188
    MaxDG BW=1250000, Max BW=2500000
     PD Queue lengths:
        q_wtog=0, q_wtos=95,  q_wtos_high=0, q_defrag=d
     DG Queue lengths:
        q_dg_wtos=0, q_dg_wtos_hi=0, q_dg_defrag=0
     Congestion Levels:        TX LOCAL = 7, TX NET = 0
2d06h: Satellite2/0
BB 6 LINK state=INFO_STATE
     Status = 0x7b,  LOW READY,  HI PRI READY
     RSP Q free=27, Max HI=228, Max LOW=224, Max DG=232
     IN RA mode
     Curr DG BW=50000, HighDG BW=100000, Curr BW=92376
    MaxDG BW=1250000, Max BW=2500000
     PD Queue lengths:
        q_wtog=0, q_wtos=24,  q_wtos_high=0, q_defrag=d
     DG Queue lengths:
        q_dg_wtos=0, q_dg_wtos_hi=0, q_dg_defrag=0
     Congestion Levels:        TX LOCAL = 4, TX NET = 0
Examples
The following example shows frame statistics for the backbone link to the hub:
Router# debug satellite firmware level 2

Router# debug satellite firmware bb

satellite BackBone events debugging is on
Router#
2d06h: Satellite2/0 BB link statistics
    Frame Type          # Received      # Transmitted
  ------------          ----------      -------------
   INFORMATION           00096238          00184811
   UNNUMBERED            00000000          00000067
   RETRANSMITTED         00000000          00000000
   POLLS                 00000000          00000000
   ACKS                  00006640          00000455
   NAKS                  00000000          00000000
   PACKS                 00000000          00000000
   UA                    00000001          00000000
   SABME                 00000000          00000001
   DISC                  00000000          00000000
Examples
The following example shows buffer information:
Router# debug satellite firmware level 1

Router# debug satellite firmware buf

*May 13 15:58:54.498:Satellite1/0
buffers 4951 min 4945 list_str 681858 list_end 686688
emp 683abc fil 6839e8 start 686688 end fb30a8
Examples
The following example shows buffer owners:
Router# debug satellite firmware level 2

Router# debug satellite firmware buf

*May 13 15:59:13.438:Satellite1/0 inuse 49 free 4951
Trace byte  1
Trace byte = 0x169    Count =   49
Trace byte  2
Trace byte = 0x  0    Count =   49
   0 buffers with BB Rel only
   0 buffers with in lower layer set
   0 buffers with do not transmit set
   0 buffers on BB retransmit queues
Examples
The following example shows IP statistics:
Router# debug satellite firmware level 1

Router# debug satellite firmware ip

*Nov  7 08:27:56.440: Satellite3/0
IP stats: ToIOS_Pkts=0, ToIOS_Bytes=0 FromIOS_Pkts=84751 From_IOS_Bytes=5941124
Examples
The following example shows the number of RBCP messages transmitted and received since the most recent reset of the Cisco IOS software on the router or the VSAT software on the NM-1VSAT-GILAT network module:
Router# debug satellite firmware level 1

Router# debug satellite firmware rbcp

RBCP statistics:TXcount=301154 RXCount=301155
Examples
The following example shows RPA statistics:
Router# debug satellite firmware level 1

Router# debug satellite firmware rpa

  *Nov  7 08:27:13.488:Satellite3/0
  RPA stats:ToTunnel=0 FromTunnel=0
  TunnelGets=0 TunnelNotGets=0
  BlksUsed=0 BlksIn-Use=0 Max=400
Examples
The following example shows a tunnel being disconnected:
Router# debug satellite firmware level 2

Router# debug satellite firmware rpa

*May 13 18:27:59.779:Satellite1/0 RPA Tunnel DOWN
RPA:InitTunnelConn Successful locIP e000006 locPort 1090, RemIP c0a80186,
RemPort 9876
RPA Tunnel DOWN
RPA:InitTunnelConn Successful locIP e000006 locPort 1091, RemIP c0a80186,
RemPort 9876
RPA Tunnel DOWN
RPA:InitTunnelConn Successful locIP e000006 locPort 1092, RemIP c0a80186,
RemPort 9876
RPA Tunnel DOWN
RPA:InitTunnelConn Successful locIP e000006 locPort 1093, RemIP c0a80186,
RemPort 9876
RPA Tunnel DOWN
RPA:InitTunnelConn Successful locIP e000006 locPort 1094, RemIP c0a80186,
RemPort 9876
Examples
The following example shows inbound and outbound packet statistics. Note that for all levels, the debug output is the same for the sat option.
Router# debug satellite firmware level 1

Router# debug satellite firmware sat

satellite related trace events debugging is on
Router#
1d16h: Satellite2/0
SAT stats: OUTbound_pkts=25660796, INbound_pkts=3235932
1d16h: Satellite2/0
SAT stats: OUTbound_pkts=25660800, INbound_pkts=3235934
1d16h: Satellite2/0
SAT stats: OUTbound_pkts=25660803, INbound_pkts=3235934
1d16h: Satellite2/0
SAT stats: OUTbound_pkts=25660803, INbound_pkts=3235934
Examples
The following example shows TCP statistics:
Router# debug satellite firmware level 1

Router# debug satellite firmware tcp

satellite tcp events debugging is on
Router#
2d06h: Satellite2/0
TCP stats: NetRXBytes=631292 NetTXBytes=4009436 NetRxPkts=49244 ToIOSPkts=49246
2d06h: Satellite2/0
TCP stats: NetRXBytes=1154356 NetTXBytes=4086106 NetRxPkts=49621 ToIOSPkts=49629
Examples
The following example shows the TCP connections:
Router# debug satellite firmware level 2

Router# debug satellite firmware tcp

satellite tcp events debugging is on
Router#
2d06h: Satellite2/0 TCP connections:
ID=48, locIP=192.168.107.2 remIP=172.25.1.2, locP=2962, remP=21 state=17 iosQ=0
ID=49, locIP=192.168.107.2 remIP=172.25.1.2, locP=2963, remP=20 state=17 iosQ=0
ID=58, locIP=192.168.107.2 remIP=172.25.1.28, locP=2972, remP=21 state=17 iosQ=0
ID=59, locIP=192.168.107.2 remIP=172.25.1.28, locP=2973, remP=20 state=17 iosQ=7
2d06h: Satellite2/0 TCP connections:
ID=48, locIP=192.168.107.2 remIP=172.25.1.2, locP=2962, remP=21 state=17 iosQ=0
ID=49, locIP=192.168.107.2 remIP=172.25.1.2, locP=2963, remP=20 state=7 iosQ=0
ID=60, locIP=192.168.107.2 remIP=172.25.1.28, locP=2974, remP=21 state=3 iosQ=0
Examples
The following example shows TCP statistics and connections:
Router# debug satellite firmware level 3

Output may be extensive and affect performance. Continue? [yes]: yes

Router# debug satellite firmware tcp

satellite tcp events debugging is on
Router#
2d06h: Satellite2/0
TCP stats: NetRXBytes=279 NetTXBytes=9436111 NetRxPkts=64991 ToIOSPkts=64999
2d06h: Satellite2/0 TCP connections:
ID=48, locIP=192.168.107.2 remIP=172.25.1.2, locP=2962, remP=21 state=7 iosQ=0
ID=49, locIP=192.168.107.2 remIP=172.25.1.2, locP=2963, remP=20 state=7 iosQ=0
ID=62, locIP=192.168.107.2 remIP=172.25.1.28, locP=2976, remP=21 state=7 iosQ=0
2d06h: Satellite2/0
TCP stats: NetRXBytes=382 NetTXBytes=9582924 NetRxPkts=64993 ToIOSPkts=65001
2d06h: Satellite2/0 TCP connections:
ID=48, locIP=192.168.107.2 remIP=172.25.1.2, locP=2962, remP=21 state=17 iosQ=0
ID=49, locIP=192.168.107.2 remIP=172.25.1.2, locP=2963, remP=20 state=17 iosQ=0
ID=62, locIP=192.168.107.2 remIP=172.25.1.28, locP=2976, remP=21 state=7 iosQ=0
Examples
The following example shows detailed receive and transmit traces for the backbone link:
Router# debug satellite firmware level 3 Output may be extensive and affect performance. Continue? [yes]: yes Router# debug satellite firmware trc satellite BackBone trace debugging is on Router# 2d06h: Satellite2/0 strrec 0, rec 0, count 256, trc 1a6dd78, str 1a5c600, end 1a 74600 count 4096, emp 1a6dd78, fil 1a6d8b0, lnknum=6 0 xmt 6 len 951 9 pd con 0 PF 3 ns 169 nr 15 a c12 0 0.000 1 xmt 6 len 951 9 pd con 0 PF 3 ns 170 nr 15 a c12 0 0.010 2 xmt 6 len 951 9 pd con 0 PF 3 ns 171 nr 15 a c12 0 0.010 3 xmt 6 len 951 9 pd con 0 PF 3 ns 172 nr 15 a c12 0 0.010 4 xmt 6 len 951 9 pd con 0 PF 3 ns 173 nr 15 a c12 0 0.030 5 xmt 6 len 2d06h: Satellite2/0 951 2d06h: Satellite2/0 9 pd con 0 PF 3 ns 174 nr 15 a c12 0 0.010 6 xmt 6 len 951 9 pd con 0 PF 3 ns 175 nr 15 a c12 0 0.010 7 xmt 6 len 951 9 pd con 0 PF 3 ns 176 nr 15 a c12 0 0.010 8 xmt 6 len 951 9 pd con 0 PF 3 ns 177 nr 15 a c12 0 0.010 9 xmt 6 len 951 9 pd con 0 PF 3 ns 178 nr 15 a c12 0 0.010 10 xmt 6 len 951 9 pd con 0 PF 3 ns 179 nr 15 a c12 0 0.010 11 xmt 6 len 951 9 pd con 0 PF 3 ns 180 nr 15 a c12 0 0.010debug sccp
To display debugging information for Simple Client Control Protocol (SCCP) and its related applications (transcoding and conferencing), use the debug sccpcommand in privileged EXEC mode. To disable debugging output, use the no form of this command.
Usage Guidelines
The router on which this command is used must be equipped with one or more digital T1/E1 packet voice trunk network modules (NM-HDVs) or high-density voice (HDV) transcoding and conferencing digital signal processor (DSP) farms (NM-HDV-FARMs) to provide DSP resources.
Debugging is turned on for all DSP farm service sessions. You can debug multiple sessions simultaneously, with different levels of debugging for each.
Examples
The following is sample output from the debug sccp events command:
Router# debug sccp events Skinny Client Control Protocol events debugging is on *Mar 1 00:46:29: sccp_create_application: send keepalive msg, appl 6248F760, appl_type 1, count 0 *Mar 1 00:46:29: sccp_keepalive: send keepalive id 0, len 4 *Mar 1 00:46:29: sccp_process_mtp_pdu: appl - 6248F760, mbuf - 6248F7D4 *Mar 1 00:46:29: sccp_process_mtp_pdu: msg_ptr 6248F7DC, len 4, offset 12, msg_id 256 *Mar 1 00:46:30: sccp_create_application: send keepalive msg, appl 6248FC10, appl_type 2, count 0 *Mar 1 00:46:30: sccp_keepalive: send keepalive id 0, len 4 *Mar 1 00:46:30: sccp_process_mtp_pdu: appl - 6248FC10, mbuf - 6248FC84 *Mar 1 00:46:30: sccp_process_mtp_pdu: msg_ptr 6248FC8C, len 4, offset 12, msg_id 256 *Mar 1 00:46:37: sccp_create_application: send keepalive msg, appl 6248F760, appl_type 1, count 0 *Mar 1 00:46:37: sccp_keepalive: send keepalive id 0, len 4 *Mar 1 00:46:37: sccp_process_mtp_pdu: appl - 6248F760, mbuf - 6248F7D4 *Mar 1 00:46:37: sccp_process_mtp_pdu: msg_ptr 6248F7DC, len 4, offset 12, msg_id 256 *Mar 1 00:46:37: sccp_create_application: send keepalive msg, appl 6248FC10, appl_type 2, count 0 *Mar 1 00:46:37: sccp_keepalive: send keepalive id 0, len 4 *Mar 1 00:46:38: sccp_process_mtp_pdu: appl - 6248FC10, mbuf - 6248FC84 *Mar 1 00:46:38: sccp_process_mtp_pdu: msg_ptr 6248FC8C, len 4, offset 12, msg_id 256 *Mar 1 00:46:43: sccp_process_mtp_pdu: appl - 6248FC10, mbuf - 6248FC84 *Mar 1 00:46:43: sccp_process_mtp_pdu: msg_ptr 6248FC8C, len 28, offset 36, msg_id 261 *Mar 1 00:46:43: xapp_open_receive_chnl: SCCP orc_msg - 6248FC8C, appl - 6248FC10 *Mar 1 00:46:43: xapp_search_for_chnl_rec: sess_id 27, conn_id 2769 *Mar 1 00:46:43: xapp_add_chnl_rec: chnl 631142BC *Mar 1 00:46:43: xapp_add_sess_rec: Add sess_rec (63114360) record *Mar 1 00:46:43: xapp_open_receive_chnl: stat 0, eve 0, sid 27, cid 2769, codec 1, pkt-period 20 *Mar 1 00:46:43: xapp_open_chnl_request: chnl_rec 631142BC *Mar 1 00:46:43: xapp_open_chnl_request: chnl_rec 631142BC, sess_id 27, conn_id 2769, cstate 0, nstate 1 *Mar 1 00:46:43: xapp_dequeue_and_process_dspf_events: chnl_rec 631142BC, state 1, eve_id 1 *Mar 1 00:46:43: xapp_open_chnl_success: chnl_rec 631142BC *Mar 1 00:46:43: xapp_open_chnl_success: chnl_rec 631142BC, sess_id 27, conn_id 2769, cstate 1, nstate 2, lc_ipaddr 10.10.1.1, lport 21066 *Mar 1 00:46:43: sccp_process_mtp_pdu: appl - 6248FC10, mbuf - 6248FC84 *Mar 1 00:46:43: sccp_process_mtp_pdu: msg_ptr 6248FC8C, len 28, offset 36, msg_id 261 *Mar 1 00:46:43: xapp_open_receive_chnl: SCCP orc_msg - 6248FC8C, appl - 6248FC10 *Mar 1 00:46:43: xapp_search_for_chnl_rec: sess_id 27, conn_id 2785 *Mar 1 00:46:43: xapp_add_chnl_rec: chnl 631142E4 *Mar 1 00:46:43: xapp_open_receive_chnl: stat 0, eve 0, sid 27, cid 2785, codec 1, pkt-period 20 *Mar 1 00:46:43: xapp_open_chnl_request: chnl_rec 631142E4 *Mar 1 00:46:43: xapp_open_chnl_request: chnl_rec 631142E4, sess_id 27, conn_id 2785, cstate 0, nstate 1 *Mar 1 00:46:43: xapp_dequeue_and_process_dspf_events: chnl_rec 631142E4, state 1, eve_id 1 *Mar 1 00:46:43: xapp_open_chnl_success: chnl_rec 631142E4 *Mar 1 00:46:43: xapp_open_chnl_success: chnl_rec 631142E4, sess_id 27, conn_id 2785, cstate 1, nstate 2, lc_ipaddr 10.10.1.1, lport 25706 *Mar 1 00:46:43: sccp_process_mtp_pdu: appl - 6248FC10, mbuf - 6248FC84 *Mar 1 00:46:43: sccp_process_mtp_pdu: msg_ptr 6248FC8C, len 44, offset 52, msg_id 138 *Mar 1 00:46:43: xapp_start_media_transmission: SCCP stmt_msg - 6248FC8C, appl - 6248FC10 *Mar 1 00:46:43: xapp_search_for_chnl_rec: sess_id 27, conn_id 2769 *Mar 1 00:46:43: xapp_start_media_transmission: chnl_rec 631142BC, stat 2, sid 27, cid 2769, ripaddr 10.10.1.5, rport 32148, codec 1, pkt-period 20, pre 11, silen 16777500, mfpp 1 *Mar 1 00:46:43: xapp_modify_chnl_request: chnl_rec 631142BC *Mar 1 00:46:43: xapp_modify_chnl_request: chnl_rec 631142BC, sess_id 27, conn_id 2769, cstate 2, nstate 2 *Mar 1 00:46:43: xapp_dequeue_and_process_dspf_events: chnl_rec 631142BC, state 2, eve_id 4 *Mar 1 00:46:43: xapp_modify_chnl_success: chnl_rec 631142BC, sess_id 27, conn_id 2769, cstate 2 *Mar 1 00:46:43: sccp_process_mtp_pdu: appl - 6248FC10, mbuf - 6248FC84 *Mar 1 00:46:43: sccp_process_mtp_pdu: msg_ptr 6248FC8C, len 44, offset 52, msg_id 138 *Mar 1 00:46:43: xapp_start_media_transmission: SCCP stmt_msg - 6248FC8C, appl - 6248FC10 *Mar 1 00:46:43: xapp_search_for_chnl_rec: sess_id 27, conn_id 2785 *Mar 1 00:46:43: xapp_start_media_transmission: chnl_rec 631142E4, stat 2, sid 27, cid 2785, ripaddr 10.10.1.7, rport 16422, codec 1, pkt-period 20, pre 11, silen 16777501, mfpp 1 *Mar 1 00:46:43: xapp_modify_chnl_request: chnl_rec 631142E4 *Mar 1 00:46:43: xapp_modify_chnl_request: chnl_rec 631142E4, sess_id 27, conn_id 2785, cstate 2, nstate 2 *Mar 1 00:46:43: xapp_dequeue_and_process_dspf_events: chnl_rec 631142E4, state 2, eve_id 4 *Mar 1 00:46:43: xapp_modify_chnl_success: chnl_rec 631142E4, sess_id 27, conn_id 2785, cstate 2 *Mar 1 00:46:44: sccp_create_application: send keepalive msg, appl 6248F760, appl_type 1, count 0 *Mar 1 00:46:44: sccp_keepalive: send keepalive id 0, len 4 *Mar 1 00:46:45: sccp_process_mtp_pdu: appl - 6248F760, mbuf - 6248F7D4 *Mar 1 00:46:45: sccp_process_mtp_pdu: msg_ptr 6248F7DC, len 4, offset 12, msg_id 256 *Mar 1 00:46:45: sccp_create_application: send keepalive msg, appl 6248FC10, appl_type 2, count 0 *Mar 1 00:46:45: sccp_keepalive: send keepalive id 0, len 4 *Mar 1 00:46:46: sccp_process_mtp_pdu: appl - 6248FC10, mbuf - 6248FC84 *Mar 1 00:46:46: sccp_process_mtp_pdu: msg_ptr 6248FC8C, len 4, offset 12, msg_id 256 *Mar 1 00:46:47: sccp_process_mtp_pdu: appl - 6248FC10, mbuf - 6248FC84 *Mar 1 00:46:47: sccp_process_mtp_pdu: msg_ptr 6248FC8C, len 28, offset 36, msg_id 261 *Mar 1 00:46:47: xapp_open_receive_chnl: SCCP orc_msg - 6248FC8C, appl - 6248FC10 *Mar 1 00:46:47: xapp_search_for_chnl_rec: sess_id 27, conn_id 2817 *Mar 1 00:46:47: xapp_add_chnl_rec: chnl 6311430C *Mar 1 00:46:47: xapp_open_receive_chnl: stat 0, eve 0, sid 27, cid 2817, codec 1, pkt-period 20 *Mar 1 00:46:47: xapp_open_chnl_request: chnl_rec 6311430C *Mar 1 00:46:47: xapp_open_chnl_request: chnl_rec 6311430C, sess_id 27, conn_id 2817, cstate 0, nstate 1 *Mar 1 00:46:47: xapp_dequeue_and_process_dspf_events: chnl_rec 6311430C, state 1, eve_id 1 *Mar 1 00:46:47: xapp_open_chnl_success: chnl_rec 6311430C *Mar 1 00:46:47: xapp_open_chnl_success: chnl_rec 6311430C, sess_id 27, conn_id 2817, cstate 1, nstate 2, lc_ipaddr 10.10.1.1, lport 16730 *Mar 1 00:46:47: sccp_process_mtp_pdu: appl - 6248FC10, mbuf - 6248FC84 *Mar 1 00:46:47: sccp_process_mtp_pdu: msg_ptr 6248FC8C, len 44, offset 52, msg_id 138 *Mar 1 00:46:47: xapp_start_media_transmission: SCCP stmt_msg - 6248FC8C, appl - 6248FC10 *Mar 1 00:46:47: xapp_search_for_chnl_rec: sess_id 27, conn_id 2817 *Mar 1 00:46:47: xapp_start_media_transmission: chnl_rec 6311430C, stat 2, sid 27, cid 2817, ripaddr 10.10.1.6, rport 18160, codec 1, pkt-period 20, pre 11, silen 16777502, mfpp 1 *Mar 1 00:46:47: xapp_modify_chnl_request: chnl_rec 6311430C *Mar 1 00:46:47: xapp_modify_chnl_request: chnl_rec 6311430C, sess_id 27, conn_id 2817, cstate 2, nstate 2 *Mar 1 00:46:47: xapp_dequeue_and_process_dspf_events: chnl_rec 6311430C, state 2, eve_id 4 *Mar 1 00:46:47: xapp_modify_chnl_success: chnl_rec 6311430C, sess_id 27, conn_id 2817, cstate 2 *Mar 1 00:46:52: sccp_create_application: send keepalive msg, appl 6248F760, appl_type 1, count 0 *Mar 1 00:46:52: sccp_keepalive: send keepalive id 0, len 4 *Mar 1 00:46:52: sccp_process_mtp_pdu: appl - 6248F760, mbuf - 6248F7D4 *Mar 1 00:46:52: sccp_process_mtp_pdu: msg_ptr 6248F7DC, len 4, offset 12, msg_id 256 *Mar 1 00:46:53: sccp_create_application: send keepalive msg, appl 6248FC10, appl_type 2, count 0 *Mar 1 00:46:53: sccp_keepalive: send keepalive id 0, len 4 *Mar 1 00:46:54: sccp_process_mtp_pdu: appl - 6248FC10, mbuf - 6248FC84 *Mar 1 00:46:54: sccp_process_mtp_pdu: msg_ptr 6248FC8C, len 4, offset 12, msg_id 256 *Mar 1 00:46:59: sccp_create_application: send keepalive msg, appl 6248F760, appl_type 1, count 0 *Mar 1 00:46:59: sccp_keepalive: send keepalive id 0, len 4 *Mar 1 00:47:00: sccp_process_mtp_pdu: appl - 6248F760, mbuf - 6248F7D4 *Mar 1 00:47:00: sccp_process_mtp_pdu: msg_ptr 6248F7DC, len 4, offset 12, msg_id 256 *Mar 1 00:47:01: sccp_create_application: send keepalive msg, appl 6248FC10, appl_type 2, count 0 *Mar 1 00:47:01: sccp_keepalive: send keepalive id 0, len 4 *Mar 1 00:47:01: sccp_process_mtp_pdu: appl - 6248FC10, mbuf - 6248FC84 *Mar 1 00:47:01: sccp_process_mtp_pdu: msg_ptr 6248FC8C, len 4, offset 12, msg_id 256 *Mar 1 00:47:07: sccp_create_application: send keepalive msg, appl 6248F760, appl_type 1, count 0 *Mar 1 00:47:07: sccp_keepalive: send keepalive id 0, len 4 *Mar 1 00:47:07: sccp_process_mtp_pdu: appl - 6248F760, mbuf - 6248F7D4 *Mar 1 00:47:07: sccp_process_mtp_pdu: msg_ptr 6248F7DC, len 4, offset 12, msg_id 256 *Mar 1 00:47:08: sccp_create_application: send keepalive msg, appl 6248FC10, appl_type 2, count 0 *Mar 1 00:47:08: sccp_keepalive: send keepalive id 0, len 4 *Mar 1 00:47:09: sccp_process_mtp_pdu: appl - 6248FC10, mbuf - 6248FC84 *Mar 1 00:47:09: sccp_process_mtp_pdu: msg_ptr 6248FC8C, len 4, offset 12, msg_id 256 *Mar 1 00:47:14: sccp_create_application: send keepalive msg, appl 6248F760, appl_type 1, count 0 *Mar 1 00:47:14: sccp_keepalive: send keepalive id 0, len 4 *Mar 1 00:47:15: sccp_process_mtp_pdu: appl - 6248F760, mbuf - 6248F7D4 *Mar 1 00:47:15: sccp_process_mtp_pdu: msg_ptr 6248F7DC, len 4, offset 12, msg_id 256 *Mar 1 00:47:16: sccp_create_application: send keepalive msg, appl 6248FC10, appl_type 2, count 0 *Mar 1 00:47:16: sccp_keepalive: send keepalive id 0, len 4 *Mar 1 00:47:16: sccp_process_mtp_pdu: appl - 6248FC10, mbuf - 6248FC84 *Mar 1 00:47:16: sccp_process_mtp_pdu: msg_ptr 6248FC8C, len 4, offset 12, msg_id 256 *Mar 1 00:47:22: sccp_create_application: send keepalive msg, appl 6248F760, appl_type 1, count 0 *Mar 1 00:47:22: sccp_keepalive: send keepalive id 0, len 4 *Mar 1 00:47:22: sccp_process_mtp_pdu: appl - 6248F760, mbuf - 6248F7D4 *Mar 1 00:47:22: sccp_process_mtp_pdu: msg_ptr 6248F7DC, len 4, offset 12, msg_id 256 *Mar 1 00:47:23: sccp_create_application: send keepalive msg, appl 6248FC10, appl_type 2, count 0 *Mar 1 00:47:23: sccp_keepalive: send keepalive id 0, len 4 *Mar 1 00:47:24: sccp_process_mtp_pdu: appl - 6248FC10, mbuf - 6248FC84 *Mar 1 00:47:24: sccp_process_mtp_pdu: msg_ptr 6248FC8C, len 4, offset 12, msg_id 256 *Mar 1 00:47:29: sccp_create_application: send keepalive msg, appl 6248F760, appl_type 1, count 0 *Mar 1 00:47:29: sccp_keepalive: send keepalive id 0, len 4 *Mar 1 00:47:30: sccp_process_mtp_pdu: appl - 6248F760, mbuf - 6248F7D4 *Mar 1 00:47:30: sccp_process_mtp_pdu: msg_ptr 6248F7DC, len 4, offset 12, msg_id 256 *Mar 1 00:47:31: sccp_create_application: send keepalive msg, appl 6248FC10, appl_type 2, count 0 *Mar 1 00:47:31: sccp_keepalive: send keepalive id 0, len 4 *Mar 1 00:47:31: sccp_process_mtp_pdu: appl - 6248FC10, mbuf - 6248FC84 *Mar 1 00:47:31: sccp_process_mtp_pdu: msg_ptr 6248FC8C, len 4, offset 12, msg_id 256debug sccp config
To enable Skinny Client Control Protocol (SCCP) event debugging, use the debug sccp config command in privileged EXEC mode. To disable debugging output, use the no form of this command.
debug sccp config { all | errors | events | parser }
no debug sccp config { all | errors | events | parser }
Examples
The following example shows the debug sccp config command used to enable SCCP event debugging and to display SCCP auto-configuration events:
Router# debug sccp config events
...
Feb  8 02:17:31.119: mp_auto_cfg_request(req_id=2, prof=995, ccm_group_id=0)
Feb  8 02:17:31.123: mp_auto_cfg_is_up: SCCP auto-config is enabled & registered
...
The table below describes the significant fields shown in the display.
debug qbm
To display debugging output for quality of service (QoS) bandwidth manager (QBM) options, use the debug qbm command in privileged EXEC mode. To disable debugging output, use the no form of this command.
Usage Guidelines
Use the debug qbm command to troubleshoot QBM behavior.
Examples of client requests are when a client creates or destroys a bandwidth pool and when a client attempts to admit bandwidth into a pool. An example of a notification is when a client’s previously admitted bandwidth gets preempted from a pool.
Examples
The following example shows how to enable the debug qbm apicommand:
Router# debug qbm api
QBM client requests and notifications debugging is on
The following example show how to enable the debug qbm eventscommand:
Router# debug qbm events
QBM pool events debugging is on
The following example shows how to verify that QBM debugging is enabled:
Router# show debug QoS Bandwidth Manager: QBM client requests and notifications debugging is on QBM pool events debugging is ondebug sdlc
To display information on Synchronous Data Link Control (SDLC) frames received and sent by any router serial interface involved in supporting SDLC end station functions, use the debug sdlc command in privileged EXEC mode. To disable debugging output, use the no form of this command.
Usage Guidelines
NoteBecause the debug sdlc command can generate many messages and alter timing in the network node, use it only when instructed by authorized support personnel.
Examples
The following is sample output from the debug sdlc command:
Router# debug sdlc
SDLC: Sending RR at location 4
Serial3: SDLC O (12495952) C2 CONNECT (2) RR P/F 6
Serial3: SDLC I (12495964) [C2] CONNECT (2) RR P/F 0 (R) [VR: 6 VS: 0]
Serial3: SDLC T [C2] 12496064 CONNECT 12496064 0
SDLC: Sending RR at location 4
Serial3: SDLC O (12496064) C2 CONNECT (2) RR P/F 6
Serial3: SDLC I (12496076) [C2] CONNECT (2) RR P/F 0 (R) [VR: 6 VS: 0]
Serial3: SDLC T [C2] 12496176 CONNECT 12496176 0
The following line of output indicates that the router is sending a Receiver Ready packet at location 4 in the code:
SDLC: Sending RR at location 4The following line of output describes a frame output event:
Serial1/0: SDLC O 04 CONNECT (285) IFRAME P/F 6The table below describes the significant fields shown in the display.
The following line of output describes a frame input event:
Serial1/0: SDLC I 02 CONNECT (16) IFRAME P 7 0,[VR: 7 VS: 0]The table below describes the significant fields shown in the display.
Table 4 debug sdlc Field Descriptions for a Frame Input Event Field
Description
02
SDLC address.
IFRAME
Traffic engineering type.
P
Poll bit P is on.
VR: 7
Receive count; range: 0 to 7.
VS: 0
Send count; range: 0 to 7.
The following line of output describes a frame timer event:
Serial1/0: SDLC T 02 CONNECT 0x9CB69E8 P 0The table below describes the significant fields shown in the display.
debug sdlc local-ack
To display information on the local acknowledgment feature, use the debug sdlc local-ack command in privileged EXEC mode. To disable debugging output, use the no form of this command.
Usage Guidelines
You can select the frame types you want to monitor; the frame types correspond to bit flags. You can select 1, 2, 4, or 7, which is the decimal value of the bit flag settings. If you select 1, the octet is set to 00000001. If you select 2, the octet is set to 0000010. If you select 4, the octet is set to 00000100. If you want to select all frame types, select 7; the octet is 00000111. The default is 7 for all events. The table below defines these bit flags.
Table 6 debug sdlc local-ack Debugging Levels Debug Command
Meaning
debug sdlc local-ack 1
Only U-Frame events
debug sdlc local-ack 2
Only I-Frame events
debug sdlc local-ack 4
Only S-Frame events
debug sdlc local-ack 7
All Synchronous Data Link Control (SDLC) Local-Ack events (default setting)
Caution
Because using this command is processor intensive, it is best to use it after hours, rather than in a production environment. It is also best to use this command by itself, rather than in conjunction with other debugging commands.
Examples
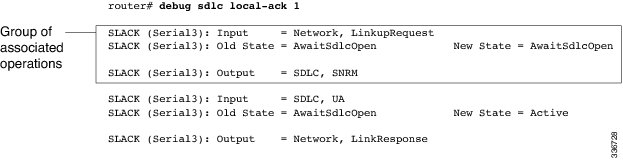
The following is sample output from the debug sdlc local-ack command:
The first line shows the input to the SDLC local acknowledgment state machine:
SLACK (Serial3): Input = Network, LinkupRequestThe table below describes the significant fields shown in the display.
Table 7 debug sdlc local-ack Field Descriptions Field
Description
SLACK
SDLC local acknowledgment feature is providing the information.
(Serial3):
Interface type and unit number reporting the event.
Input = Network
Source of the input.
LinkupRequest
Op code. A LinkupRequest is an example of possible values.
The second line shows the change in the SDLC local acknowledgment state machine. In this case the AwaitSdlcOpen state is an internal state that has not changed while this display was captured.
SLACK (Serial3): Old State = AwaitSdlcOpen New State = AwaitSdlcOpenThe third line shows the output from the SDLC local acknowledgment state machine:
SLACK (Serial3): Output = SDLC, SNRMdebug sdlc packet
To display packet information on Synchronous Data Link Control (SDLC) frames received and sent by any router serial interface involved in supporting SDLC end station functions, use the debug sdlc packet command in privileged EXEC mode. To disable debugging output, use the no form of this command.
Usage Guidelines
This command requires intensive CPU processing; therefore, we recommend not using it when the router is expected to handle normal network loads, such as in a production environment. Instead, use this command when network response is noncritical. We also recommend that you use this command by itself, rather than in conjunction with other debug commands.
Examples
The following is sample output from the debug sdlc packet command with the packet display limited to 20 bytes of data:
Router# debug sdlc packet 20
 Serial3 SDLC Output
00000 C3842C00 02010010 019000C5 C5C5C5C5 Cd.........EEEEE
00010 C5C5C5C5                            EEEE
 Serial3 SDLC Output
00000 C3962C00 02010011 039020F2          Co.........2
 Serial3 SDLC Output
00000 C4962C00 0201000C 039020F2          Do.........2
 Serial3 SDLC Input
00000     C491                              Dj
debug serial interface
To display information on a serial connection failure, use the debug serial interface command in privileged EXEC mode. To disable debugging output, use the no form of this command.
Usage Guidelines
If the show interface serial EXEC command shows that the line and protocol are down, you can use the debug serial interface command to isolate a timing problem as the cause of a connection failure. If the keepalive values in the mineseq, yourseen, and myseen fields are not incrementing in each subsequent line of output, there is a timing or line problem at one end of the connection.
Caution
Although the debug serial interface command typically does not generate a substantial amount of output, nevertheless use it cautiously during production hours. When Switched Multimegabit Data Service (SMDS) is enabled, for example, it can generate considerable output.
The output of the debug serial interface command can vary, depending on the type of WAN configured for an interface: Frame Relay, High-Level Data Link Control (HDL) , High-Speed Serial Interface ( HSSI), SMDS, or X.25. The output also can vary depending on the type of encapsulation configured for that interface. The hardware platform also can affect debug serial interface output.
Examples
The following sections show and describe sample debug serial interface output for various configurations.
Examples
The following me ssage is displayed if the encapsulation for the interface is Frame Relay (or HDLC) and the router attempts to send a packet containing an unknown packet type:
Illegal serial link type code xxxExamples
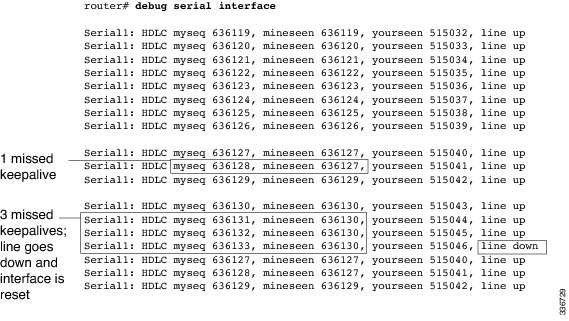
The following is sample output from the debug serial interface command for an HDLC connection when keepalives are enabled. This output shows that the remote router is not receiving all the keepalives the router is sending. When the difference in the values in the myseq and mineseen fields exceeds three, the line goes down and the interface is reset.
The table below describes the significant fields shown in the display.
Table 8 debug serial interface Field Descriptions for HDLC Field
Description
Serial 1
Interface through which the serial connection is taking place.
HDLC
Serial connection is an HDLC connection.
myseq 636119
Myseq counter increases by one each time the router sends a keepalive packet to the remote router.
mineseen 636119
Value of the mineseen counter reflects the last myseq sequence number the remote router has acknowledged receiving from the router. The remote router stores this value in its yourseen counter and sends that value in a keepalive packet to the router.
yourseen 515032
Yourseen counter reflects the value of the myseq sequence number the router has received in a keepalive packet from the remote router.
line up
Connection between the routers is maintained. Value changes to “line down” if the values of the myseq and myseen fields in a keepalive packet differ by more than three. Value returns to “line up” when the interface is reset. If the line is in loopback mode, (“looped”) appears after this field.
The table below describes additional error messages that the debug serial interface command can generate for HDLC.
Table 9 debug serial interface Error Messages for HDLC Field
Description
Illegal serial link type code <xxx>, PC = 0xnnnnnn
Router attempted to send a packet containing an unknown packet type.
Illegal HDLC serial type code <xxx>, PC = 0xnnnnn
Unknown packet type is received.
Serial 0: attempting to restart
Interface is down. The hardware is then reset to correct the problem, if possible.
Serial 0: Received bridge packet sent to <nnnnnnnnn>
Bridge packet is received over a serial interface configured for HDLC, and bridging is not configured on that interface.
Examples
On an HSSI interface, the debug serial interface command can generate the following additional error message:
HSSI0: Reset from 0x
nnnnnnn
This message indicates that the HSSI hardware has been reset. The 0xnnnnnnn variable is the address of the routine requesting that the hardware be reset; this value is useful only to development engineers.
Examples
The table below describes error mes sages that the debug serial interface command can generate for ISDN Basic Rate.
Table 10 debug serial interface Error Messages for ISDN Basic Rate Message
Description
BRI: D-chan collision
Collision on the ISDN D channel has occurred; the software will retry transmission.
Received SID Loss of Frame Alignment int.
ISDN hardware has lost frame alignment. This usually indicates a problem with the ISDN network.
Unexpected IMP int: ipr = 0xnn
ISDN hardware received an unexpected interrupt. The 0xnnvariable indicates the value returned by the interrupt register.
BRI(d): RX Frame Length Violation. Length=n
BRI(d): RX Nonoctet Aligned Frame
BRI(d): RX Abort Sequence
BRI(d): RX CRC Error
BRI(d): RX Overrun Error
BRI(d): RX Carrier Detect Lost
Any of these messages can be displayed when a receive error occurs on one of the ISDN channels. The (d) indicates which channel it is on. These messages can indicate a problem with the ISDN network connection.
BRI0: Reset from 0xnnnnnnn
BRI hardware has been reset. The 0xnnnnnnn variable is the address of the routine that requested that the hardware be reset; it is useful only to development engineers.
BRI(d): Bad state in SCMs scm1=xscm2=xscm3=x
BRI(d): Bad state in SCONs scon1=x scon2 =xscon3=x
BRI(d): Bad state ub SCR; SCR=x
Any of these messages can be displayed if the ISDN hardware is not in the proper state. The hardware is then reset. If the message is displayed constantly, it usually indicates a hardware problem.
BRI(d): Illegal packet encapsulation=n
Packet is received, but the encapsulation used for the packet is not recognized. The interface might be misconfigured.
Examples
The table below describes the additional error messa ges that the debug serial interface command can generate for an MK5025 device.
Table 11 debug serial interface Error Messages for an MK5025 Device Message
Description
MK5(d): Reset from 0xnnnnnnnn
Hardware has been reset. The 0xnnnnnnn variable is the address of the routine that requested that the hardware be reset; it is useful only to development engineers.
MK5(d): Illegal packet encapsulation=n
Packet is received, but the encapsulation used for the packet is not recognized. Interface might be misconfigured.
MK5(d): No packet available for packet realignment
Serial driver attempted to get a buffer (memory) and was unable to do so.
MK5(d): Bad state in CSR0=(x)
This message is displayed if the hardware is not in the proper state. The hardware is reset. If this message is displayed constantly, it usually indicates a hardware problem.
MK5(d): New serial state=n
Hardware has interrupted the software. It displays the state that the hardware is reporting.
MK5(d): DCD is down.
MK5(d): DCD is up.
If the interrupt indicates that the state of carrier has changed, one of these messages is displayed to indicate the current state of DCD.
Examples
When encapsulation is set to SMDS, the debug serial interface command dis plays SMDS packets that are sent and received, and any error messages resulting from SMDS packet transmission.
The error messages that the debug serial interface command can generate for SMDS follow.
The following message indicates that a new protocol requested SMDS to encapsulate the data for transmission. SMDS is not yet able to encapsulate the protocol.
SMDS: Error on Serial 0, encapsulation bad protocol =
x
The following message indicates that SMDS was asked to encapsulate a packet, but no corresponding destination E.164 SMDS address was found in any of the static SMDS tables or in the ARP tables:
SMDS send: Error in encapsulation, no hardware address, type =
x
The following message indicates that a protocol such as Connectionless Network Service (CLNS) or IP has been enabled on an SMDS interface, but the corresponding multicast addresses have not been configured. The n variable displays the link type for which encapsulation was requested.
SMDS: Send, Error in encapsulation, type=
n
The following messages can occur when a corrupted packet is received on an SMDS interface. The router expected x, but received y.
SMDS: Invalid packet, Reserved NOT ZERO,
x y
SMDS: Invalid packet, TAG mismatch
x y
SMDS: Invalid packet, Bad TRAILER length
x y
The following messages can indicate an invalid length for an SMDS packet:
SMDS: Invalid packet, Bad BA length
x
SMDS: Invalid packet, Bad header extension length
x
SMDS: Invalid packet, Bad header extension type
x
SMDS: Invalid packet, Bad header extension value
x
The following messages are displayed when the debug serial interface command is enabled:
Interface Serial 0 Sending SMDS L3 packet:
SMDS: dgsize:
x
 type:0
xn
 src:
y
 dst:
z
If the debug serial interface command is enabled, the following message can be displayed when a packet is received on an SMDS interface, but the destination SMDS address does not match any on that interface:
SMDS: Packet
n
, not addressed to us
debug serial lead-transition
To activate the leads status transition debug capability for all capable ports, use the debug serial lead-transitioncommand in privileged EXEC mode. To disable debugging output, use the no form of this command.
Command History
Release
Modification
Release 12.2(15)ZJ
This command was introduced on the following platforms: Cisco 2610XM, Cisco 2611XM, Cisco 2620XM, Cisco 2621XM, Cisco 2650XM, Cisco 2651XM, Cisco 2691, Cisco 3631, Cisco 3660, Cisco 3725, and Cisco 3745 routers.
Release 12.3(2)T
This command was integrated into Cisco IOS Release 12.3(2)T.
Usage Guidelines
To control which port is to be reported and therefore reduce the risk of flooding the console screen with debug information, enter the debug condition interface serial slot/portcommand after using the debug serial lead-transition command to set the condition.
Caution
To avoid having the debug message flood the console screen with debug information, use these commands only when traffic on the IP network is low, so other activity on the system is not adversely affected.
Examples
The following example shows the serial control leads reported for slot 1, port 1:
Router# debug serial lead-transition

Router# debug condition interface serial 1/1
*Mar  1 00:17:15.040:slot(1) Port(1):DSR/DTR is Deasserted
*Mar  1 00:17:15.040:slot(1) Port(1):CTS/RTS is Deasserted
*Mar  1 00:17:47.955:slot(1) Port(1):DCD/Local Loop is Deasserted
*Mar  1 00:17:47.955:slot(1) Port(1):DSR/DTR is Deasserted
*Mar  1 00:17:47.955:slot(1) Port(1):CTS/RTS is Deasserted
Router# no shut down serial 1/1
*Mar  1 00:16:52.298:slot(1) Port(1):DSR/DTR is Asserted
*Mar  1 00:16:52.298:slot(1) Port(1):CTS/RTS is Asserted
*Mar  1 00:16:31.648:slot(1) Port(1):DCD/Local Loop is Asserted
*Mar  1 00:16:31.648:slot(1) Port(1):DSR/DTR is Asserted
*Mar  1 00:16:31.648:slot(1) Port(1):CTS/RTS is Asserted
The table below describes significant fields shown in the displays.
Table 12 debug serial lead-transition Field Descriptions Field
Description
DSR/DTR is Asserted/Deasserted
The DSR or DTE signal is activated or inactivated.
CTS/RTS is Asserted/Deasserted
The CTS or RTS signal is activated or inactivated.
DCD/Local Loop is Asserted/Deasserted
The DCD or Local Loopback signal is activated or inactivated.
debug serial packet
To display more detailed serial interface debugging information than you can obtain using the debug serial interface command, use the debug serial packetcommand in privileged EXEC mode. To disable debugging output, use the no form of this command.
Usage Guidelines
The debug serial packet command generates output that is dependent on the type of serial interface and the encapsulation running on that interface. The hardware platform also can impact debug serial packet output.
The debug serial packet command displays output for only Switched Multimegabit Data Service (SMDS) encapsulations.
Examples
The following is sample output from the debug serial packet command when SM DS is enabled on the interface:
Router# debug serial packet
Interface Serial2 Sending SMDS L3 packet:
SMDS Header: Id: 00 RSVD: 00 BEtag: EC Basize: 0044
Dest:E18009999999FFFF Src:C12015804721FFFF Xh:04030000030001000000000000000000
SMDS LLC: AA AA 03 00 00 00 80 38
SMDS Data: E1 19 01 00 00 80 00 00 0C 00 38 1F 00 0A 00 80 00 00 0C 01 2B 71
SMDS Data: 06 01 01 0F 1E 24 00 EC 00 44 00 02 00 00 83 6C 7D 00 00 00 00 00
SMDS Trailer: RSVD: 00 BEtag: EC Length: 0044
As the output shows, when encapsulation is set to SMDS, the debug serial packet command displays the entire SMDS header (in hexadecimal notation), and some payload data on transmit or receive. This information is useful only when you have an understanding of the SMDS protocol. The first line of the output indicates either Sending or Receiving.
debug service-group
To enable debugging of service-group events and errors, use the debug service-group command in privileged EXEC mode. To disable debugging output, use the no form of this command.
debug service-group { all | error | feature | group | interface | ipc | member | qos | stats }
no debug service-group { all | error | feature | group | interface | ipc | member | qos | stats }
Syntax Description
all
All service-group debugging.
error
Service-group errors.
feature
Service-group features.
group
Service-group events.
interface
Service-group interface events.
ipc
Service-group Inter-Process Communication (IPC) messaging.
member
Service-group member events.
qos
Service-group Quality of Service (QoS).
stats
Service-group statistics.
debug service-module
To display debugging information that monitors the detection and clearing of network alarms on the integrated channel service unit/data service unit (CSU/DSU) modules, use the debug service-module command in privileged EXEC mode. To disable debugging output, use the no form of this command.
Usage Guidelines
Use this command to enable and disable debug logging for the serial 0 and serial 1 interfaces when an integrated CSU/DSU is present. This command enables debugging on all interfaces.
Network alarm status can also be viewed through the use of the show service-module command.
NoteThe debug output varies depending on the type of service module installed in the router.
Examples
The following is sample output from the debug service-module command:
Router# debug service-module
SERVICE_MODULE(1): loss of signal ended after duration 00:05:36
SERVICE_MODULE(1): oos/oof ended after duration 01:05:14
SERVICE_MODULE(0): Unit has no clock
SERVICE_MODULE(0): detects loss of signal
SERVICE_MODULE(0): loss of signal ended after duration 00:00:33
debug sgbp dial-bids
To display large-scale dial-out negotiations between the primary network access server (NAS) and alternate NASs, use the debug sgbp dial-bids command in privileged EXEC mode. To disable debugging output, use the no form of this command.
Examples
The following is sample output from the debug sgbp dial-bidscommand:
Router# debug sgbp dial-bids
*Jan  1 00:25:03.643: SGBP-RES:  New bid add request: 4B0 8 2 1 DAC0 1 1
This indicates a new dialout bid has started
.
*Jan  1 00:25:03.643: SGBP-RES: Sent Discover message to ID 7B09B71E  49 bytes
The bid request has been sent
.
*Jan  1 00:25:03.647: SGBP-RES: Received Message of 49 length:

*Jan  1 00:25:03.647: SGBP-RES: header 5  30  0  31
2  0  0  2D  0  0  0  0  0  0  0  3  0  0  0  1  1E  AF  3A  41  7B  9  B7  1E  8  15  B  3  2  C  6  0  0  DA  C0  D  4  0  0  E  3  1  F  3  1
*Jan  1 00:25:03.647:
*Jan  1 00:25:03.647: SGBP RES: Scan: Message type: Offer
*Jan  1 00:25:03.647: SGBP RES: Scan: Len is 45
*Jan  1 00:25:03.647: SGBP RES: Scan: Transaction ID: 3
*Jan  1 00:25:03.647: SGBP RES: Scan: Message ID: 1
*Jan  1 00:25:03.647: SGBP RES: Scan: Client ID: 1EAF3A41
*Jan  1 00:25:03.651: SGBP RES: Scan: Server ID: 7B09B71E
*Jan  1 00:25:03.651: SGBP RES: Scan: Resource type 8  length 21
*Jan  1 00:25:03.651: SGBP RES: Scan: Phy-Port Media type: ISDN
*Jan  1 00:25:03.651: SGBP RES: Scan: Phy-Port Min BW: 56000
*Jan  1 00:25:03.651: SGBP RES: Scan: Phy-Port Num Links: 0
*Jan  1 00:25:03.651: SGBP RES: Scan: Phy-Port User class: 1
*Jan  1 00:25:03.651: SGBP RES: Scan: Phy-Port Priority: 1
*Jan  1 00:25:03.651: SGBP-RES: received 45 length Offer packet
*Jan  1 00:25:03.651: SGBP-RES: Offer from 7B09B71E for Transaction 3 accepted
*Jan  1 00:25:03.651: SGBP RES: Server is uncongested. Immediate win
An alternate network access server has responded and won the bid
.
*Jan  1 00:25:03.651: SGBP-RES: Bid Succeeded  handle 7B09B71E  Server-id 4B0
*Jan  1 00:25:03.651: SGBP-RES: Sent Dial-Req message to ID 7B09B71E  66 bytes
The primary network access server has asked the alternate server to dial.
*Jan  1 00:25:04.651: SGBP-RES: QScan: Purging entry
*Jan  1 00:25:04.651: SGBP-RES: deleting entry 6112E204 1EAF3A41 from list...
debug sgbp error
To display debugging messages about routing problems between members of a stack group, use the debug sgbp errorcommand in privileged EXEC mode. To disable debugging output, use the no form of this command.
Usage Guidelines
Enter the debug sgbp errorcommand to enable the display of debugging messages about routing problems between members of a stack group.
NoteIn unusual cases you may see debugging messages that are not documented on this command reference page. These debugging messages are intended for expert diagnostic interpretation by the Cisco Technical Assistance Center (TAC).
Examples
One common configuration error is setting a source IP address for a stack member that does not match the locally defined IP address for the same stack member. The following debugging output shows the error message that results from this misconfiguration:
Systema# debug sgbp error

%SGBP-7-DIFFERENT - systemb's addr 10.1.1.2 is different from hello's addr 10.3.4.5
This error means that the source IP address of the Stack Group Bidding Protocol (SGBP) hello message received from systemb does not match the IP address configured locally for systemb (through the sgbp member command). Correct this configuration error by going to systemb and checking for multiple interfaces by which the SGBP hello can send the message.
Another common error message is:
Systema# debug sgbp error

%SGBP-7-MISCONF, Possible misconfigured member routerk (10.1.1.6)
This error message means that routerk is not defined locally, but is defined on another stack member. Correct this configuration error by defining routerk across all members of the stack group using the sgbp membercommand.
The following error message indicates that an SGBP peer is leaving the stack group:
Systema# debug sgbp error

%SGBP-7-LEAVING:Member systemc leaving group stack1
This error message indicates that the peer systemc is leaving the stack group. Systemc could be leaving the stack group intentionally, or a connectivity problem may exist.
The following error message indicates that an SGBP event was detected from an unknown peer:
Systema# debug sgbp error

%SGBP-7-UNKNOWPEER:Event 0x10 from peer at 172.21.54.3
An SGBP event came from a network host that was not recognizable as an SGBP peer. Check to see if a network media error could have corrupted the address, or if peer equipment is malfunctioning to generate corrupted packets. Depending on the network topology and firewall of your network, SGBP packets from a nonpeer host could indicate probing and attempts to breach security.
NoteIf there is a chance your network is under attack, obtain knowledgeable assistance from TAC.
Related Commands
Command
Description
debug sgbp hellos
Displays debugging messages for authentication between stack group members.
sgbp group
Defines a named stack group and makes this router a member of that stack group.
sgbp member
Specifies the hostname and IP address of a router or access server that is a peer member of a stack group.
show sgbp
Displays the status of the stack group members.
username
Establishes a username-based authentication system.
debug sgbp hellos
To display debugging messages for authentication between stack members, use the debug sgbp helloscommand in privileged EXEC mode. To disable debugging output, use the no form of this command.
Usage Guidelines
Use the debug sgbp helloscommand to enable the display of debugging messages for authentication between routers configured as members of a stack group.
NoteIn unusual cases you may see debugging messages that are not documented on this command reference page. These debugging messages are intended for expert diagnostic interpretation by the Cisco Technical Assistance Center (TAC).
Examples
The following output from the debug sgbp hellos command shows systema sending a successful Challenge Handshake Authentication Protocol (CHAP) challenge to and receiving a response from systemb. Similarly, systemb sends out a challenge and receives a response from systema.
systema# debug sgbp hellos

%SGBP-7-CHALLENGE: Send Hello Challenge to systemb group stack1
%SGBP-7-CHALLENGED: Hello Challenge message from member systemb (10.1.1.2)
%SGBP-7-RESPONSE: Send Hello Response to systemb group stack1
%SGBP-7-CHALLENGE: Send Hello Challenge to systemb group stack1
%SGBP-7-RESPONDED: Hello Response message from member systemb (10.1.1.2)
%SGBP-7-AUTHOK: Send Hello Authentication OK to member systemb (10.1.1.2)
%SGBP-7-INFO: Addr = 10.1.1.2 Reference = 0xC347DF7
%SGBP-5-ARRIVING: New peer event for member systemb
This debug output is self-explanatory.
If authentication fails, you may see one of the following messages in your debug output:
%SGBP-7-AUTHFAILED - Member systemb failed authenticationThis error message means that the remote systemb password for the stack group does not match the password defined on systema. To correct this error, make sure that both systema and systemb have the same password defined using the username command.
%SGBP-7-NORESP -Fail to respond to systemb group stack1, may not have password.This error message means that systema does not have a username or password defined. To correct this error, define a common group password across all stack members using the usernamecommand.
Related Commands
Command
Description
debug sgbp error
Displays debugging messages about routing problems between members of a stack group.
sgbp group
Defines a named stack group and makes this router a member of that stack group.
sgbp member
Specifies the hostname and IP address of a router or access server that is a peer member of a stack group.
show sgbp
Displays the status of the stack group members.
username
Establishes a username-based authentication system.
debug sgcp
To debug the Simple Gateway Control Protocol (SGCP), use the debug sgcpcommand in privileged EXEC mode. To disable debugging output, use the no form of this command.
Examples
See the following examples to enable and disable debugging at the specified level:
Router# debug sgcp errors Simple Gateway Control Protocol errors debugging is on Router# no debug sgcp errors Simple Gateway Control Protocol errors debugging is off Router# Router# debug sgcp events Simple Gateway Control Protocol events debugging is on Router# no debug sgcp events Simple Gateway Control Protocol events debugging is off Router# Router# debug sgcp packet Simple Gateway Control Protocol packets debugging is on Router# no debug sgcp packet Simple Gateway Control Protocol packets debugging is off Router#debug sgcp errors
To debug Simple Gateway Control Protocol (SGCP) errors, use the debug sgcp errors command in privileged EXEC mode. To disable debugging output, use the no form of this command.
Syntax Description
Command History
Release
Modification
12.0(5)T
This command was introduced on the Cisco AS5300 access server in a private release that was not generally available.
12.0(7)XK
Support for this command was extended to the Cisco MC3810 and the Cisco 3600 series routers (except for the Cisco 3620). Also, the endpoint keyword was added.
Examples
The following example shows the debugging of SGCP errors being enabled:
Router# debug sgcp errors
Simple Gateway Control Protocol errors debugging is on
no errors since call went through successfully.
The following example shows a debug trace for SGCP errors on a specific endpoint:
Router# debug sgcp errors endpoint DS1-0/1
End point name for error debug:DS1-0/1 (1)
00:08:41:DS1 = 0, DS0 = 1
00:08:41:Call record found
00:08:41:Enable error end point debug for (DS1-0/1)
Related Commands
Command
Description
debug rtpspi all
Debugs all RTP SPI errors, sessions, and in/out functions.
debug rtpspi errors
Debugs RTP SPI errors.
debug rtpspi inout
Debugs RTP SPI in/out functions.
debug rtpspi send-nse
Triggers the RTP SPI to send a triple redundant NSE.
debug sgcp events
Debugs SGCP events.
debug sgcp packet
Debugs SGCP packets.
debug vtsp send-nse
Sends and debugs a triple redundant NSE from the DSP to a remote gateway.
debug sgcp events
To debug Simple Gateway Control Protocol (SGCP) events, use the debug sgcp events command in privileged EXEC mode. To disable debugging output, use the no form of this command.
Syntax Description
Command History
Release
Modification
12.0(5)T
This command was introduced on the Cisco AS5300 access server in a private release that was not generally available.
12.0(7)XK
Support for this command was extended to the Cisco MC3810 and the Cisco 3600 series routers (except for the Cisco 3620 router). Also, the endpoint keyword was added.
Examples
The following example shows a debug trace for SGCP events on a specific endpoint:
Router# debug sgcp events endpoint DS1-0/1
End point name for event debug:DS1-0/1 (1)
00:08:54:DS1 = 0, DS0 = 1
00:08:54:Call record found
00:08:54:Enable event end point debug for (DS1-0/1)
The following example shows a debug trace for all SGCP events on a gateway:
Router# debug sgcp events
*Mar  1 01:13:31.035:callp :19196BC, state :0, call ID :-1, event :23
*Mar  1 01:13:31.035:voice_if->call_agent_ipaddr used as Notify entityNotify entity available for Tx SGCP msg
NTFY send to ipaddr=1092E01 port=2427
*Mar  1 01:13:31.039:Push msg into SGCP wait ack queue* (1)[25]
*Mar  1 01:13:31.039:Timed Out interval [1]:(2000)
*Mar  1 01:13:31.039:Timed Out interval [1]:(2000)(0):E[25]
*Mar  1 01:13:31.075:Removing msg :
NTFY 25 ds1-1/13@mc1 SGCP 1.1
X:358258758
O:hd
*Mar  1 01:13:31.075:Unqueue msg from SGCP wait ack q** (0)[25]DS1 = 1, DS0 = 13
*Mar  1 01:13:31.091:callp :19196BC, vdbptr :1964EEC, state :1
*Mar  1 01:13:31.091:Checking ack (trans ID 237740140) :
*Mar  1 01:13:31.091:is_capability_ok:caps.codec=5, caps.pkt=10, caps.nt=8
*Mar  1 01:13:31.091:is_capability_ok:supported signal=0x426C079C, signal2=0x80003,
                        event=0x6003421F, event2=0x3FD
requested signal=0x0, signal2=0x0,
                        event=0x20000004, event2=0xC
*Mar  1 01:13:31.091:Same digit map is download (ds1-1/13@mc1)
*Mar  1 01:13:31.091:R:requested trans_id (237740140)
*Mar  1 01:13:31.091:process_signal_ev:seizure possible=1, signal mask=0x4, mask2=0x0
*Mar  1 01:13:32.405:SGCP Session Appl:ignore CCAPI event 10
*Mar  1 01:13:32.489:callp :19196BC, state :1, call ID :16, event :9
*Mar  1 01:13:32.610:SGCP Session Appl:ignore CCAPI event 10
*Mar  1 01:13:32.670:callp :19196BC, state :1, call ID :16, event :9
*Mar  1 01:13:32.766:SGCP Session Appl:ignore CCAPI event 10
*Mar  1 01:13:32.810:callp :19196BC, state :1, call ID :16, event :9
*Mar  1 01:13:32.931:SGCP Session Appl:ignore CCAPI event 10
*Mar  1 01:13:32.967:callp :19196BC, state :1, call ID :16, event :9
*Mar  1 01:13:33.087:SGCP Session Appl:ignore CCAPI event 10
*Mar  1 01:13:33.132:callp :19196BC, state :1, call ID :16, event :9
*Mar  1 01:13:33.240:SGCP Session Appl:ignore CCAPI event 10
*Mar  1 01:13:33.280:callp :19196BC, state :1, call ID :16, event :9
*Mar  1 01:13:33.389:SGCP Session Appl:ignore CCAPI event 10
*Mar  1 01:13:33.433:callp :19196BC, state :1, call ID :16, event :9
*Mar  1 01:13:33.537:SGCP Session Appl:ignore CCAPI event 10
*Mar  1 01:13:33.581:callp :19196BC, state :1, call ID :16, event :9
*Mar  1 01:13:33.702:SGCP Session Appl:ignore CCAPI event 10
*Mar  1 01:13:33.742:callp :19196BC, state :1, call ID :16, event :9
*Mar  1 01:13:33.742:voice_if->call_agent_ipaddr used as Notify entityNotify entity available for Tx SGCP msg
NTFY send to ipaddr=1092E01 port=2427
*Mar  1 01:13:33.742:Push msg into SGCP wait ack queue* (1)[26]
*Mar  1 01:13:33.742:Timed Out interval [1]:(2000)
*Mar  1 01:13:33.742:Timed Out interval [1]:(2000)(0):E[26]
*Mar  1 01:13:33.786:Removing msg :
NTFY 26 ds1-1/13@mc1 SGCP 1.1
X:440842371
O:k0, 4081037, s0
*Mar  1 01:13:33.786:Unqueue msg from SGCP wait ack q** (0)[26]DS1 = 1, DS0 = 13
*Mar  1 01:13:33.802:callp :19196BC, vdbptr :1964EEC, state :1
*Mar  1 01:13:33.802:Checking ack (trans ID 698549528) :
*Mar  1 01:13:33.802:is_capability_ok:caps.codec=5, caps.pkt=10, caps.nt=8
*Mar  1 01:13:33.802:is_capability_ok:supported signal=0x426C079C, signal2=0x80003,
                        event=0x6003421F, event2=0x3FD
requested signal=0x0, signal2=0x0,
                        event=0x4, event2=0x0
*Mar  1 01:13:33.802:R:requested trans_id (698549528)
*Mar  1 01:13:33.802:set_up_voip_call_leg:peer_addr=0, peer_port=0.
*Mar  1 01:13:33.806:call_setting_crcx:Enter CallProceeding state rc = 0, call_id=16
*Mar  1 01:13:33.806:callp :19196BC, state :4, call ID :16, event :31
*Mar  1 01:13:33.810:callp :1AF5798, state :2, call ID :17, event :8
call_pre_bridge!
*Mar  1 01:13:33.810:send_oc_create_ack:seizure_possiblle=1, ack-lready-sent=0, ack_send=0
*Mar  1 01:13:33.814:callp :1AF5798, state :4, call ID :17, event :28
*Mar  1 01:13:33.814:Call Connect:Raw Msg ptr=0x1995360, no-offhook=0; call-id=17
*Mar  1 01:13:33.814:SGCP Session Appl:ignore CCAPI event 37
*Mar  1 01:13:33.947:callp :19196BC, state :5, call ID :16, event :32
process_nse_on_orig
DS1 = 1, DS0 = 13
*Mar  1 01:13:34.007:callp :19196BC, vdbptr :1964EEC, state :5
*Mar  1 01:13:34.007:Checking ack (trans ID 123764791) :
*Mar  1 01:13:34.007:is_capability_ok:caps.codec=5, caps.pkt=10, caps.nt=8
*Mar  1 01:13:34.007:is_capability_ok:supported signal=0x426C079C, signal2=0x80003,
                        event=0x6003421F, event2=0x3FD
requested signal=0x0, signal2=0x0,
                        event=0x4, event2=0x0
*Mar  1 01:13:34.007:R:requested trans_id (123764791)
*Mar  1 01:13:34.007:process_signal_ev:seizure possible=1, signal mask=0x0, mask2=0x0
*Mar  1 01:13:34.007:modify_connection:echo_cancel=1.
*Mar  1 01:13:34.007:modify_connection:vad=0.
*Mar  1 01:13:34.007:modify_connection:peer_addr=6000001, peer_port=0->16500.
*Mar  1 01:13:34.007:modify_connection:conn_mode=2.
*Mar  1 01:13:34.011:callp :19196BC, state :5, call ID :16, event :31
*Mar  1 01:13:34.011:callp :1AF5798, state :5, call ID :17, event :31
process_nse_event
*Mar  1 01:13:34.051:callp :19196BC, state :5, call ID :16, event :39
*Mar  1 01:13:34.051:call_id=16, ignore_ccapi_ev:ignore 19 for state 5
DS1 = 1, DS0 = 13
*Mar  1 01:13:39.497:callp :19196BC, vdbptr :1964EEC, state :5
*Mar  1 01:13:39.497:Checking ack (trans ID 553892443) :
*Mar  1 01:13:39.497:is_capability_ok:caps.codec=5, caps.pkt=10, caps.nt=8
*Mar  1 01:13:39.497:is_capability_ok:supported signal=0x426C079C, signal2=0x80003,
                        event=0x6003421F, event2=0x3FD
requested signal=0x8, signal2=0x0,
                        event=0x4, event2=0x0
*Mar  1 01:13:39.497:R:requested trans_id (553892443)
*Mar  1 01:13:39.497:process_signal_ev:seizure possible=1, signal mask=0x0, mask2=0x0
*Mar  1 01:13:39.497:modify_connection:echo_cancel=1.
*Mar  1 01:13:39.497:modify_connection:vad=0.
*Mar  1 01:13:39.497:modify_connection:peer_addr=6000001, peer_port=16500->16500.
*Mar  1 01:13:39.497:modify_connection:conn_mode=3.
*Mar  1 01:13:39.497:callp :19196BC, state :5, call ID :16, event :31
*Mar  1 01:13:39.501:callp :1AF5798, state :5, call ID :17, event :31
*Mar  1 01:14:01.168:Removing ack (trans ID 237740140) :
 200 237740140 OK
*Mar  1 01:14:03.883:Removing ack (trans ID 698549528) :
 200 698549528 OK
I:7
v=0
c=IN IP4 5.0.0.1
m=audio 16400 RTP/AVP 0
*Mar  1 01:14:04.087:Removing ack (trans ID 123764791) :
 200 123764791 OK
I:7
v=0
c=IN IP4 5.0.0.1
m=audio 16400 RTP/AVP 0
*Mar  1 01:14:09.573:Removing ack (trans ID 553892443) :
 200 553892443 OK
I:7
v=0
c=IN IP4 5.0.0.1
m=audio 16400 RTP/AVP 0
*Mar  1 01:14:48.091:callp :19196BC, state :5, call ID :16, event :12
*Mar  1 01:14:48.091:voice_if->call_agent_ipaddr used as Notify entityNotify entity available for Tx SGCP msg
NTFY send to ipaddr=1092E01 port=2427
*Mar  1 01:14:48.091:Push msg into SGCP wait ack queue* (1)[27]
*Mar  1 01:14:48.091:Timed Out interval [1]:(2000)
*Mar  1 01:14:48.091:Timed Out interval [1]:(2000)(0):E[27]
*Mar  1 01:14:48.128:Removing msg :
NTFY 27 ds1-1/13@mc1 SGCP 1.1
X:97849341
O:hu
*Mar  1 01:14:48.128:Unqueue msg from SGCP wait ack q** (0)[27]DS1 = 1, DS0 = 13
*Mar  1 01:14:48.212:callp :19196BC, vdbptr :1964EEC, state :5
*Mar  1 01:14:48.212:Checking ack (trans ID 79307869) :
*Mar  1 01:14:48.212:is_capability_ok:caps.codec=5, caps.pkt=10, caps.nt=8
*Mar  1 01:14:48.212:is_capability_ok:supported signal=0x426C079C, signal2=0x80003,
                        event=0x6003421F, event2=0x3FD
requested signal=0x4, signal2=0x0,
                        event=0x0, event2=0x0
*Mar  1 01:14:48.212:delete_call:callp:19196BC, call ID:16
*Mar  1 01:14:48.212:sgcp delete_call:Setting disconnect_by_dlcx to 1
*Mar  1 01:14:48.216:callp :1AF5798, state :6, call ID :17, event :29
*Mar  1 01:14:48.216:Call disconnect:Raw Msg ptr = 0x0, call-id=17
*Mar  1 01:14:48.216:disconnect_call_leg O.K. call_id=17
*Mar  1 01:14:48.216:SGCP:Call disconnect:No need to send onhook
*Mar  1 01:14:48.216:Call disconnect:Raw Msg ptr = 0x19953B0, call-id=16
*Mar  1 01:14:48.216:disconnect_call_leg O.K. call_id=16
*Mar  1 01:14:48.220:callp :1AF5798, state :7, call ID :17, event :13
*Mar  1 01:14:48.220:Processing DLCX signal request :4, 0, 0
*Mar  1 01:14:48.220:call_disconnected:call_id=17, peer 16 is not idle yet.DS1 = 1, DS0 = 13
*Mar  1 01:14:48.272:callp :19196BC, vdbptr :1964EEC, state :7
*Mar  1 01:14:48.272:Checking ack (trans ID 75540355) :
*Mar  1 01:14:48.272:is_capability_ok:caps.codec=5, caps.pkt=10, caps.nt=8
*Mar  1 01:14:48.272:is_capability_ok:supported signal=0x426C079C, signal2=0x80003,
                        event=0x6003421F, event2=0x3FD
requested signal=0x0, signal2=0x0,
                        event=0x8, event2=0x0
*Mar  1 01:14:48.272:R:requested trans_id (75540355)
*Mar  1 01:14:48.272:process_signal_ev:seizure possible=1, signal mask=0x4, mask2=0x0
*Mar  1 01:14:49.043:callp :19196BC, state :7, call ID :16, event :27
*Mar  1 01:14:49.043:process_call_feature:Onhook event
*Mar  1 01:14:49.043:callp :19196BC, state :7, call ID :16, event :13
*Mar  1 01:15:18.288:Removing ack (trans ID 79307869) :
 250 79307869 OK
*Mar  1 01:15:18.344:Removing ack (trans ID 75540355) :
 200 75540355 OK
Related Commands
Command
Description
debug rtpspi all
Debugs all RTP SPI errors, sessions, and in/out functions.
debug rtpspi errors
Debugs RTP SPI errors.
debug rtpspi inout
Debugs RTP SPI in/out functions.
debug rtpspi send-nse
Triggers the RTP SPI to send a triple redundant NSE.
debug sgcp errors
Debugs SGCP errors.
debug sgcp packet
Debugs SGCP packets.
debug vtsp send-nse
Sends and debugs a triple redundant NSE from the DSP to a remote gateway.
debug sgcp packet
To debug the Simple Gateway Control Protocol (SGCP), use the debug sgcp packet command in privileged EXEC mode. To disable debugging output, use the no form of this command.
Syntax Description
Command History
Release
Modification
12.0(5)T
This command was introduced on the Cisco AS5300 in a private release that was not generally available.
12.0(7)XK
Support for this command was extended to the Cisco MC3810 and the Cisco 3600 series routers (except for the Cisco 3620). Also, the endpoint keyword was added.
Examples
The following example shows a debug trace for SGCP packets on a specific endpoint:
Router# debug sgcp packet endpoint DS1-0/1 End point name for packet debug:DS1-0/1 (1)
00:08:14:DS1 = 0, DS0 = 1
00:08:14:Enable packet end point debug for (DS1-0/1)
The following example shows a debug trace for all SGCP packets on a gateway:
Router# debug sgcp packet
*Mar  1 01:07:45.204:SUCCESS:Request ID string building is OK
*Mar  1 01:07:45.204:SUCCESS:Building SGCP Parameter lines is OK
*Mar  1 01:07:45.204:SUCCESS:SGCP message building OK
*Mar  1 01:07:45.204:SUCCESS:END of building
*Mar  1 01:07:45.204:SGCP Packet sent --->
NTFY 22 ds1-1/13@mc1 SGCP 1.1
X:550092018
O:hd
<---
*Mar  1 01:07:45.204:NTFY Packet sent successfully.
*Mar  1 01:07:45.240:Packet received -
200 22
*Mar  1 01:07:45.244:SUCCESS:SGCP Header parsing was OK
*Mar  1 01:07:45.244:SUCCESS:END of Parsing
*Mar  1 01:07:45.256:Packet received -
RQNT 180932866 ds1-1/13@mc1 SGCP 1.1
X:362716780
R:hu,k0(A),s0(N),[0-9T](A) (D)
D:(9xx|xxxxxxx)
*Mar  1 01:07:45.256:SUCCESS:SGCP Header parsing was OK
*Mar  1 01:07:45.256:SUCCESS:Request ID string(362716780) parsing is OK
*Mar  1 01:07:45.260:SUCCESS:Requested Event parsing is OK
*Mar  1 01:07:45.260:SUCCESS:Digit Map parsing is OK
*Mar  1 01:07:45.260:SUCCESS:END of Parsing
*Mar  1 01:07:45.260:SUCCESS:SGCP message building OK
*Mar  1 01:07:45.260:SUCCESS:END of building
*Mar  1 01:07:45.260:SGCP Packet sent --->
200 180932866 OK
<---
*Mar  1 01:07:47.915:SUCCESS:Request ID string building is OK
*Mar  1 01:07:47.915:SUCCESS:Building SGCP Parameter lines is OK
*Mar  1 01:07:47.919:SUCCESS:SGCP message building OK
*Mar  1 01:07:47.919:SUCCESS:END of building
*Mar  1 01:07:47.919:SGCP Packet sent --->
NTFY 23 ds1-1/13@mc1 SGCP 1.1
X:362716780
O:k0, 4081037, s0
<---
*Mar  1 01:07:47.919:NTFY Packet sent successfully.
*Mar  1 01:07:47.955:Packet received -
200 23
*Mar  1 01:07:47.955:SUCCESS:SGCP Header parsing was OK
*Mar  1 01:07:47.955:SUCCESS:END of Parsing
*Mar  1 01:07:47.971:Packet received -
CRCX 938694984 ds1-1/13@mc1 SGCP 1.1
M:recvonly
L:p:10,e:on,s:off, a:G.711u
R:hu
C:6
*Mar  1 01:07:47.971:SUCCESS:SGCP Header parsing was OK
*Mar  1 01:07:47.971:SUCCESS:Connection Mode parsing is OK
*Mar  1 01:07:47.971:SUCCESS:Packet period parsing is OK
*Mar  1 01:07:47.971:SUCCESS:Echo Cancellation parsing is OK
*Mar  1 01:07:47.971:SUCCESS:Silence Supression parsing is OK
*Mar  1 01:07:47.971:SUCCESS:CODEC strings parsing is OK
*Mar  1 01:07:47.971:SUCCESS:Local Connection option parsing is OK
*Mar  1 01:07:47.971:SUCCESS:Requested Event parsing is OK
*Mar  1 01:07:47.975:SUCCESS:Call ID string(6) parsing is OK
*Mar  1 01:07:47.975:SUCCESS:END of Parsing
*Mar  1 01:07:47.979:SUCCESS:Conn ID string building is OK
*Mar  1 01:07:47.979:SUCCESS:Building SGCP Parameter lines is OK
*Mar  1 01:07:47.979:SUCCESS:SGCP message building OK
*Mar  1 01:07:47.979:SUCCESS:END of building
*Mar  1 01:07:47.979:SGCP Packet sent --->
200 938694984 OK
I:6
v=0
c=IN IP4 5.0.0.1
m=audio 16538 RTP/AVP 0
<---
*Mar  1 01:07:48.188:Packet received -
MDCX 779665338 ds1-1/13@mc1 SGCP 1.1
I:6
M:recvonly
L:p:10,e:on,s:off,a:G.711u
R:hu
C:6
v=0
c=IN IP4 6.0.0.1
m=audio 16392 RTP/AVP 0
*Mar  1 01:07:48.188:SUCCESS:SGCP Header parsing was OK
*Mar  1 01:07:48.188:SUCCESS:Conn ID string(6) parsing is OK
*Mar  1 01:07:48.192:SUCCESS:Connection Mode parsing is OK
*Mar  1 01:07:48.192:SUCCESS:Packet period parsing is OK
*Mar  1 01:07:48.192:SUCCESS:Echo Cancellation parsing is OK
*Mar  1 01:07:48.192:SUCCESS:Silence Supression parsing is OK
*Mar  1 01:07:48.192:SUCCESS:CODEC strings parsing is OK
*Mar  1 01:07:48.192:SUCCESS:Local Connection option parsing is OK
*Mar  1 01:07:48.192:SUCCESS:Requested Event parsing is OK
*Mar  1 01:07:48.192:SUCCESS:Call ID string(6) parsing is OK
*Mar  1 01:07:48.192:SUCCESS:SDP Protocol version parsing OK
*Mar  1 01:07:48.192:SUCCESS:SDP Conn Data OK
*Mar  1 01:07:48.192:SUCCESS:END of Parsing
*Mar  1 01:07:48.200:SUCCESS:Conn ID string building is OK
*Mar  1 01:07:48.200:SUCCESS:Building SGCP Parameter lines is OK
*Mar  1 01:07:48.200:SUCCESS:SGCP message building OK
*Mar  1 01:07:48.200:SUCCESS:END of building
*Mar  1 01:07:48.200:SGCP Packet sent --->
200 779665338 OK
I:6
v=0
c=IN IP4 5.0.0.1
m=audio 16538 RTP/AVP 0
<---
*Mar  1 01:07:53.674:Packet received -
MDCX 177780432 ds1-1/13@mc1 SGCP 1.1
I:6
M:sendrecv
X:519556004
L:p:10,e:on, s:off,a:G.711u
C:6
R:hu
S:hd
v=0
c=IN IP4 6.0.0.1
m=audio 16392 RTP/AVP 0
*Mar  1 01:07:53.674:SUCCESS:SGCP Header parsing was OK
*Mar  1 01:07:53.674:SUCCESS:Conn ID string(6) parsing is OK
*Mar  1 01:07:53.674:SUCCESS:Connection Mode parsing is OK
*Mar  1 01:07:53.674:SUCCESS:Request ID string(519556004) parsing is OK
*Mar  1 01:07:53.678:SUCCESS:Packet period parsing is OK
*Mar  1 01:07:53.678:SUCCESS:Echo Cancellation parsing is OK
*Mar  1 01:07:53.678:SUCCESS:Silence Supression parsing is OK
*Mar  1 01:07:53.678:SUCCESS:CODEC strings parsing is OK
*Mar  1 01:07:53.678:SUCCESS:Local Connection option parsing is OK
*Mar  1 01:07:53.678:SUCCESS:Call ID string(6) parsing is OK
*Mar  1 01:07:53.678:SUCCESS:Requested Event parsing is OK
*Mar  1 01:07:53.678:SUCCESS:Signal Requests parsing is OK
*Mar  1 01:07:53.678:SUCCESS:SDP Protocol version parsing OK
*Mar  1 01:07:53.678:SUCCESS:SDP Conn Data OK
*Mar  1 01:07:53.678:SUCCESS:END of Parsing
*Mar  1 01:07:53.682:SUCCESS:Conn ID string building is OK
*Mar  1 01:07:53.682:SUCCESS:Building SGCP Parameter lines is OK
*Mar  1 01:07:53.682:SUCCESS:SGCP message building OK
*Mar  1 01:07:53.682:SUCCESS:END of building
*Mar  1 01:07:53.682:SGCP Packet sent --->
200 177780432 OK
I:6
v=0
c=IN IP4 5.0.0.1
m=audio 16538 RTP/AVP 0
<---
*Mar  1 01:09:02.401:SUCCESS:Request ID string building is OK
*Mar  1 01:09:02.401:SUCCESS:Building SGCP Parameter lines is OK
*Mar  1 01:09:02.401:SUCCESS:SGCP message building OK
*Mar  1 01:09:02.401:SUCCESS:END of building
*Mar  1 01:09:02.401:SGCP Packet sent --->
NTFY 24 ds1-1/13@mc1 SGCP 1.1
X:519556004
O:hu
<---
*Mar  1 01:09:02.401:NTFY Packet sent successfully.
*Mar  1 01:09:02.437:Packet received -
200 24
*Mar  1 01:09:02.441:SUCCESS:SGCP Header parsing was OK
*Mar  1 01:09:02.441:SUCCESS:END of Parsing
*Mar  1 01:09:02.541:Packet received -
DLCX 865375036 ds1-1/13@mc1 SGCP 1.1
C:6
S:hu
*Mar  1 01:09:02.541:SUCCESS:SGCP Header parsing was OK
*Mar  1 01:09:02.541:SUCCESS:Call ID string(6) parsing is OK
*Mar  1 01:09:02.541:SUCCESS:Signal Requests parsing is OK
*Mar  1 01:09:02.541:SUCCESS:END of Parsing
*Mar  1 01:09:02.545:SUCCESS:SGCP message building OK
*Mar  1 01:09:02.545:SUCCESS:END of building
*Mar  1 01:09:02.545:SGCP Packet sent --->
250 865375036 OK
<---
*Mar  1 01:09:02.577:Packet received -
RQNT 254959796 ds1-1/13@mc1 SGCP 1.1
X:358258758
R:hd
*Mar  1 01:09:02.577:SUCCESS:SGCP Header parsing was OK
*Mar  1 01:09:02.577:SUCCESS:Request ID string(358258758) parsing is OK
*Mar  1 01:09:02.577:SUCCESS:Requested Event parsing is OK
*Mar  1 01:09:02.581:SUCCESS:END of Parsing
*Mar  1 01:09:02.581:SUCCESS:SGCP message building OK
*Mar  1 01:09:02.581:SUCCESS:END of building
*Mar  1 01:09:02.581:SGCP Packet sent --->
200 254959796 OK
Related Commands
Command
Description
debug rtpspi all
Debugs all RTP SPI errors, sessions, and in/out functions.
debug rtpspi errors
Debugs RTP SPI errors.
debug rtpspi inout
Debugs RTP SPI in/out functions.
debug rtpspi send-nse
Triggers the RTP SPI to send a triple redundant NSE.
debug sgcp errors
Debugs SGCP errors.
debug sgcp events
Debugs SGCP events.
debug vtsp send-nse
Sends and debugs a triple redundant NSE from the DSP to a remote gateway.
debug shared-line
To display debugging information about SIP shared lines, use the debug shared-linecommand in privileged EXEC mode. To disable debugging messages, use the no form of this command.
debug shared-line { all | errors | events | info }
no debug shared-line { all | errors | events | info }
Examples
The following example shows output from the debug shared-line all command:
Router# debug shared-line all Aug 21 21:56:56.949: //Shared-Line/EVENT/shrl_validate_newcall_outgoing:Outgoing call validation request from AFW for user = 20143, usrContainer = 4A7CFBDC .Aug 21 21:56:56.949: //Shared-Line/INFO/shrl_find_ccb_by_dn:Searching Shared-Line table for dn '20143' .Aug 21 21:56:56.949: //Shared-Line/INFO/shrl_find_ccb_by_dn:Entry not found for dn '20143' .Aug 21 21:56:56.949: //Shared-Line/INFO/shrl_find_ccb_by_demote_dn:Demoted dn: 20143 .Aug 21 21:56:56.949: //Shared-Line/INFO/shrl_validate_newcall_outgoing:User '20143' doesn't exist in Shared-Line table .Aug 21 21:56:56.957: //Shared-Line/EVENT/shrl_validate_newcall_incoming:Incominging call validation request from AFW for user = 20141 .Aug 21 21:56:56.957: //Shared-Line/INFO/shrl_find_ccb_by_dn:Searching Shared-Line table for dn '20141' .Aug 21 21:56:56.957: //Shared-Line/INFO/shrl_find_ccb_by_dn:Entry found [ccb = 4742EAD4] for dn '20141' .Aug 21 21:56:56.957: //Shared-Line/INFO/shrl_validate_newcall_incoming:User '20141' found: ccb = 4742EAD4, mem_count = 2 .Aug 21 21:56:56.957: //Shared-Line/EVENT/shrl_validate_newcall_incoming:Obtained call instance inst: 0 for incoming call, incoming leg (peer_callid): 5399) .Aug 21 21:56:56.957: //Shared-Line/INFO/shrl_update_barge_calltype:Updating shared-line call -1 with calltype = 1 .Aug 21 21:56:56.961: //Shared-Line/INFO/shrl_find_ccb_by_dn:Searching Shared-Line table for dn '20141' .Aug 21 21:56:56.961: //Shared-Line/INFO/shrl_find_ccb_by_dn:Entry found [ccb = 4742EAD4] for dn '20141' .Aug 21 21:56:56.961: //Shared-Line/INFO/shrl_find_ccb_by_dn:Searching Shared-Line table for dn '20141' .Aug 21 21:56:56.961: //Shared-Line/INFO/shrl_find_ccb_by_dn:Entry found [ccb = 4742EAD4] for dn '20141' .Aug 21 21:57:01.689: %IPPHONE-6-REG_ALARM: 24: Name=SEP00141C48E126 Load=8.0(5.0) Last=Phone-Reg-Rej .Aug 21 21:57:04.261: //Shared-Line/EVENT/shrl_app_event_notify_handler:Event notification received: event = 9, callID = 5401, dn = 20141 .Aug 21 21:57:04.261: //Shared-Line/INFO/shrl_find_ccb_by_dn:Searching Shared-Line table for dn '20141' .Aug 21 21:57:04.261: //Shared-Line/INFO/shrl_find_ccb_by_dn:Entry found [ccb = 4742EAD4] for dn '20141' .Aug 21 21:57:04.261: //Shared-Line/EVENT/shrl_process_connect:called with state = 3, callID = 5401, peer callID = 5399, dn = 20141, usrContainer = 4A7CACA4 .Aug 21 21:57:04.261: //Shared-Line/INFO/shrl_connect_upd_callinfo:Parsed To: 20141@15.6.0.2, to-tag: 2ed5b927-6ad6 .Aug 21 21:57:04.261: //Shared-Line/INFO/shrl_connect_upd_callinfo:Parsed Contact: 20141@15.6.0.2 for sipCallId: E8583537-6F0211DD-96A69BA1-1228BEFB@15.10.0.1 .Aug 21 21:57:04.261: //Shared-Line/EVENT/shrl_connect_upd_callinfo:Obtained call instance inst: 0 .Aug 21 21:57:04.261: //Shared-Line/INFO/shrl_connect_upd_callinfo:CONNECT from shared line for incoming shared-line call. .Aug 21 21:57:04.261: //Shared-Line/INFO/shrl_find_peer_by_ipaddr:Trying to match peer for member 20141@15.6.0.2 .Aug 21 21:57:04.261: //Shared-Line/INFO/shrl_find_peer_by_ipaddr:Matching peer [40002] session target parsed = 15.6.0.2 .Aug 21 21:57:04.261: //Shared-Line/INFO/shrl_connect_upd_callinfo:Matching member found: 20141@15.6.0.2 .Aug 21 21:57:04.261: //Shared-Line/INFO/shrl_update_remote_name:Updating shared-line call dialog info 5401 .Aug 21 21:57:04.261: //Shared-Line/INFO/shrl_process_connect:Updated callinfo for callid: 5401, member: '20141@15.6.0.2', peer-tag: 40002 .Aug 21 21:57:04.261: //Shared-Line/INFO/shrl_process_connect:Notify remote users about CALL-CONNECT. .Aug 21 21:57:04.261: //Shared-Line/EVENT/shrl_send_dialog_notify:Sending NOTIFY to remote user: 20141@15.6.0.1 .Aug 21 21:57:04.261: //Shared-Line/INFO/shrl_send_dialog_notify:Sending NOTIFY to remote user: 20141@15.6.0.1 about state 3 on incoming call from 20141@15.6.0.2 privacy OFF .Aug 21 21:57:04.261: //Shared-Line/INFO/shrl_send_dialog_notify:Dialog msg: dir: 1, orient: 2, local_tag: 2ed5b927-6ad6, remote_tag: 89DCF0-139B, local_uri: 20141@15.6.0.2, remote_uri: 20143@15.10.0.1 .Aug 21 21:57:04.261: //Shared-Line/INFO/shrl_send_dialog_notify:Dialog notify sent successfully .Aug 21 21:57:04.261: //Shared-Line/INFO/shrl_process_connect:Shared-Line '20141': Successfully sent notify for callid: 5401 .Aug 21 21:57:04.265: //Shared-Line/INFO/shrl_find_ccb_by_dn:Searching Shared-Line table for dn '20141' .Aug 21 21:57:04.265: //Shared-Line/INFO/shrl_find_ccb_by_dn:Entry found [ccb = 4742EAD4] for dn '20141' .Aug 21 21:57:04.265: //Shared-Line/INFO/shrl_find_ccb_by_dn:Searching Shared-Line table for dn '20143' .Aug 21 21:57:04.265: //Shared-Line/INFO/shrl_find_ccb_by_dn:Entry not found for dn '20143' .Aug 21 21:57:04.269: //Shared-Line/INFO/shrl_find_ccb_by_demote_dn:Demoted dn: 20143 .Aug 21 21:57:04.269: //Shared-Line/INFO/shrl_update_totag:Shared-Line not enabled for '20143' .Aug 21 21:57:04.269: //Shared-Line/EVENT/shrl_app_event_notify_handler:Event notification received: event = 21, callID = 5401, dn = 20141 .Aug 21 21:57:04.269: //Shared-Line/INFO/shrl_find_ccb_by_dn:Searching Shared-Line table for dn '20141' .Aug 21 21:57:04.269: //Shared-Line/INFO/shrl_find_ccb_by_dn:Entry found [ccb = 4742EAD4] for dn '20141' .Aug 21 21:57:04.269: //Shared-Line/EVENT/shrl_process_callerid_update:called with state = 7, callID = 5401, peer callID = 5399, dn = 20141 .Aug 21 21:57:04.269: //Shared-Line/INFO/shrl_process_callerid_update:Updated callinfo for callid: 5401, member: '20141@15.6.0.2', peer-tag: 40002 .Aug 21 21:57:04.269: //Shared-Line/EVENT/shrl_is_outbound:Check for shared line call type callid 5401for user = 20141 .Aug 21 21:57:04.269: //Shared-Line/INFO/shrl_find_ccb_by_dn:Searching Shared-Line table for dn '20141' .Aug 21 21:57:04.269: //Shared-Line/INFO/shrl_find_ccb_by_dn:Entry found [ccb = 4742EAD4] for dn '20141' .Aug 21 21:57:04.269: //Shared-Line/EVENT/shrl_barge_type:Check for shared line call type callid 5401for user = 20141 .Aug 21 21:57:04.269: //Shared-Line/INFO/shrl_find_ccb_by_dn:Searching Shared-Line table for dn '20141' .Aug 21 21:57:04.269: //Shared-Line/INFO/shrl_find_ccb_by_dn:Entry found [ccb = 4742EAD4] for dn '20141' .Aug 21 21:57:04.273: //Shared-Line/INFO/shrl_find_ccb_by_dn:Searching Shared-Line table for dn '20141' .Aug 21 21:57:04.273: //Shared-Line/INFO/shrl_find_ccb_by_dn:Entry found [ccb = 4742EAD4] for dn '20141' .Aug 21 21:57:04.281: //Shared-Line/EVENT/shrl_notify_done_handler:NOTIFY_DONE received for subID: 5 respCode: 17 .Aug 21 21:57:04.281: //Shared-Line/INFO/shrl_find_ccb_by_subid:Search ccb for subid: 5 .Aug 21 21:57:04.281: //Shared-Line/INFO/shrl_find_ccb_by_subid:Found the entry ccb: 4742EAD4 member: 20141@15.6.0.1 .Aug 21 21:57:04.281: //Shared-Line/INFO/shrl_free_spi_respinfo:Free ASNL resp info for subID = 5debug smrp all
To display information about Simple Multicast Routing Protocol (SMRP) activity, use the debug smrp allprivileged EXEC command. The no form of this command disables debugging output.
Command History
10.0
This command was introduced.
12.2(13)T
This command is no longer supported in Cisco IOS Mainline releases or in Technology-based (T-train) releases. It might continue to appear in 12.2S-family releases.
12.2SX
This command is supported in the Cisco IOS Release 12.2SX train. Support in a specific 12.2SX release of this train depends on your feature set, platform, and platform hardware.
Usage Guidelines
Because the debug smrp all command displays all SMRP debugging output, it is processor intensive and should not be enabled when memory is scarce or in very high traffic situations.
For general debugging, use the debug smrp all command and turn off excessive transactions with the no debug smrp transaction command. This combination of commands will display various state changes and events without displaying every transaction packet. For debugging a specific feature such as a routing problem, use the debug smrp route and debug smrp transaction commandsto learn if packets are sent and received and which specific routes are affected. The show smrp traffic EXEC command is highly recommended as a troubleshooting method because it displays the SMRP counters.
For examples of the type of output you may see, refer to each of the commands listed in the “Related Commands” section.
Related Commands
Command
Description
debug smrp group
Displays information about SMRP group activity.
debug smrp mcache
Displays information about SMRP multicast fast-switching cache entries.
debug smrp neighbor
Displays information about SMRP neighbor activity.
debug smrp port
Displays information about SMRP port activity.
debug smrp route
Displays information about SMRP routing activity.
debug smrp transaction
Displays information about SMRP transactions.
debug smrp group
To display information about SMRP group activity, use the debug smrp groupprivileged EXEC command. The no form of this command disables debugging output.
Command History
10.0
This command was introduced.
12.2(13)T
This command is no longer supported in Cisco IOS Mainline releases or in Technology-based (T-train) releases. It might continue to appear in 12.2S-family releases.
12.2SX
This command is supported in the Cisco IOS Release 12.2SX train. Support in a specific 12.2SX release of this train depends on your feature set, platform, and platform hardware.
Usage Guidelines
The debug smrp groupcommand displays information when a group is created or deleted and when a forwarding entry for a group is created, changed, or deleted. For more information, refer to the show smrp group command described in the Cisco IOS AppleTalk and Novell IPX Command Reference.
Examples
The following is sample output from the debug smrp groupcommand showing a port being created and deleted on group AT 20.34. (AT signifies that this is an AppleTalk network group.)
Router#
debug smrp group
SMRP: Group AT 20.34, created on port 20.1 by 20.2
SMRP: Group AT 20.34, deleted on port 20.1
The table below lists the messages that may be generated with the debug smrp group command concerning the forwarding table.
Table 13 debug smrp group Message Descriptions Messages
Descriptions
Group <address>, deleted on port <address>
Group entry was deleted from the group table for the specified port.
Group <address>, forward state changed from state to state
State of the group changed. States are join, forward, and leave.
Group <address>, deleted forward entry
Group was deleted from the forwarding table.
Group <address>, created on port <address> by <address>
Group entry was created in the table for the specified port.
Group <address>, added by <address> to the group
Secondary router has added this group to its group table.
Group <address>, discard join request from <address>, not responsible
Discard Join Group request if the router is not the primary router on the local connected network or if it is not the port parent of the route.
Group <address>, join request from <address>
Request to join the group was received.
Group <address>, forward is found
Forward entry for the group was found in the forwarding table.
Group <address>, forward state is already joining, ignored
Request to join the group is in progress, so the second request was discarded.
Group <address>, no forward found
Forward entry for the group was not found in the forwarding table.
Group <address>, join request discarded, fw discarded, fwd parent port not operational
Request to join the group was discarded because the parent port is not available.
Group <address>, created forward entry - parent <address> child <address>
Forward entry was created in the forwarding table for the parent and child address.
Group <address>, creator no longer up on <address>
Group creator has not been heard from for a specified time and is deemed no longer available.
Group <address>, pruning duplicate path on <address>
Duplicate path was removed. If we are forwarding and we are a child port, and our port parent address is not pointing to our own port address, we are in a duplicate path.
Group <address>, member no longer up on <address>
Group member has not been heard from for a specified time and is deemed no longer available.
Group <address>, no more child ports in forward entry
Forward entry for group no longer has any child ports. As a result, the forward entry is no longer necessary.
debug smrp mcache
To display information about SMRP multicast fast-switching cache entries, use the debug smrp mcacheprivileged EXEC command. The no form of this command disables debugging output.
Command History
10.0
This command was introduced.
12.2(13)T
This command is no longer supported in Cisco IOS Mainline releases or in Technology-based (T-train) releases. It might continue to appear in 12.2S-family releases.
12.2SX
This command is supported in the Cisco IOS Release 12.2SX train. Support in a specific 12.2SX release of this train depends on your feature set, platform, and platform hardware.
Usage Guidelines
Use the show smrp mcache EXEC command (described in the Cisco IOS AppleTalk and Novell IPX Command Reference to display the entries in the SMRP multicast cache, and use the debug smrp mcache command to learn whether the cache is being populated and invalidated.
Examples
The following is sample output from the debug smrp mcachecommand. In this example, the cache is created and populated for group AT 11.124. (AT signifies that this is an AppleTalk network group.)
Router#
debug smrp mcache
SMRP: Cache created
SMRP: Cache populated for group AT 11.124
        mac - 090007400b7c00000c1740d9
        net - 001fef7500000014ff020a0a0a
SMRP: Forward cache entry created for group AT 11.124
SMRP: Forward cache entry validated for group AT 11.124
SMRP: Forward cache entry invalidated for group AT 11.124
SMRP: Forward cache entry deleted for group AT 11.124
The table below lists all the messages that can be generated with the debug smrp mcache command concerning the multicast cache.
Table 14 debug smrp mcache Message Descriptions Messages
Descriptions
Cache populated for group <address>
SMRP packet was received on a parent port that has fast switching enabled. As a result, the cache was created and the MAC and network headers were stored for all child ports that have fast switching enabled. Use the show smrp port appletalk EXEC command with the optional interface type and number to display the switching path.
Cache memory allocated
Memory was allocated for the multicast cache.
Forward cache entry created/deleted for group <address>
Forward cache entry for the group was added to or deleted from the cache.
Forward cache entry validated for group <address>
Forward cache entry is validated and is now ready for fast switching.
Forward cache entry invalidated for group <address>
Cache entry is invalidated because some change (such as port was shut down) occurred to one of the ports.
debug smrp neighbor
To display information about SMRP neighbor activity, use the debug smrp neighborprivileged EXEC command. The no form of this command disables debugging output.
Command History
10.0
This command was introduced.
12.2(13)T
This command is no longer supported in Cisco IOS Mainline releases or in Technology-based (T-train) releases. It might continue to appear in 12.2S-family releases.
12.2SX
This command is supported in the Cisco IOS Release 12.2SX train. Support in a specific 12.2SX release of this train depends on your feature set, platform, and platform hardware.
Usage Guidelines
The debug smrp neighborcommand displays information when a neighbor operating state changes. A neighbor is an adjacent router. For more information, refer to the show smrp neighbor EXEC command described in the Cisco IOS AppleTalk and Novell IPX Command Reference.
Examples
The following is sample output from the debug smrp neighborcommand. In this example, the neighbor on port 30.02 has changed state from normal operation to secondary operation.
Router#
debug smrp neighbor
SMRP: Neighbor 30.2, state changed from “normal op” to “secondary op”
The table below lists all the messages that can be generated with the debug smrp neighborcommand concerning the neighbor table.
Table 15 debug smrp neighbor Message Descriptions Messages
Descriptions
Neighbor <address>, state changed from state to state
State of the neighbor changed. States are primary operation, secondary operation, normal operation, primary negotiation, secondary negotiation, and down.
Neighbor <address>, neighbor added/deleted
Neighbor was added to or removed from the neighbor table.
SMRP neighbor up/down
Neighbor is available for service or unavailable.
Neighbor <address>, no longer up
Neighbor is unavailable because it has not been heard from for a specified duration.
debug smrp port
To display information about SMRP port activity, use the debug smrp portprivileged EXEC command. The no form of this command disables debugging output.
Command History
10.0
This command was introduced.
12.2(13)T
This command is no longer supported in Cisco IOS Mainline releases or in Technology-based (T-train) releases. It might continue to appear in 12.2S-family releases.
12.2SX
This command is supported in the Cisco IOS Release 12.2SX train. Support in a specific 12.2SX release of this train depends on your feature set, platform, and platform hardware.
Usage Guidelines
The debug smrp portcommand displays information when a port operating state changes. For more information, refer to the show smrp port command described in the Cisco IOS AppleTalk and Novell IPX Command Reference.
Examples
The following is sample output from the debug smrp portcommand. In this example, port 30.1 has changed state from secondary negative to secondary operation to primary negative:
Router#
debug smrp port
SMRP: Port 30.1, state changed from "secondary neg" to "secondary op"
SMRP: Port 30.1, secondary router changed from 0.0 to 30.1
SMRP: Port 30.1, state changed from "secondary op" to "primary neg"
The table below lists all the messages that can be generated with the debug smrp portcommand concerning the port table.
Table 16 debug smrp port Message Descriptions Messages
Descriptions
Port <address>, port created/deleted
Port entry was added to or removed from the port table.
Port <address>, line protocol changed to state
Line protocol for the port is up or down.
Port <address>, state changed from state to state
State of the port changed. States are primary operation, secondary operation, normal operation, primary negotiation, secondary negotiation, and down.
Port <address>, primary/secondary router changed from <address>to <address>
Primary or secondary port address of the router changed.
debug smrp route
To display information about SMRP routing activity, use the debug smrp routeprivileged EXEC command. The no form of this command disables debugging output.
Command History
10.0
This command was introduced.
12.2(13)T
This command is no longer supported in Cisco IOS Mainline releases or in Technology-based (T-train) releases. It might continue to appear in 12.2S-family releases.
12.2SX
This command is supported in the Cisco IOS Release 12.2SX train. Support in a specific 12.2SX release of this train depends on your feature set, platform, and platform hardware.
Usage Guidelines
For more information, refer to the show smrp route EXEC command described in the Cisco IOS AppleTalk and Novell IPX Command Reference.
Examples
The following is sample output from the debug smrp routecommand. In this example, poison notification is received from port 30.2. Poison notification is the receipt of a poisoned route on a nonparent port.
Router#
debug smrp route
SMRP: Route AT 20-20, poison notification from 30.2
SMRP: Route AT 30-30, poison notification from 30.2
The table below lists all the messages that can be generated with the debug smrp routecommand concerning the routing table. In the table, the term route does not refer to an address but rather to a network range.
Table 17 debug smrp route Message Descriptions Messages
Descriptions
Route address, deleted/created as local network
Route entry was removed from or added to the routing table.
Route address, from address has invalid distance value
Route entry from the specified address has an incorrect distance value and was ignored.
Route address, unknown route poisoned by address ignored
Route entry received from the specified address is bad and was ignored.
Route address, created via address - hop number tunnel number
New route entry added to the routing table with the specified number of hops and tunnels.
Route address, from address - overlaps existing route
Route entry received from the specified address overlaps an existing route and was ignored.
Route address, poisoned by address
Route entry has been poisoned by neighbor. Poisoned routes have distance of 255.
Route address, poison notification from address
Poisoned route is received from a nonparent port.
Route address, worsened by parent address
Distance to the route has worsened (become higher), received from the parent neighbor.
Route address, improved via address - number -> number hop, number-> number tunnel
Distance to the route has improved (become lower), received from a neighbor.
Route address, switched to address - higher address than address
Tie condition exists, and because this router had the highest network address, it was used to forward the packet.
Route address, parent port changed address -> address
Parent port address change occurred. The parent port address of a physical network segment determines which router should handle Join Group and Leave Group requests.
SMRP bad distance vector
Packet has an invalid distance vector and was ignored.
Route address, has been poisoned
Route has been poisoned. Poisoned routes are purged from the routing table after a specified time.
debug smrp transaction
To display information about SMRP transactions, use the debug smrp transactionprivileged EXEC command. The no form of this command disables debugging output.
Examples
The following is sample output from the debug smrp transactioncommand. In this example, a secondary node request is sent out to all routers on port 30.1.
Router#
debug smrp transaction
SMRP: Transaction for port 30.1, secondary node request (seq 8435) sent to all routers
SMRP: Transaction for port 30.1, secondary node request (seq 8435) sent to all routers
SMRP: Transaction for port 30.1, secondary node request (seq 8435) sent to all routers
SMRP: Transaction for port 30.1, secondary node request (seq 8435) sent to all routers
The table below lists all the messages that can be generated with the debug smrp routecommand.
Table 18 debug smrp Transaction Message Descriptions Messages
Descriptions
Transaction for port address, packet-type command-type (grp/sec number) sent to/received from address
Port message concerning a packet or command was sent to or received from the specified address.
Transaction for group address on port address, (seq number) sent to/received from address
Group message for a specified port was sent to or received from the specified address.
Unrecognized transaction for port address
Unrecognized message was received and ignored by the port.
Discarded incomplete request
Incomplete message was received and ignored.
Response in wrong state in HandleRequest
Message was received with the wrong state and was ignored.
SMRP bad packet type
SMRP packet was received with a bad packet type and was ignored.
Packet discarded, Bad Port ID
Packet was received with a bad port ID and was ignored.
Packet discarded, Check Packet failed
Packet was received with a failed check packet and was ignored.
debug snasw dlc
To display frame information entering and leaving the Systems Network Architecture (SNA) switch in real time to the console, use the debug snasw dlc command in privileged EXEC mode.
Usage Guidelines
Caution
The debug snasw dlc command displays the same trace information available via the snasw dlctrace command. The snasw dlctrace command is the preferred method for gathering this trace information because it is written to a capture buffer instead of directly to the console. The debug snasw dlc command should only be used when it is certain that the output will not cause excessive data to be output to the console.
Examples
The following shows sample output from the debug snasw dlc command:
Router# debug snasw dlc Sequence Number Size of ISR/ Link SNA BTU HPR Description of frame 343 MVSD In sz:134 ISR fmh5 DLUR Rq ActPU NETA.APPNRA29 344 MVSD Out sz:12 ISR +Rsp IPM slctd nws:0008 345 @I000002 Out sz:18 ISR Rq ActPU 346 MVSD Out sz:273 ISR fmh5 TOPOLOGY UPDATE 347 @I000002 In sz:9 ISR +Rsp Data 348 @I000002 In sz:12 ISR +Rsp IPM slctd nws:0002 349 @I000002 In sz:29 ISR +Rsp ActPU 350 MVSD Out sz:115 ISR fmh5 DLUR +Rsp ActPU 351 MVSD In sz:12 ISR +Rsp IPM slctd nws:0007 352 MVSD In sz:88 ISR fmh5 DLUR Rq ActLU NETA.MARTLU1 353 MVSD Out sz:108 ISR fmh5 REGISTER 354 @I000002 Out sz:27 ISR Rq ActLU NETA.MARTLU1debug snasw ips
To display internal signal information between the Systems Network Architecture (SNA) switch and the console in real time, use the debug snasw ipscommand in privileged EXEC mode.
Usage Guidelines
Caution
The debug snasw ipscommand displays the same trace information available via the snasw ipstrace command. Output from this debug command can be large. The snasw ipstracecommand is the preferred method for gathering this trace information because it is written to a capture buffer instead of directly to the console. The debug snasw ips command should only be used when it is certain that the output will not cause excessive data to be output to the console. The debug snasw dlc command displays the same trace information available via the snasw dlctrace command.
Examples
The following is an example of the debug snasw ips command output:
Router# debug snasw ips Sequence Number Sending Receiving Signal Name Process Process Queue 11257 : DEALLOCATE_RCB : --(0) -> RM(2130000) Q 4 11258 : RCB_DEALLOCATED : RM(2130000) -> PS(22E0000) Q 2 11259 : RCB_DEALLOCATED : --(0) -> PS(22E0000) Q 2 11260 : VERB_SIGNAL : PS(22E0000) -> DR(20F0000) Q 2 11261 : FREE_SESSION : --(0) -> RM(2130000) Q 2 11262 : BRACKET_FREED : RM(2130000) -> HS(22FB0001) Q 2 11263 : BRACKET_FREED : --(0) -> HS(22FB0001) Q 2 11264 : VERB_SIGNAL : --(0) -> DR(20F0000) Q 2 11265 : DLC_MU : DLC(2340000) -> PC(22DD0001) Q 2 11266 : DLC_MU : --(0) -> PC(22DD0001) Q 2debug snmp bulkstat
To enable debugging messages for the Simple Network Management Protocol (SNMP) bulk statistics, use the debug snmp bulkstat command in privileged EXEC mode. To disable debugging output, use the no form of this command.
Command History
Release
Modification
12.0(24)S
This command was introduced.
12.3(2)T
This command was integrated into Cisco IOS Release 12.3(2)T.
12.2(25)S
This command was integrated into Cisco IOS Release 12.2(25)S.
12.2(33)SRA
This command was integrated into Cisco IOS Release 12.2(33)SRA.
12.2(33)SXH
This command was integrated into Cisco IOS Release 12.2(33)SXH.
12.2(33)SB
This command was integrated into Cisco IOS Release 12.2(33)SB.
Cisco IOS XE Release 2.1
This command was integrated into Cisco IOS Release XE 2.1.
Usage Guidelines
This command is intended primarily for Cisco support personnel. Debugging output for the Periodic MIB Data Collection and Transfer Mechanism (Bulk Statistics feature) includes messages for data collection, local file generation, and transfer attempts.
Examples
In the following example, debugging command output is enabled for the Periodic MIB Data Collection and Transfer Mechanism (Bulk Statistics feature). Note that the references to a VFile indicate a local bulk statistics file, usually followed by the filename. The filename uses the format specified-filename _device-name _date_time-stamp.
Router# debug snmp 00:17:38:BULKSTAT-DC:Poll timer fired for ifmib 00:17:38:BULKSTAT-DC:In pollDataGroup 00:17:38:BULKSTAT-DC:creating new file vfile:IfMIB_objects_ios108_030307_101119739 00:17:38:BULKSTAT-DC:Too small state buffer for ifmib 102 00:17:38:BULKSTAT-DC:Increased buffer state to 1024 00:17:38:BULKSTAT-DC:Interface type data group 00:17:38:BULKSTAT-DC:polling done 00:18:38:BULKSTAT-DC:Poll timer fired for ifmib 00:18:38:BULKSTAT-DC:In pollDataGroup 00:18:38:BULKSTAT-DC:Interface type data group 00:18:38:BULKSTAT-DC:polling done 00:19:26: BULKSTAT-DC:Collection timer fired for IfMIB_objects 00:19:26:BULKSTAT-TP:Transfer request for vfile:IfMIB_objects_ios108_030307_101119739 00:19:30:BULKSTAT-TP:written vfile IfMIB_objects_ios108_030307_101119739 00:19:30:BULKSTAT-TP:retained vfile vfile:IfMIB_objects_ios108_030307_101119739 00:19:38:BULKSTAT-DC:Poll timer fired for ifmib 00:19:38:BULKSTAT-DC:In pollDataGroup 00:19:38:BULKSTAT-DC:creating new file vfile:IfMIB_objects_ios108_030307_101319739 00:19:38:BULKSTAT-DC:Interface type data group 00:19:38:BULKSTAT-DC:polling done 00:20:38:BULKSTAT-DC:Poll timer fired for ifmib 00:20:38:BULKSTAT-DC:In pollDataGroup 00:20:38:BULKSTAT-DC:Interface type data group 00:20:38:BULKSTAT-DC:polling done 00:21:38:BULKSTAT-DC:Poll timer fired for ifmib 00:21:38:BULKSTAT-DC:In pollDataGroup 00:21:38:BULKSTAT-DC:Interface type data group 00:21:38:BULKSTAT-DC:polling done 00:22:26: BULKSTAT-DC:Collection timer fired for IfMIB_objects 00:22:26:BULKSTAT-TP:Transfer request for vfile:IfMIB_objects_ios108_030307_101319739 00:22:26:BULKSTAT-TP:written vfile IfMIB_objects_ios108_030307_101319739 00:22:26:BULKSTAT-TP:retained vfile vfile:IfMIB_objects_ios108_030307_101319739 00:22:38:BULKSTAT-DC:Poll timer fired for ifmib 00:22:38:BULKSTAT-DC:In pollDataGroup 00:22:38:BULKSTAT-DC:creating new file vfile:IfMIB_objects_ios108_030307_101619739 00:22:38:BULKSTAT-DC:Interface type data group 00:22:38:BULKSTAT-DC:polling done 00:23:38:BULKSTAT-DC:Poll timer fired for ifmib 00:23:38:BULKSTAT-DC:In pollDataGroup 00:23:38:BULKSTAT-DC:Interface type data group 00:23:38:BULKSTAT-DC:polling done 00:24:38:BULKSTAT-DC:Poll timer fired for ifmib 00:24:38:BULKSTAT-DC:In pollDataGroup 00:24:38:BULKSTAT-DC:Interface type data group 00:24:38:BULKSTAT-DC:polling done 00:25:26: BULKSTAT-DC:Collection timer fired for IfMIB_objects 00:25:26:BULKSTAT-TP:Transfer request for vfile:IfMIB_objects_ios108_030307_101619739 00:25:26:BULKSTAT-TP:written vfile IfMIB_objects_ios108_030307_101619739 00:25:26:BULKSTAT-TP:retained vfile vfile:IfMIB_objects_ios108_030307_101619739 00:25:38:BULKSTAT-DC:Poll timer fired for ifmib 00:25:38:BULKSTAT-DC:In pollDataGroup 00:25:38:BULKSTAT-DC:creating new file vfile:IfMIB_objects_ios108_030307_101919739 00:25:38:BULKSTAT-DC:Interface type data group 00:25:38:BULKSTAT-DC:polling done 00:26:38:BULKSTAT-DC:Poll timer fired for ifmib 00:26:38:BULKSTAT-DC:In pollDataGroup 00:26:38:BULKSTAT-DC:Interface type data group 00:26:38:BULKSTAT-DC:polling donedebug snmp detail
To display the Simple Network Management Protocol (SNMP) debug messages, use the debug snmp detailcommand in privileged EXEC mode. To disable debugging output, use the no form of this command.
Usage Guidelines
Before running the debug snmp detailcommand, connect the device to the Network Management System (NMS). The command output displays the debug messages for errors occurred during SNMP operations. The debug messages help in identifying and debugging errors.
Examples
The following is sample output from the debug snmp detailcommand:
Router# debug snmp detail SNMP Detail Debugs debugging is on process_mgmt_req_int: UDP packet being de-queued findContextInfo: Authentication failure, bad community string SrDoSnmp: Bad Community name. process_mgmt_req_int: UDP packet being de-queued SrParseV3SnmpMessage: No matching Engine ID. SrParseV3SnmpMessage: Failed. SrDoSnmp: authentication failure, Unknown Engine ID process_mgmt_req_int: UDP packet being de-queued ParseSequence, Unexpected type: 4 SrParseV3SnmpMessage: ParseSequence: SrParseV3SnmpMessage: Failed. SrDoSnmp: authentication failure, Unsupported security modelQ:debug snmp mib nhrp
To display messages about Simple Network Management Protocol (SNMP) Next Hop Resolution Protocol (NHRP) MIB, use the debug snmp mib nhrpcommand in privileged EXEC mode. To disable debugging output, use the no form of this command.
debug snmp mib nhrp { error | events | internal | notif [detail] }
no debug snmp mib nhrp { error | events | internal | notif [detail] }
Syntax Description
error
Displays messages about SNMP NHRP MIB error events, including error information about packet processing or MIB special events.
events
Displays messages about SNMP NHRP MIB events, from the NHRP MIB tree data-structures and SNMP query-related events.
internal
Displays messages about SNMP NHRP MIB engineering events.
notif
Displays debug messages related to SNMP NHRP MIB notification events.
detail
(Optional) Displays detailed messages related to SNMP NHRP MIB notification events.
Usage Guidelines
The debug snmp mib nhrp internal command can generate many output messages. Due to the increased command processing and its effect on system usage, the use of this command is not advisable under normal circumstances.
Examples
The following is sample output from the debug snmp mib nhrp notifcommand:
*May 10 12:52:01.245: NHRP_SNMP-NOTIF[1488]: Retrieved values from instrumentation
*May 10 12:52:01.245: NHRP_SNMP-NOTIF[1646]: Varbind list created
*May 10 12:52:01.245: NHRP_SNMP-NOTIF[1665]: NHRP trap queued: cneNotifNextHopRegClientUp
The following is sample output from the debug snmp mib nhrp notif detailcommand:
*May 10 12:52:44.461: NHRP_SNMP-NOTIF[695]: Address parameters'
extraction for local and remote endpoints successful
*May 10 12:52:44.461: NHRP_SNMP-NOTIF[1488]: Retrieved values from instrumentation
*May 10 12:52:44.461: NHRP_SNMP-NOTIF[1589]: Instance OIDs populated
*May 10 12:52:44.461: NHRP_SNMP-NOTIF[1608]: Value types  and values populated
*May 10 12:52:44.461: NHRP_SNMP-NOTIF[1625]: Varbind created for nhrpServerInternetworkAddrType
*May 10 12:52:44.461: NHRP_SNMP-NOTIF[1643]: Varbind created for nhrpServerInternetworkAddr
*May 10 12:52:44.461: NHRP_SNMP-NOTIF[1643]: Varbind created for nhrpServerNbmaAddrType
*May 10 12:52:44.461: NHRP_SNMP-NOTIF[1643]: Varbind created for nhrpServerNbmaAddr
*May 10 12:52:44.461: NHRP_SNMP-NOTIF[1643]: Varbind created for nhrpServerNbmaSubaddr
*May 10 12:52:44.461: NHRP_SNMP-NOTIF[1643]: Varbind created for nhrpServerNhcInternetworkAddrType
*May 10 12:52:44.461: NHRP_SNMP-NOTIF[1643]: Varbind created for nhrpServerNhcInternetworkAddr
*May 10 12:52:44.461: NHRP_SNMP-NOTIF[1643]: Varbind created for nhrpServerNhcNbmaAddrType
*May 10 12:52:44.461: NHRP_SNMP-NOTIF[1643]: Varbind created for nhrpServerNhcNbmaAddr
*May 10 12:52:44.461: NHRP_SNMP-NOTIF[1643]: Varbind created for nhrpServerNhcNbmaSubaddr
*May 10 12:52:44.461: NHRP_SNMP-NOTIF[1643]: Varbind created for nhrpServerNhcPrefixLength
*May 10 12:52:44.461: NHRP_SNMP-NOTIF[1643]: Varbind created for nhrpServerNhcInUse
*May 10 12:52:44.461: NHRP_SNMP-NOTIF[1643]: Varbind created for nhrpServerCacheUniqueness
*May 10 12:52:44.461: NHRP_SNMP-NOTIF[1646]: Varbind list created
*May 10 12:52:44.461: NHRP_SNMP-NOTIF[1665]: NHRP trap queued: cneNotifNextHopRegClientUp
The following is sample output from the debug snmp mib nhrp eventscommand:
Router# debug snmp mib nhrp events
*Apr 10 13:34:46.175: NHRP_SNMP-EVE[2097]: In Get nhrpClientEntry for VRFID [0] ClientIndex [0]  NHS [0] Req [1]
*Apr 10 13:34:46.175: NHRP_SNMP-EVE[2148]: In here as expected.
*Apr 10 13:34:46.175: NHRP_SNMP-EVE[1050]: In Extract Client Entry Info
*Apr 10 13:34:46.223: NHRP_SNMP-EVE[2097]: In Get nhrpClientEntry for VRFID [0] ClientIndex [2]  NHS [0] Req [1]
*Apr 10 13:34:46.223: NHRP_SNMP-EVE[2140]: Could not find the Node
*Apr 10 13:34:46.223: NHRP_SNMP-EVE[2097]: In Get nhrpClientEntry for VRFID [0] ClientIndex [0]  NHS [0] Req [1]
*Apr 10 13:34:46.223: NHRP_SNMP-EVE[2148]: In here as expected.
*Apr 10 13:34:46.223: NHRP_SNMP-EVE[1050]: In Extract Client Entry Info
The following is sample output from the debug snmp mib nhrp internalcommand:
Router# debug snmp mib nhrp internal
*Apr 10 13:36:33.267: NHRP_SNMP-INTR[2089]: In nhrpClientEntry
*Apr 10 13:36:33.323: NHRP_SNMP-INTR[2089]: In nhrpClientEntry
*Apr 10 13:36:33.323: NHRP_SNMP-INTR[2089]: In nhrpClientEntry
The table below describes the significant fields shown in the displays.
Table 19 debug snmp mib nhrp Field Descriptions Field
Description
NHRP_SNMP-ERR[ ]
Indicates output from the debug snmp mib nhrp error command.
NHRP_SNMP-EVE[2097 ]
Indicates output from the debug snmp mib nhrp eventscommand.
NHRP_SNMP-INTR[2089 ]
Indicates output from the debug snmp mib nhrp internal command.
NHRP_SNMP-NOTIF[1488]
Indicates output from the debug snmp mib nhrp notif command.
debug snmp overhead
To display the list of Simple Network Management Protocol (SNMP) MIBs that take more than the threshold time to perform an SNMP get or get-next operation, use the debug snmp overheadcommand in privileged EXEC mode. To disable debugging, use the no form of this command.
Examples
The following is sample output from the debug snmp overhead command:
Router# debug snmp overhead
SNMP overhead debugging is on
*Nov 11 16:35:02.579 PDT:  Process exceeds 1000ms threshold (200ms IOS quantum)
*Nov 11 16:35:02.579 PDT:  GETNEXT of ciscoFlashFileEntry.2.1.1.1--result ciscoFlashFileEntry.2.1.1.2
The table below describes the significant fields shown in the display.
Table 20 debug snmp overhead Field Descriptions Field
Description
Process exceeds 1000ms threshold
Processing time for the SNMP get-next operation is more than 1000 milliseconds.
200ms IOS quantum
Threshold time in milliseconds.
GETNEXT of ciscoFlashFileEntry.2.1.1.1
The OID ciscoFlashFileEntry.2.1.1.1 is queried using the get-next operation.
result ciscoFlashFileEntry.2.1.1.2
The result of the get-next operation is ciscoFlashFileEntry.2.1.1.2, which is the next value of the OID being queried.
debug snmp packet
To display information about every Simple Network Management Protocol (SNMP) packet sent or received by the router, use the debug snmp packet command in privileged EXEC mode. To disable debugging output, use the no form of this command.
Command History
Release
Modification
12.0(24)S
This command was introduced.
12.3(2)T
This command was integrated into Cisco IOS Release 12.3(2)T.
12.2(33)SRA
This command was integrated into Cisco IOS Release 12.2(33)SRA.
12.2(33)SXH
This command was integrated into Cisco IOS Release 12.2(33)SXH.
12.2(33)SB
This command was integrated into Cisco IOS Release 12.2(33)SB.
Cisco IOS XE Release 2.5
This command was implemented on Cisco ASR 1000 series routers.
Examples
The following is sample output from the debug snmp packetcommand. In this example, the router receives a get-next request from the host at 192.10.2.10 and responds with the requested information.
Router# debug snmp packet
SNMP: Packet received via UDP from 192.10.2.10 on Ethernet0
SNMP: Get-next request, reqid 23584, errstat 0, erridx 0
 sysUpTime = NULL TYPE/VALUE
 system.1 = NULL TYPE/VALUE
 system.6 = NULL TYPE/VALUE
SNMP: Response, reqid 23584, errstat 0, erridx 0
 sysUpTime.0 = 2217027
 system.1.0 = Cisco Internetwork Operating System Software
 system.6.0 =
SNMP: Packet sent via UDP to 192.10.2.10
Based on the kind of packet sent or received, the output may vary. For get-bulk requests, a line similar to the following is displayed:
SNMP: Get-bulk request, reqid 23584, nonrptr 10, maxreps 20For traps, a line similar to the following is displayed:
SNMP: V1 Trap, ent 1.3.6.1.4.1.9.1.13, gentrap 3, spectrap 0The table below describes the significant fields shown in the display.
debug snmp requests
To display information about every Simple Network Management Protocol (SNMP) request made by the SNMP manager, use the debug snmp requests command in privileged EXEC mode. To disable debugging output, use the no form of this command.
Examples
The following is sample output from the debug snmp requestscommand:
Router# debug snmp requests
SNMP Manager API: request
  dest: 171.69.58.33.161, community: public
  retries: 3, timeout: 30, mult: 2, use session rtt
  userdata: 0x0
The table below describes the significant fields shown in the display.
Table 22 debug snmp requests Field Descriptions Field
Description
SNMP Manager API
Indicates that the router sent an SNMP request.
dest
Destination of the request.
community
Community string sent with the request.
retries
Number of times the request has been re-sent.
timeout
Request timeout, or how long the router will wait before resending the request.
mult
Timeout multiplier. The timeout for a re-sent request will be equal to the previous timeout multiplied by the timeout multiplier.
use session rtt
Indicates that the average round-trip time of the session should be used in calculating the timeout value.
userdata
Internal Cisco IOS software data.
debug snmp sync
To debug Simple Network Management Protocol (SNMP) synchronization and faults in synchronization, use the d ebug snmp sync command in privileged EXEC mode. To disable the display of debugging output, use the no form of this command.
Usage Guidelines
The debug snmp sync command can be used to debug SNMP synchronization and faults in synchronization. The standby Route Processor (RP) may sometimes reset as a result of synchronization faults. If the fault occurs when SNMP activities such as SNMP sets are in progress, enter the debug snmp sync command to identify whether a synchronization fault caused the reset.
SNMP synchronizations (dynamic and bulk) are performed only if the router is configured to be in stateful switchover (SSO) mode.
debug snmp tunnel-mib
To enable the debugging for configuring the IP Tunnel Management Information Base (MIB) through Simple Network Management Protocol (SNMP), use the debug snmp tunnel-mib command in privileged EXEC mode. To disable debugging, use the no form of this command.
Command History
Release
Modification
12.2(33)SRB
This command was introduced.
12.4(15)T
This command was integrated into Cisco IOS Release 12.4(15)T.
12.2(33)SB1
This command was integrated into Cisco IOS Release 12.2(33)SB1.
12.2(44)SG
This command was integrated into Cisco IOS Release 12.2(44)SG.
Cisco IOS Release XE 2.1
This command was integrated into Cisco IOS Release XE 2.1.
Usage Guidelines
Use the debug snmp tunnel-mib command to verify whether a tunnel is created or deleted.
Examples
The following is sample output from the debug snmp tunnel-mib command. The output shows that a tunnel is created through SNMP.
Router# debug snmp tunnel-mib
SNMP TUNNEL-MIB debugging is on
k_tunnelInetConfigEntry_get: Entering
k_tunnelInetConfigEntry_get: Exact search
tim_client_tunnel_endpoint_data_get: Entering
tim_client_tunnel_endpoint_data_get: Exact search
tim_client_tunnel_endpoint_data_get: No element found
k_tunnelInetConfigEntry_get: Client service failed
k_tunnelInetConfigEntry_test: Entering
k_tunnelInetConfigEntry_test: Completed
k_tunnelInetConfigEntry_set: Entering
tim_client_tunnel_endpoint_data_get: Entering
tim_client_tunnel_endpoint_data_get: Exact search
tim_client_tunnel_endpoint_data_get: No element found
k_tunnelInetConfigEntry_set: Calling tunnel create
tim_client_tunnel_create: Entering
tim_client_tunnel_create: Completed