Feedback
Contents
debug qbm through debug rudpv1
- debug qbm
- debug qos dsmib error
- debug qos dsmib event
- debug qos dsmib stats
- debug qllc error
- debug qllc event
- debug qllc packet
- debug qllc state
- debug qllc timer
- debug qllc x25
- debug qos accounting
- debug qos ha
- debug radius
- debug radius local-server
- debug radius-proxy
- debug rai
- debug ras
- debug redundancy application group asymmetric-routing
- debug redundancy application group config
- debug redundancy application group faults
- debug redundancy application group media
- debug redundancy application group protocol
- debug redundancy application group rii
- debug redundancy application group transport
- debug redundancy application group vp
- debug redundancy (RP)
- debug redundancy application group config
- debug redundancy application group faults
- debug redundancy application group media
- debug redundancy application group protocol
- debug redundancy application group rii
- debug redundancy application group transport
- debug redundancy application group vp
- debug redundancy as5850
- debug registry
- debug resource policy notification
- debug resource policy registration
- debug resource-pool
- debug rif
- debug route-map ipc
- debug rpms-proc preauth
- debug rtpspi all
- debug rtpspi errors
- debug rtpspi inout
- debug rtpspi send-nse
- debug rtpspi session
- debug rtr error
- debug rtr mpls-lsp-monitor
- debug rtr trace
- debug rtsp
- debug rtsp all
- debug rtsp api
- debug rtsp client
- debug rtsp client session
- debug rtsp error
- debug rtsp pmh
- debug rtsp session
- debug rtsp socket
- debug rudpv1
debug qbm
To display debugging output for quality of service (QoS) bandwidth manager (QBM) options, use the debug qbm command in privileged EXEC mode. To disable debugging output, use the no form of this command.
Usage Guidelines
Use the debug qbm command to troubleshoot QBM behavior.
Examples of client requests are when a client creates or destroys a bandwidth pool and when a client attempts to admit bandwidth into a pool. An example of a notification is when a client’s previously admitted bandwidth gets preempted from a pool.
Examples
The following example shows how to enable the debug qbm apicommand:
Router# debug qbm api
QBM client requests and notifications debugging is on
The following example show how to enable the debug qbm eventscommand:
Router# debug qbm events
QBM pool events debugging is on
The following example shows how to verify that QBM debugging is enabled:
Router# show debug QoS Bandwidth Manager: QBM client requests and notifications debugging is on QBM pool events debugging is ondebug qos dsmib error
To display Quality of Service (QoS) DiffServ MIB errors, use the debug qos dsmib error command in privileged EXEC mode. To disable debugging output, use the no form of this command.
Usage Guidelines
To enable DiffServ MIB support for Qo) policy maps, you use the qos diffservmib command. For complete debug information on QoS DiffServ MIB related errors and events, you can enable additional debugging messages using the debug qos dsmib event and the debug qos dsmib stats commands.
debug qos dsmib event
To enable debugging of Quality of Service (QoS) DiffServ MIB events, use the debug qos dsmib event command in privileged EXEC mode. To disable debugging output, use the no form of this command.
Usage Guidelines
To enable DiffServ MIB support for Qo) policy maps, you use the qos diffservmib command. For complete debug information on QoS DiffServ MIB related errors and events, you can enable additional debugging messages using the debug qos dsmib error and the debug qos dsmib stats commands.
debug qos dsmib stats
To display Quality of Service (QoS) DiffServ MIB statistics, use the debug qos dsmib error command in privileged EXEC mode. To disable debugging output, use the no form of this command.
Usage Guidelines
To enable DiffServ MIB support for Qo) policy maps, you use the qos diffservmib command. For complete debug information on QoS DiffServ MIB related errors and events, you can enable additional debugging messages using the debug qos dsmib error and the debug qos dsmib events commands.
debug qllc error
To display quality link line control (QLLC) errors, use the debug qllc error command in privileged EXEC mode. To disable debugging output, use the no form of this command.
Usage Guidelines
This command helps you track down errors in the QLLC interactions with X.25 networks. Use the debug qllc error command in conjunction with the debug x25 all command to see the connection. The data shown by this command only flows through the router on the X.25 connection. Some forms of this command can generate a substantial amount of output and network traffic.
Examples
The following is sample output from the debug qllc error command:
Router# debug qllc error

%QLLC-3-GENERRMSG: qllc_close - bad qllc pointer Caller 00407116 Caller 00400BD2
QLLC 4000.1111.0002: NO X.25 connection. Discarding XID and calling out
The following line indicates that the QLLC connection was closed:
%QLLC-3-GENERRMSG: qllc_close - bad qllc pointer Caller 00407116 Caller 00400BD2The following line shows the virtual MAC address of the failed connection:
QLLC 4000.1111.0002: NO X.25 connection. Discarding XID and calling outdebug qllc event
To enable debugging of quality link line control (QLLC) events, use the debug qllc eventcommand in privileged EXEC mode. To disable debugging output, use the no form of this command.
Usage Guidelines
Use the debug qllc event command to display primitives that might affect the state of a QLLC connection. An example of these events is the allocation of a QLLC structure for a logical channel indicator when an X.25 call has been accepted with the QLLC call user data. Other examples are the receipt and transmission of LAN explorer and exchange identification (XID) frames.
Examples
The following is sample output from the debug qllc event command:
Router# debug qllc event
QLLC: allocating new qllc lci 9
QLLC: tx POLLING TEST, da 4001.3745.1088, sa 4000.1111.0001
QLLC: rx explorer response, da 4000.1111.0001, sa c001.3745.1088, rif 08B0.1A91.1901.A040
QLLC: gen NULL XID, da c001.3745.1088, sa 4000.1111.0001, rif 0830.1A91.1901.A040, dsap 4, ssap 4
QLLC: rx XID response, da 4000.1111.0001, sa c001.3745.1088, rif 08B0.1A91.1901.A040
The following line indicates that a new QLLC data structure has been allocated:
QLLC: allocating new qllc lci 9The following lines show transmission and receipt of LAN explorer or test frames:
QLLC: tx POLLING TEST, da 4001.3745.1088, sa 4000.1111.0001
QLLC: rx explorer response, da 4000.1111.0001, sa c001.3745.1088, rif 08B0.1A91.1901.A040
The following lines show XID events:
QLLC: gen NULL XID, da c001.3745.1088, sa 4000.1111.0001, rif 0830.1A91.1901.A040, dsap 4, ssap 4
QLLC: rx XID response, da 4000.1111.0001, sa c001.3745.1088, rif 08B0.1A91.1901.A040
debug qllc packet
To display quality link line control (QLLC) events and QLLC data packets, use the debug qllc packet command in privileged EXEC mode. To disable debugging output, use the no form of this command.
Usage Guidelines
This command helps you to track down errors in the QLLC interactions with X.25 networks. The data shown by this command only flows through the router on the X25 connection. Use the debug qllc packet command in conjunction with the debug x25 allcommand to see the connection and the data that flows through the router.
Examples
The following is sample output from the debug qllc packet command:
Router# debug qllc packet

14:38:05: Serial2/5 QLLC I: Data Packet.-RSP    9 bytes.
14:38:07: Serial2/6 QLLC I: Data Packet.-RSP 112 bytes.
14:38:07: Serial2/6 QLLC O: Data Packet. 128 bytes.
14:38:08: Serial2/6 QLLC I: Data Packet.-RSP    9 bytes.
14:38:08: Serial2/6 QLLC I: Data Packet.-RSP 112 bytes.
14:38:08: Serial2/6 QLLC O: Data Packet. 128 bytes.
14:38:08: Serial2/6 QLLC I: Data Packet.-RSP    9 bytes.
14:38:12: Serial2/5 QLLC I: Data Packet.-RSP 112 bytes.
14:38:12: Serial2/5 QLLC O: Data Packet. 128 bytes.
The following lines indicate that a packet was received on the interfaces:
14:38:05: Serial2/5 QLLC I: Data Packet.-RSP    9 bytes.
14:38:07: Serial2/6 QLLC I: Data Packet.-RSP 112 bytes.
The following lines show that a packet was sent on the interfaces:
14:38:07: Serial2/6 QLLC O: Data Packet. 128 bytes.
14:38:12: Serial2/5 QLLC O: Data Packet. 128 bytes.
debug qllc state
To enable debugging of quality link line control (QLLC) events, use the debug qllc statecommand in privileged EXEC mode. To disable debugging output, use the no form of this command.
Usage Guidelines
Use the debug qllc state command to show when the state of a QLLC connection has changed. The typical QLLC connection goes from states ADM to SETUP to NORMAL. The NORMAL state indicates that a QLLC connection exists and is ready for data transfer.
Examples
The following is sample output from the debug qllc state command:
Router# debug qllc state
Serial2 QLLC O: QSM-CMD
Serial2: X25 O D1 DATA (5) Q 8 lci 9 PS 4 PR 3
QLLC: state ADM -> SETUP
Serial2: X25 I D1 RR (3) 8 lci 9 PR 5
Serial2: X25 I D1 DATA (5) Q 8 lci 9 PS 3 PR 5
Serial2 QLLC I: QUA-RSPQLLC: addr 00, ctl 73
QLLC: qsetupstate: recvd qua rsp
QLLC: state SETUP -> NORMAL
The following line indicates that a QLLC connection attempt is changing state from ADM to SETUP:
QLLC: state ADM -> SETUPThe following line indicates that a QLLC connection attempt is changing state from SETUP to NORMAL:
QLLC: state SETUP -> NORMALdebug qllc timer
To display quality link line control (QLLC) timer events, use the debug qllc timer command in privileged EXEC mode. To disable debugging output, use the no form of this command.
Usage Guidelines
The QLLC process periodically cycles and checks status of itself and its partner. If the partner is not found in the desired state, an LAPB primitive command is re-sent until the partner is in the desired state or the timer expires.
Examples
The following is sample output from the debug qllc timer command:
Router# debug qllc timer

14:27:24: Qllc timer lci 257, state ADM retry count 0 Caller 00407116 Caller 00400BD2
14:27:34: Qllc timer lci 257, state NORMAL retry count 0
14:27:44: Qllc timer lci 257, state NORMAL retry count 1
14:27:54: Qllc timer lci 257, state NORMAL retry count 1
The following line of output shows the state of a QLLC partner on a given X.25 logical channel identifier:
14:27:24: Qllc timer lci 257, state ADM retry count 0 Caller 00407116 Caller 00400BD2Other messages are informational and appear every ten seconds.
debug qllc x25
To display X.25 packets that affect a quality link line control (QLLC) connection, use the debugqllcx25 command in privileged EXEC mode. To disable debugging output, use the no form of this command.
Usage Guidelines
This command is helpful to track down errors in the QLLC interactions with X.25 networks. Use the debugqllcx25 command in conjunction with the debugx25eventsordebugx25allcommands to see the X.25 events between the router and its partner.
Examples
The following is sample output from the debugqllcx25 command:
Router# debug qllc x25

15:07:23: QLLC X25 notify lci 257 event 1
15:07:23: QLLC X25 notify lci 257 event 5
15:07:34: QLLC X25 notify lci 257 event 3 Caller 00407116 Caller 00400BD2
15:07:35: QLLC X25 notify lci 257 event 4
The following table describes the significant fields shown in the display.
debug qos accounting
To enable debugging for Quality of Service (QoS) accounting, use the debug qos accounting command in privileged EXEC mode. To disable debugging, use the no form of this command.
Usage Guidelines
When QoS policy accounting is enabled on the router, you can use the debug qos accounting command to display debugging and troubleshooting information.
Examples
The following example shows how to enable QoS accounting error debugging:
Router# debug qos accounting error
QoS accounting error debugging is on
The following shows how to disable QoS accounting error debugging:
Router# no debug qos accounting error
QoS accounting error debugging is off
The following is sample output from the debug qos accounting ha command:
Router# debug qos accounting ha
*Nov 14 11:12:40.315: PAC CCM HA: [12] add handle: 42000001
*Nov 14 11:12:40.315: PAC CCM HA: found COA cluster handle: 3
*Nov 14 11:12:40.315: PAC CCM HA: [12] set dyn sess required: 42000001 3 1
*Nov 14 11:12:40.315: PAC CCM HA: found COA cluster handle: 3
*Nov 14 11:12:40.315: PAC CCM HA: [12] aaa create flow: 42000001 3 0
*Nov 14 11:12:40.315: PAC CCM HA: found COA cluster handle: 3
*Nov 14 11:12:40.315: PAC CCM HA: [12] dyn sess ready: 42000001 3 1
*Nov 14 11:12:40.315: PAC CCM HA: [12] session sets to periodic updates
*Nov 14 11:12:40.316: PAC CCM HA: [12] get dynsess sync info: items 1, length 58 NAS#
*Nov 14 11:12:40.316: PAC CCM HA: [12] add all dynsess sync data - max 58
*Nov 14 11:12:40.316: PAC CCM HA: Pulling latest statistics from c3pl beforesync
*Nov 14 11:12:40.316: PAC CCM HA: Collecting HA stats from 2 instances
*Nov 14 11:12:40.316: PAC CCM HA: Collecting HA stats dir input  bytes 0 packets 0
*Nov 14 11:12:40.316: PAC CCM HA: Collecting HA stats dir output  bytes 0 packets 0
*Nov 14 11:12:40.316: PAC CCM HA: xmit xform message type 1
*Nov 14 11:12:40.316: PAC CCM HA: [12] added 58 of dynsess sync CCM data, max 58
The following is sample output from the debug qos accounting event command:
Router# debug qos accounting event *Nov 14 11:10:33.654: pac: Same group-list mapping is entered *Nov 14 11:10:33.654: pac: Existing group-list mapping with turbo-service><_GRP default *Nov 14 11:10:33.656: %SYS-5-CONFIG_I: Configured from console by tty64 *Nov 14 11:10:33.660: pac: event=CLASS_ADD if_info=2A99BC9DB0 cid=0 dir=0 AAA uid=12 *Nov 14 11:10:33.660: pac: Enabling accounting on a class cid: 0 global-parent: [-1 -1 -1 -1] dir: 0 *Nov 14 11:10:33.660: pac: Inserting session 12 into wavl tree *Nov 14 11:10:33.660: pac: Creating context for group *Nov 14 11:10:33.660: pac: Added first instance to AAA id: 0xC, group: turbo-service><_GRP *Nov 14 11:10:33.660: pac: Setting coa_push_mode for context 0x2A99CED228 *Nov 14 11:10:33.660: pac: Updating initial stats dir input bytes 0 packets 0 *Nov 14 11:10:33.661: pac: Username inherited for AAA flow Id *Nov 14 11:10:33.661: pac: Successfully allocated flow hdl 0x2A000001, id 1 for AAA id 0xC *Nov 14 11:10:33.661: pac: CoA progressing, WAIT_FOR_COA_ACK, aaa_id 0xC *Nov 14 11:10:33.662: pac: event=CLASS_ADD if_info=2A99BC9D28 cid=0 dir=1 AAA uid=12 *Nov 14 11:10:33.662: pac: Enabling accounting on a class cid: 0 global-parent: [-1 -1 -1 -1] dir: 1 *Nov 14 11:10:33.662: pac: Adding instance to AAA id: 0xC, group: turbo-service><_GRP *Nov 14 11:10:33.662: pac: Setting coa_push_mode for context 0x2A99CED228 *Nov 14 11:10:33.662: pac: Updating initial stats dir output bytes 0 packets 0 *Nov 14 11:10:33.663: pac: Preparing to send service start 0xC 0x2A000001 NAS# *Nov 14 11:10:33.663: pac: Adding session and service static attributes *Nov 14 11:10:33.663: pac: Service name Nturbo-service() returned with group turbo-service><_GRP *Nov 14 11:10:33.663: pac: Configuration: template *Nov 14 11:10:33.663: pac: Sending Start ... *Nov 14 11:10:33.663: peruser_acct_callback: Transmitted group in WAIT_FOR_COA_ACK, context 0x2A99CED228debug qos ha
debug radius
To enable debugging for Remote Authentication Dial-In User Service (RADIUS) configuration, use the debug radius command in privileged EXEC mode. To disable debugging, use the no form of this command.
debug radius [ accounting | authentication | brief | elog | failover | retransmit | verbose ]
no debug radius [ accounting | authentication | brief | elog | failover | retransmit | verbose ]
Syntax Description
accounting
(Optional) Enables debugging of RADIUS accounting collection.
authentication
(Optional) Enables debugging of RADIUS authentication packets.
brief
(Optional) Displays abbreviated debug output.
elog
(Optional) Enables RADIUS event logging.
failover
(Optional) Enables debugging of packets sent upon failover.
retransmit
(Optional) Enables retransmission of packets.
verbose
(Optional) Displays detailed debug output.
Command History
Release
Modification
11.2(1)T
This command was introduced.
12.0(2)T
The brief keyword was added. The default output format became ASCII from hexadecimal.
12.2(11)T
The verbose keyword was added.
12.3(2)T
The elog keyword was added.
12.2(33)SRA
This command was integrated into Cisco IOS Release 12.2(33)SRA.
12.2SX
This command is supported in the Cisco IOS Release 12.2SX train. Support in a specific 12.2SX release of this train depends on your feature set, platform, and platform hardware.
Usage Guidelines
RADIUS is a distributed security system that secures networks against unauthorized access. Cisco supports RADIUS under the authentication, authorization, and accounting (AAA) security system. When RADIUS is used on the router, you can use the debug radius command to display debugging and troubleshooting information in ASCII format. Use the debug radius brief command for abbreviated output displaying client/server interaction and minimum packet information. Only the input and output transactions are recorded. Use the debug radius verbose command to include non-essential RADIUS debugs.
Examples
The following is sample output from the debug radius command:
Router# debug radius
Radius protocol debugging is on
Radius packet hex dump debugging is off
Router# show debug
00:19:20: RADIUS/ENCODE(00000015):Orig. component type = AUTH_PROXY
00:19:20: RADIUS(00000015): Config NAS IP: 0.0.0.0
00:19:20: RADIUS/ENCODE(00000015): acct_session_id: 21
00:19:20: RADIUS(00000015): sending
00:19:20: RADIUS/ENCODE: Best Local IP-Address 33.0.0.2 for Radius-Server 33.2.0.1
00:19:20: RADIUS(00000015): Send Access-Request to 33.2.0.1:1645 id 1645/21, len 159
00:19:20: RADIUS:  authenticator 2D 03 E5 A6 A5 30 1A 32 - F2 C5 EE E2 AC 5E 5D 22
00:19:20: RADIUS:  User-Name           [1]   11  "authproxy"
00:19:20: RADIUS:  User-Password       [2]   18  *
00:19:20: RADIUS:  Service-Type        [6]   6   Outbound                  [5]
00:19:20: RADIUS:  Message-Authenticato[80]  18
00:19:20: RADIUS:   85 EF E8 43 03 88 58 63 78 D2 7B E7 26 61 D3 3C          [ CXcx{&a<]
00:19:20: RADIUS:  Vendor, Cisco       [26]  49
00:19:20: RADIUS:   Cisco AVpair       [1]   43  "audit-session-id=0D00000200000013001112FD"
00:19:20: RADIUS:  NAS-Port-Type       [61]  6   Ethernet                  [15]
00:19:20: RADIUS:  NAS-Port            [5]   6   16480
00:19:20: RADIUS:  NAS-Port-Id         [87]  19  "FastEthernet1/0/3"
00:19:20: RADIUS:  NAS-IP-Address      [4]   6   33.0.0.2
00:19:20: RADIUS(00000015): Started 5 sec timeout
00:19:20: RADIUS: Received from id 1645/21 33.2.0.1:1645, Access-Accept, len 313
00:19:20: RADIUS:  authenticator E6 6E 1D 64 5A 15 FD AE - C9 60 C0 68 F5 10 E9 B7
00:19:20: RADIUS:  Filter-Id           [11]  8
00:19:20: RADIUS:   31 30 30 2E 69 6E            [ 100.in]
00:19:20: RADIUS:  Vendor, Cisco       [26]  19
00:19:20: RADIUS:   Cisco AVpair       [1]   13  "priv-lvl=15"
00:19:20: RADIUS:  Termination-Action  [29]  6   1
00:19:20: RADIUS:  Vendor, Cisco       [26]  45
00:19:20: RADIUS:   Cisco AVpair       [1]   39  "supplicant-name=Port-description test"
00:19:20: RADIUS:  Vendor, Cisco       [26]  38
00:19:20: RADIUS:   Cisco AVpair       [1]   32  "security-group-tag=2468-C0FFEE"
00:19:20: RADIUS:  Vendor, Cisco       [26]  33
00:19:20: RADIUS:   Cisco AVpair       [1]   27  "supplicant-group=engineer"
00:19:20: RADIUS:  Vendor, Cisco       [26]  36
00:19:20: RADIUS:   Cisco AVpair       [1]   30  "supplicant-group=idf_testing"
00:19:20: RADIUS:  Vendor, Cisco       [26]  28
00:19:20: RADIUS:   Cisco AVpair       [1]   22  "authz-directive=open"
00:19:20: RADIUS:  Vendor, Cisco       [26]  32
00:19:20: RADIUS:   Cisco AVpair       [1]   26  "supplicant-group=group-9"
00:19:20: RADIUS:  Class               [25]  30
00:19:20: RADIUS:   43 41 43 53 3A 63 2F 61 37 31 38 38 61 2F 32 31  [CACS:c/a7188a/21]
00:19:20: RADIUS:   30 30 30 30 30 32 2F 31 36 34 38 30      [ 000002/16480]
00:19:20: RADIUS:  Message-Authenticato[80]  18
00:19:20: RADIUS:   24 13 29 95 A1 5E 9F D3 CB ED 78 F1 F6 62 2B E3            [ $)^xb+]
00:19:20: RADIUS(00000015): Received from id 1645/21
00:19:20: RADIUS/DECODE: parse unknown cisco vsa "supplicant-group" - IGNORE
00:19:20: RADIUS/DECODE: parse unknown cisco vsa "supplicant-group" - IGNORE
00:19:20: RADIUS/DECODE: parse unknown cisco vsa "authz-directive" - IGNORE
00:19:20: RADIUS/DECODE: parse unknown cisco vsa "supplicant-group" - IGNORE
00:19:20: RADIUS/ENCODE(00000015):Orig. component type = AUTH_PROXY
00:19:20: RADIUS(00000015): Config NAS IP: 0.0.0.0
00:19:20: RADIUS(00000015): sending
00:19:20: RADIUS/ENCODE: Best Local IP-Address 33.0.0.2 for Radius-Server 33.2.0.1
00:19:20: RADIUS(00000015): Send Accounting-Request to 33.2.0.1:1646 id 1646/1, len 204
00:19:20: RADIUS:  authenticator A7 6B A0 94 F4 63 30 51 - 8A CE 8C F4 8A 8E 0B CC
00:19:20: RADIUS:  Acct-Session-Id     [44]  10  "00000015"
00:19:20: RADIUS:  Calling-Station-Id  [31]  10  "13.1.0.1"
00:19:20: RADIUS:  Vendor, Cisco       [26]  49
00:19:20: RADIUS:   Cisco AVpair       [1]   43  "audit-session-id=0D00000200000013001112FD"
The following is sample output from the debug radius brief command:
Router# debug radius brief
Radius protocol debugging is on
Radius packet hex dump debugging is off
Radius protocol in brief format debugging is on
00:05:21: RADIUS: Initial Transmit ISDN 0:D:23 id 6 10.0.0.1:1824, Accounting-Request, len 358
00:05:21: %ISDN-6-CONNECT: Interface Serial0:22 is now connected to 4085274206
00:05:26: RADIUS: Retransmit id 6
00:05:31: RADIUS: Tried all servers.
00:05:31: RADIUS: No valid server found. Trying any viable server
00:05:31: RADIUS: Tried all servers.
00:05:31: RADIUS: No response for id 7
00:05:31: RADIUS: Initial Transmit ISDN 0:D:23 id 8 10.0.0.0:1823, Access-Request, len 171
00:05:36: RADIUS: Retransmit id 8
00:05:36: RADIUS: Received from id 8 1.7.157.1:1823, Access-Accept, len 115
00:05:47: %ISDN-6-DISCONNECT: Interface Serial0:22 disconnected from 4085274206, call lasted 26 seconds
00:05:47: RADIUS: Initial Transmit ISDN 0:D:23 id 9 10.0.0.1:1824, Accounting-Request, len 775
00:05:47: RADIUS: Received from id 9 1.7.157.1:1824, Accounting-response, len 20
The following example shows how to enable debugging of RADIUS accounting collection:
Router# debug radius accounting Radius protocol debugging is on Radius protocol brief debugging is off Radius protocol verbose debugging is off Radius packet hex dump debugging is off Radius packet protocol (authentication) debugging is off Radius packet protocol (accounting) debugging is on Radius packet retransmission debugging is off Radius server fail-over debugging is off Radius elog debugging is offdebug radius local-server
To control the display of debug messages for the local authentication server, use the debug radius local-servercommand in privileged EXEC mode. To disable debugging output, use the no form of this command.
debug radius local-server { client | error | packets }
no debug radius local-server { client | error | packets }
Command History
Release
Modification
12.2(11)JA
This command was introduced on Cisco Aironet Access Point 1200 and Cisco Aironet Access Point 1100.
12.3(11)T
This command was implemented on the following platforms: Cisco 2600XM, Cisco 2691, Cisco 2811, Cisco 2821, Cisco 2851, Cisco 3700, and Cisco 3800 series routers.
12.4(2)T
This command was integrated into Cisco IOS Release 12.4(2)T.
12.2SX
This command is supported in the Cisco IOS Release 12.2SX train. Support in a specific 12.2SX release of this train depends on your feature set, platform, and platform hardware.
Usage Guidelines
Use this command to control the display of debug messages for the local authentication server.
Examples
The following command shows how to display messages regarding failed client authentication:
Router# debug radius local-server
 client
Related Commands
Command
Description
clear radius local-server
Clears the statistics display or unblocks a user.
show radius local-server statistics
Displays statistics for a local network access server.
ssid
Specifies up to 20 SSIDs to be used by a user group.
user
Authorizes a user to authenticate using the local authentication server.
vlan
Specifies a VLAN to be used by members of a user group.
debug radius-proxy
To display debugging messages for Intelligent Services Gateway (ISG) RADIUS proxy functionality, use the debug radius-proxycommand in privileged EXEC mode. To disable debugging, use the no form of this command.
Usage Guidelines
See the following caution before using debug commands.
Caution
Because debugging output is assigned high priority in the CPU process, it can render the system unusable. For this reason, only use debug commands to troubleshoot specific problems or during troubleshooting sessions with Cisco technical support staff. Moreover, it is best to use debug commands during periods of lower network flows and fewer users.
Examples
The following example shows output for the debug radius-proxy command with the events keyword:
Router# debug radius-proxy events
*Nov  7 07:53:11.411: RP-EVENT: Parse Request: Username = 12345679@cisco
*Nov  7 07:53:11.411: RP-EVENT: Parse Request: Caller ID = 12345679@cisco
*Nov  7 07:53:11.411: RP-EVENT: Parse Request: NAS id = localhost
*Nov  7 07:53:11.411: RP-EVENT: Found matching context for user Caller ID:12345679@cisco  Name:aa
*Nov  7 07:53:11.411: RP-EVENT: Received event client Access-Request in state activated
*Nov  7 07:53:11.411: RP-EVENT: User Caller ID:12345679@cisco  Name:12 re-authenticating
*Nov  7 07:53:11.411: RP-EVENT: Forwarding Request to method list (handle=1979711512)
*Nov  7 07:53:11.411: RP-EVENT: Sending request to server group EAP
*Nov  7 07:53:11.411: RP-EVENT: State changed activated --> wait for Access-Response
debug rai
To enable debugging for Resource Allocation Indication (RAI), use the debug rai command in privileged EXEC mode. To disable debugging for RAI, use the no form of this command.
Usage Guidelines
You can use the debug rai command along with the debug ccsip all command to get the complete debugging information for RAI.
Examples
The following example shows how to enable resource allocation debugging:
Router# debug rai
Resource Availability debugging is on
*Dec 16 05:50:34.863: //1/rai_new_resource_index:New index created 1
*Dec 16 05:50:34.863: //1/rai_main:- event code:7
*Dec 16 05:50:34.863: //1/rai_process_new_rsc_group:New Resource Index created
*Dec 16 05:50:34.907: //1/rai_set_resource_info_config:Resource type 0
*Dec 16 05:50:34.907: //1/rai_set_resource_info_config:New system resource created 0x4961A38C
*Dec 16 05:50:34.907: //1/rai_set_resource_info_config:Resource New Config Event passed
*Dec 16 05:50:34.907: //1/rai_set_resource_info_config:Resource Type CPU Subtype 1-min-avg Low watermark 30High watermark 50
*Dec 16 05:50:34.907: //1/rai_main:- event code:4
Related Commands
Command
Description
periodic-report interval
Configures periodic reporting parameters for gateway resource entities.
rai target
Configures the SIP RAI mechanism.
resource (voice)
Configures parameters for monitoring resources, use the resource command in voice-class configuration mode.
show voice class resource-group
Displays the resource group configuration information for a specific resource group or all resource groups.
voice class resource-group
Enters voice-class configuration mode and assigns an identification tag number for a resource group.
debug ras
To display the types and addressing of Registration, Admission and Status (RAS) messages sent and received, use the debug ras command in privileged EXEC mode. To disable debugging output, use the no form of this command.
Usage Guidelines
Use the debug ras command to display the types and addressing of RAS messages sent and received. The debug output lists the message type using mnemonics defined in International Telecommunications Union-Telecommunication (ITU-T) specification H.225.
Examples
In the following output, gateway GW13.cisco.com sends a RAS registration request (RRQ) message to gatekeeper GK15.cisco.com at IP address 10.9.53.15. GW13.cisco.com then receives a registration confirmation (RCF) message from the gatekeeper. If there is no response, it could mean that the gatekeeper is offline or improperly addressed. If you receive a reject (RRJ) message, it could mean that the gatekeeper is unable to handle another gateway or that the registration information is incorrect.
Router# debug ras

*Mar 13 19:53:34.231:      RASlib::ras_sendto:msg length 105 from
                            10.9.53.13:8658 to 10.9.53.15:1719
*Mar 13 19:53:34.231:      RASLib::RASSendRRQ:RRQ (seq# 36939) sent
                            to 10.9.53.15
*Mar 13 19:53:34.247:      RASLib::RASRecvData:successfully rcvd
                            message of length 105 from 10.9.53.15:1719
*Mar 13 19:53:34.251:      RASLib::RASRecvData:RCF (seq# 36939) rcvd
                            from [10.9.53.15:1719] on sock [0x6168356C]
debug redundancy application group asymmetric-routing
To log debug information for an asymmetric routing redundancy application group, use the debug redundancy application group asymmetric-routing command in privileged EXEC mode. To disable the debug log, use the no form of this command.
debug redundancy application group asymmetric-routing [ error | peer | tunnel ]
no debug redundancy application group asymmetric-routing [ error | peer | tunnel ]
Examples
The following is sample output from the debug redundancy application group asymmetric-routing peer command:
On standby :
*Mar  6 20:57:25.996: RG-AR-PEER: RG AR:group 1 start negotiation timer
*Mar  6 20:57:26.006: RG-AR-PEER: RG AR:group 1 stop negotiation timer
*Mar  6 20:57:26.006: RG-AR-PEER: RG AR:group 1 transport negotiated

On Active:
*Mar  6 20:57:26.006: RG-AR-PEER: RG AR:group 1 stop negotiation timer
*Mar  6 20:57:26.006: RG-AR-PEER: RG AR:group 1 transport negotiated
The following is sample output from the debug redundancy application group asymmetric-routing tunnel command:
On standby: *Mar 6 20:52:25.886: RG-AR-TUNNEL: encap packet(len 114) for redirection, orig pak encsize 14 *Mar 6 20:52:25.886: RG-AR-TUNNEL: packet(len 132) redirected successfully for feature (1) from rii (1000) group (1) On Active: Case 1: CEF enabled *Mar 6 20:52:25.887: RG-AR-TUNNEL: packet(len 146) received in CEF path *Mar 6 20:52:25.887: RG-AR-TUNNEL: packet received for group (1) rii (1000) forwarded using parent idb Ethernet1/3 Case 2: CEF disabled) *Mar 6 20:54:45.449: RG-AR-TUNNEL: packet(len 100) received for group (1) rii (1000 Ethernet1/3) from standby received in process pathdebug redundancy application group config
To display the redundancy application group configuration, use the debug redundancy application group configcommand in privileged EXEC mode. To disable debugging output, use the no form of this command.
debug redundancy application group config { all | error | event | func }
no debug redundancy application group config { all | error | event | func }
Examples
The following is sample output from the debug redundancy application group config allcommand:
Router# debug redundancy application group config all

RG config all debugging is on
Related Commands
Command
Description
debug redundancy application group media
Displays the redundancy application group media information.
debug redundancy application group protocol
Displays the redundancy application group protocol information.
debug redundancy application group rii
Displays the redundancy application group RII information.
debug redundancy application group transport
Displays the redundancy application group transport information.
debug redundancy application group vp
Displays the redundancy application group VP information.
debug redundancy application group faults
To display the redundancy application group faults, use the debug redundancy application group faultscommand in privileged EXEC mode. To disable debugging output, use the no form of this command.
debug redundancy application group faults { all | error | event | fault | func }
no debug redundancy application group faults { all | error | event | fault | func }
Examples
The following is sample output from the debug redundancy application group faults errorcommand:
Router# debug redundancy application group faults error
RG Faults error debugging is on
Related Commands
Command
Description
debug redundancy application group config
Displays the redundancy application group configuration.
debug redundancy application group media
Displays the redundancy application group media information.
debug redundancy application group protocol
Displays the redundancy application group protocol information.
debug redundancy application group rii
Displays the redundancy application group RII information.
debug redundancy application group transport
Displays the redundancy group application group transport information.
debug redundancy application group vp
Displays the redundancy group application group VP information.
debug redundancy application group media
To display the redundancy application group media information, use the debug redundancy application group mediacommand in privileged EXEC mode. To disable debugging output, use the no form of this command.
debug redundancy application group media { all | error | event | nbr | packet { rx | tx } | timer }
no debug redundancy application group media { all | error | event | nbr | packet { rx | tx } | timer }
Syntax Description
all
Displays media information of a redundancy group.
error
Displays media error information of a redundancy group.
event
Displays media events information of a redundancy group.
nbr
Displays media neighbor (nbr) information of a redundancy group.
packet
Displays media packets information of a redundancy group.
rx
Displays the incoming packets information.
tx
Displays the outgoing packets information.
timer
Displays information about redundancy group media timer events.
Examples
The following is sample output from the debug redundancy application group media timercommand:
Router# debug redundancy application group media timer
RG Media timer debugging is on
Related Commands
Command
Description
debug redundancy application group config
Displays the redundancy group application configuration.
debug redundancy application group protocol
Displays the redundancy group application group protocol information.
debug redundancy application group rii
Displays the redundancy group application group RII information.
debug redundancy application group transport
Displays the redundancy group application group transport information.
debug redundancy application group vp
Displays the redundancy application group VP information.
debug redundancy application group protocol
To display the redundancy application group protocol information, use the debug redundancy application group protocolcommand in privileged EXEC mode. To disable debugging output, use the no form of this command.
debug redundancy application group protocol { all | detail | error | event | media | peer }
no debug redundancy application group protocol { all | detail | error | event | media | peer }
Syntax Description
all
Displays protocol information of a redundancy group.
detail
Displays event details of a redundancy group.
error
Displays protocol error information of a redundancy group.
event
Displays protocol events information of a redundancy group.
media
Displays protocol media events information of a redundancy group.
peer
Displays protocol peer information of a redundancy group.
Examples
The following is sample output from the debug redundancy application group protocol peercommand:
Router# debug redundancy application group protocol peer

RG Protocol peer debugging is on
Related Commands
Command
Description
debug redundancy application group config
Displays the redundancy group application configuration.
debug redundancy application group media
Displays the redundancy application group media information.
debug redundancy application group protocol
Displays the redundancy application group protocol information.
debug redundancy application group rii
Displays the redundancy application group RII information.
debug redundancy application group transport
Displays the redundancy application group transport information.
debug redundancy application group vp
Displays the redundancy application group VP information.
debug redundancy application group rii
To display the redundancy application group redundancy interface identifier (RII) information, use the debug redundancy application group riicommand in privileged EXEC mode. To disable debugging output, use the no form of this command.
debug redundancy application group rii { error | event }
no debug redundancy application group rii { error | event }
Examples
The following is sample output from the debug redundancy application group rii eventcommand:
Router# debug redundancy application group rii event

RG RII events debugging is on
Related Commands
Command
Description
debug redundancy application group config
Displays the redundancy group application configuration.
debug redundancy application group media
Displays the redundancy application group media information.
debug redundancy application group protocol
Displays the redundancy group application group protocol information.
debug redundancy application group vp
Displays the redundancy group application group VP information.
debug redundancy application group transport
To display the redundancy application group transport information, use the debug redundancy application group transportcommand in privileged EXEC mode. To disable debugging output, use the no form of this command.
debug redundancy application group transport { db | error | event | packet | timer | trace }
no debug redundancy application group transport { db | error | event | packet | timer | trace }
Syntax Description
db
Displays transport information of a redundancy group.
error
Displays transport error information of a redundancy group.
event
Displays transport event information of a redundancy group.
packet
Displays transport packet information of a redundancy group.
timer
Displays transport timer information of a redundancy group.
trace
Displays transport trace information of a redundancy group.
Examples
The following is sample output from the debug redundancy application group transport tracecommand:
Router# debug redundancy application group transport trace
RG Transport trace debugging is on
Related Commands
Command
Description
debug redundancy application group config
Displays the redundancy group application configuration.
debug redundancy application group media
Displays the redundancy application group media information.
debug redundancy application group protocol
Displays the redundancy application group protocol information.
debug redundancy application group rii
Displays the redundancy application group RII information.
debug redundancy application group vp
To display the redundancy application group virtual platform (VP) information, use the debug redundancy application group vpcommand in privileged EXEC mode. To disable debugging output, use the no form of this command.
debug redundancy application group vp { error | event }
no debug redundancy application group vp { error | event }
Examples
The following is sample output from the debug redundancy application group vp eventcommand:
Router# debug redundancy application group vp event

RG VP events debugging is on
Related Commands
Command
Description
debug redundancy application group config
Displays the redundancy group application configuration.
debug redundancy application group media
Displays the redundancy application group media information.
debug redundancy application group protocol
Displays the redundancy application group protocol information.
debug redundancy application group rii
Displays the redundancy application group RII information.
debug redundancy application group transport
Displays the redundancy application group transport information.
debug redundancy (RP)
To enable the display of events for troubleshooting dual Route Processors (RPs), use the debug redundancycommand in privileged EXEC mode. To disable the display of debugging output, use the no form of this command.
debug redundancy { ehsa | errors | fsm | kpa | msg | progression | status | timer }
no debug redundancy { ehsa | errors | fsm | kpa | msg | progression | status | timer }
Syntax Description
ehsa
Displays redundancy facility (RF) enhanced high system availability (EHSA) information.
errors
Displays RF errors.
fsm
Displays RF feasible successor metrics (FSM) events.
kpa
Displays RF keepalive events.
msg
Displays RF messaging events.
progression
Displays RF progression events.
status
Displays RF status events.
timer
Displays RF timer events.
Command History
Release
Modification
11.3(6)AA
This command was introduced.
12.0(15)ST
This command was introduced on Cisco 10000 series Internet routers.
12.0(22)S
This command was introduced on Cisco 7500, 10000, and 12000 series Internet routers.
12.2(18)S
This command was integrated into Cisco IOS Release 12.2(18)S on Cisco 7500 series routers.
12.2(20)S
Support was added for the Cisco 7304 router. The Cisco 7500 series router is not supported in Cisco IOS Release 12.2(20)S.
12.2(28)SB
Support for this command was integrated into Cisco IOS Release 12.2(28)SB.
12.2(33)SRA
This command was integrated into Cisco IOS Release 12.2(33)SRA.
debug redundancy application group config
To display the redundancy application group configuration, use the debug redundancy application group configcommand in privileged EXEC mode. To disable debugging output, use the no form of this command.
debug redundancy application group config { all | error | event | func }
no debug redundancy application group config { all | error | event | func }
Examples
The following is sample output from the debug redundancy application group config allcommand:
Router# debug redundancy application group config all

RG config all debugging is on
Related Commands
Command
Description
debug redundancy application group media
Displays the redundancy application group media information.
debug redundancy application group protocol
Displays the redundancy application group protocol information.
debug redundancy application group rii
Displays the redundancy application group RII information.
debug redundancy application group transport
Displays the redundancy application group transport information.
debug redundancy application group vp
Displays the redundancy application group VP information.
debug redundancy application group faults
To display the redundancy application group faults, use the debug redundancy application group faultscommand in privileged EXEC mode. To disable debugging output, use the no form of this command.
debug redundancy application group faults { all | error | event | fault | func }
no debug redundancy application group faults { all | error | event | fault | func }
Examples
The following is sample output from the debug redundancy application group faults errorcommand:
Router# debug redundancy application group faults error
RG Faults error debugging is on
Related Commands
Command
Description
debug redundancy application group config
Displays the redundancy application group configuration.
debug redundancy application group media
Displays the redundancy application group media information.
debug redundancy application group protocol
Displays the redundancy application group protocol information.
debug redundancy application group rii
Displays the redundancy application group RII information.
debug redundancy application group transport
Displays the redundancy group application group transport information.
debug redundancy application group vp
Displays the redundancy group application group VP information.
debug redundancy application group media
To display the redundancy application group media information, use the debug redundancy application group mediacommand in privileged EXEC mode. To disable debugging output, use the no form of this command.
debug redundancy application group media { all | error | event | nbr | packet { rx | tx } | timer }
no debug redundancy application group media { all | error | event | nbr | packet { rx | tx } | timer }
Syntax Description
all
Displays media information of a redundancy group.
error
Displays media error information of a redundancy group.
event
Displays media events information of a redundancy group.
nbr
Displays media neighbor (nbr) information of a redundancy group.
packet
Displays media packets information of a redundancy group.
rx
Displays the incoming packets information.
tx
Displays the outgoing packets information.
timer
Displays information about redundancy group media timer events.
Examples
The following is sample output from the debug redundancy application group media timercommand:
Router# debug redundancy application group media timer
RG Media timer debugging is on
Related Commands
Command
Description
debug redundancy application group config
Displays the redundancy group application configuration.
debug redundancy application group protocol
Displays the redundancy group application group protocol information.
debug redundancy application group rii
Displays the redundancy group application group RII information.
debug redundancy application group transport
Displays the redundancy group application group transport information.
debug redundancy application group vp
Displays the redundancy application group VP information.
debug redundancy application group protocol
To display the redundancy application group protocol information, use the debug redundancy application group protocolcommand in privileged EXEC mode. To disable debugging output, use the no form of this command.
debug redundancy application group protocol { all | detail | error | event | media | peer }
no debug redundancy application group protocol { all | detail | error | event | media | peer }
Syntax Description
all
Displays protocol information of a redundancy group.
detail
Displays event details of a redundancy group.
error
Displays protocol error information of a redundancy group.
event
Displays protocol events information of a redundancy group.
media
Displays protocol media events information of a redundancy group.
peer
Displays protocol peer information of a redundancy group.
Examples
The following is sample output from the debug redundancy application group protocol peercommand:
Router# debug redundancy application group protocol peer

RG Protocol peer debugging is on
Related Commands
Command
Description
debug redundancy application group config
Displays the redundancy group application configuration.
debug redundancy application group media
Displays the redundancy application group media information.
debug redundancy application group protocol
Displays the redundancy application group protocol information.
debug redundancy application group rii
Displays the redundancy application group RII information.
debug redundancy application group transport
Displays the redundancy application group transport information.
debug redundancy application group vp
Displays the redundancy application group VP information.
debug redundancy application group rii
To display the redundancy application group redundancy interface identifier (RII) information, use the debug redundancy application group riicommand in privileged EXEC mode. To disable debugging output, use the no form of this command.
debug redundancy application group rii { error | event }
no debug redundancy application group rii { error | event }
Examples
The following is sample output from the debug redundancy application group rii eventcommand:
Router# debug redundancy application group rii event

RG RII events debugging is on
Related Commands
Command
Description
debug redundancy application group config
Displays the redundancy group application configuration.
debug redundancy application group media
Displays the redundancy application group media information.
debug redundancy application group protocol
Displays the redundancy group application group protocol information.
debug redundancy application group vp
Displays the redundancy group application group VP information.
debug redundancy application group transport
To display the redundancy application group transport information, use the debug redundancy application group transportcommand in privileged EXEC mode. To disable debugging output, use the no form of this command.
debug redundancy application group transport { db | error | event | packet | timer | trace }
no debug redundancy application group transport { db | error | event | packet | timer | trace }
Syntax Description
db
Displays transport information of a redundancy group.
error
Displays transport error information of a redundancy group.
event
Displays transport event information of a redundancy group.
packet
Displays transport packet information of a redundancy group.
timer
Displays transport timer information of a redundancy group.
trace
Displays transport trace information of a redundancy group.
Examples
The following is sample output from the debug redundancy application group transport tracecommand:
Router# debug redundancy application group transport trace
RG Transport trace debugging is on
Related Commands
Command
Description
debug redundancy application group config
Displays the redundancy group application configuration.
debug redundancy application group media
Displays the redundancy application group media information.
debug redundancy application group protocol
Displays the redundancy application group protocol information.
debug redundancy application group rii
Displays the redundancy application group RII information.
debug redundancy application group vp
To display the redundancy application group virtual platform (VP) information, use the debug redundancy application group vpcommand in privileged EXEC mode. To disable debugging output, use the no form of this command.
debug redundancy application group vp { error | event }
no debug redundancy application group vp { error | event }
Examples
The following is sample output from the debug redundancy application group vp eventcommand:
Router# debug redundancy application group vp event

RG VP events debugging is on
Related Commands
Command
Description
debug redundancy application group config
Displays the redundancy group application configuration.
debug redundancy application group media
Displays the redundancy application group media information.
debug redundancy application group protocol
Displays the redundancy application group protocol information.
debug redundancy application group rii
Displays the redundancy application group RII information.
debug redundancy application group transport
Displays the redundancy application group transport information.
debug redundancy as5850
To enable specific redundancy-related debug options, use the debug redundancy as5850command in privileged EXEC mode. To disable debugging output, use the no form of this command.
Usage Guidelines
Use the master form of the command to view redundancy-related debug entries. All debug entries continue to be logged even if you do not specify an option here, and you can always use the show redundancy debug-log command to view them.
debug registry
To turn on the debugging output for registry events or errors when Cisco IOS Software Modularity software is running, use the debug registry command in privileged EXEC mode. To turn off debugging output, use the no form of this command or the undebugcommand.
debug registry { events | errors } [ process-name | pid ]
no debug registry { events | errors } [ process-name | pid ]
Usage Guidelines
Use the debug registry command to troubleshoot Software Modularity registry operations.
Caution
Use any debugging command with caution because the volume of generated output can slow or stop the router operations. We recommend that this command be used only under the supervision of a Cisco engineer.
Examples
The following example turns on debugging messages for Software Modularity registry events for the TCP process:
Router# debug registry events tcp.proc
Debug registry events debugging is on
The following example turns on debugging messages for Software Modularity registry errors:
Router# debug registry errors
Debug registry errors debugging is on
debug resource policy notification
To trace the Embedded Resource Manager (ERM) notification activities for resources using the ERM feature, use the debug resource policy notification command in privileged EXEC mode. To disable debugging output, use the no form of this command.
debug resource policy notification [ owner resource-owner-name ]
no debug resource policy notification [ owner resource-owner-name ]
Command History
Release
Modification
12.3(14)T
This command was introduced.
12.2(33)SRB
This command was integrated into Cisco IOS Release 12.2(33)SRB.
12.2SX
This command is supported in the Cisco IOS Release 12.2SX train. Support in a specific 12.2SX release of this train depends on your feature set, platform, and platform hardware.
12.2(33)SB
This command was integrated into Cisco IOS Release 12.2(33)SB.
Examples
The following example shows different instances of the debug resource policy notificationcommand:
Router# debug resource policy notification
Enabled notif. debugs on all owners
When a threshold is violated, the following messages are displayed:
*Mar 3 09:50:44.081: Owner: 'memory' initiated a notification: *Mar 3 09:50:44.081: %SYS-4-RESMEMEXCEED: Resource user usrr1 has exceeded the Major memory threshold Pool: Processor Used: 42932864 Threshold :42932860 *Mar 3 09:50:46.081: Notification from Owner: 'memory' is dispatched for User: 'usrr1' (ID: 0x10000B9) *Mar 3 09:50:46.081: %SYS-4-RESMEMEXCEED: Resource user usrr1 has exceeded the Major memory threshold Pool: Processor Used: 42932864 Threshold :42932860 Router# no debug resource manager notification Disabled notif. debugs on all owners Router# debug resource manager notification owner cpu Enabled notif. debugs on owner 'cpu' Router# no debug resource manager notification owner cpu Disabled notif. debugs on owner 'cpu' Router# debug resource manager notification owner memory Enabled notif. debugs on owner 'memory' Router# no debug resource manager notification owner memory Disabled notif. debugs on owner 'memory' Router# debug resource manager notification owner Buffer Enabled notif. debugs on owner 'Buffer' Router# no debug resource manager notification owner Buffer Disabled notif. debugs on owner 'Buffer' Router# no debug resource manager notification owner Buffer Disabled notif. debugs on owner 'Buffer'debug resource policy registration
To trace the Embedded Resource Manager (ERM) registration activities for resources using the ERM feature, use the debug resource policy registrationcommand in privileged EXEC mode. To disable debugging output, use the no form of this command.
Command History
Release
Modification
12.3(14)T
This command was introduced.
12.2(33)SRB
This command was integrated into Cisco IOS Release 12.2(33)SRB.
12.2SX
This command is supported in the Cisco IOS Release 12.2SX train. Support in a specific 12.2SX release of this train depends on your feature set, platform, and platform hardware.
12.2(33)SB
This command was integrated into Cisco IOS Release 12.2(33)SB.
Examples
The following example shows output from the debug resource policy registrationcommand:
Router# debug resource policy registration

Registrations debugging is on
When a Resource User (RU) is created, the following message is displayed:
*Mar 3 09:35:58.304: resource_user_register: RU: ruID: 0x10000B8, rutID: 0x1, rg_ID: 0x0 name: usrr1When an RU is deleted, the following message is displayed:
*Mar 3 09:41:09.500: resource_user_unregister: RU: ruID: 0x10000B8, rutID: 0x1, rg_ID: 0x0 name: usrr1debug resource-pool
To see and trace resource pool management activity, use the debugresource-pool command in privileged EXEC mode. To disable debugging output, use the no form of this command.
Usage Guidelines
Enter the debugresource-pool command to see and trace resource pool management activity. The following table describes the resource pooling states.
Table 2 Resource Pooling States State
Description
RM_IDLE
No call activity.
RM_RES_AUTHOR
Call waiting for authorization, message sent to authentication, authorization, and accounting (AAA).
RM_RES_ALLOCATING
Call authorized, resource-grp-mgr allocating.
RM_RES_ALLOCATED
Resource allocated, connection acknowledgment sent to signalling state. Call should get connected and become active.
RM_AUTH_REQ_IDLE
Signalling module disconnected call while in RM_RES_AUTHOR. Waiting for authorization response from AAA.
RM_RES_REQ_IDLE
Signalling module disconnected call while in RM_RES_ALLOCATING. Waiting for resource allocation response from resource-group manager.
RM_DNIS_AUTHOR
An intermediate state before proceeding with Route Processor Module (RPM) authorization.
RM_DNIS_AUTH_SUCCEEDED
Dialed number identification service (DNIS) authorization succeeded.
RM_DNIS_RES_ALLOCATED
DNIS resource allocated.
RM_DNIS_AUTH_REQ_IDLE
DNIS authorization request idle.
RM_DNIS_AUTHOR_FAIL
DNIS authorization failed.
RM_DNIS_RES_ALLOC_SUCCESS
DNIS resource allocation succeeded.
RM_DNIS_RES_ALLOC_FAIL
DNIS resource allocation failed.
RM_DNIS_RPM_REQUEST
DNIS resource pool management requested.
You can use the resource pool state to isolate problems. For example, if a call fails authorization in the RM_RES_AUTHOR state, investigate further with AAA authorization debugs to determine whether the problem lies in the resource-pool manager, AAA, or dispatcher.
Examples
The following example shows different instances where you can use the debugresource-poolcommand:
Router# debug resource-pool
RM general debugging is on
Router# show debug
General OS:
  AAA Authorization debugging is on
Resource Pool:
  resource-pool general debugging is on
Router #
Router #ping 21.1.1.10
Type escape sequence to abort.
Sending 5, 100-byte ICMP Echos to 21.1.1.10, timeout is 2 seconds:
*Jan  8 00:10:30.358: RM state:RM_IDLE event:DIALER_INCALL DS0:0:0:0:1
*Jan  8 00:10:30.358: RM: event incoming call
/* An incoming call is received by RM */
*Jan  8 00:10:30.358: RM state:RM_DNIS_AUTHOR event:RM_DNIS_RPM_REQUEST
DS0:0:0:0:1
/* Receives an event notifying to proceed with RPM authorization while
in DNIS authorization state */
*Jan  8 00:10:30.358: RM:RPM event incoming call
*Jan  8 00:10:30.358: RPM profile cp1 found
/* A customer profile "cp1" is found  matching for the incoming call, in
the local database */
*Jan  8 00:10:30.358: RM state:RM_RPM_RES_AUTHOR
event:RM_RPM_RES_AUTHOR_SUCCESS DS0:0:0:0:1
/* Resource authorization success event received while in  resource
authorization state*/
*Jan  8 00:10:30.358: Allocated resource from res_group isdn1
*Jan  8 00:10:30.358: RM:RPM profile "cp1", allocated resource "isdn1"
successfully
*Jan  8 00:10:30.358: RM state:RM_RPM_RES_ALLOCATING
event:RM_RPM_RES_ALLOC_SUCCESS DS0:0:0:0:1
/* Resource allocation sucess event received while attempting to
allocate a resource */
*Jan  8 00:10:30.358: Se0:1 AAA/ACCT/RM: doing resource-allocated
(local) (nothing to do)
*Jan  8 00:10:30.366: %LINK-3-UPDOWN: Interface Serial0:1, changed state
to up
*Jan  8 00:10:30.370: %LINK-3-UPDOWN: Interface Serial0:1, changed state
to down
*Jan  8 00:10:30.570: Se0:1 AAA/ACCT/RM: doing resource-update (local)
cp1 (nothing to do)
*Jan  8 00:10:30.578: %LINK-3-UPDOWN: I.nterface Serial0:0, changed
state to up
*Jan  8 00:10:30.582: %DIALER-6-BIND: Interface Serial0:0 bound to
profile Dialer0...
Success rate is 0 percent (0/5)
Router #
*Jan  8 00:10:36.662: %ISDN-6-CONNECT: Interface Serial0:0 is now
connected to 71017
*Jan  8 00:10:52.990: %DIALER-6-UNBIND: Interface Serial0:0 unbound from
profile Dialer0
*Jan  8 00:10:52.990: %ISDN-6-DISCONNECT: Interface Serial0:0
disconnected from 71017 , call lasted 22 seconds
*Jan  8 00:10:53.206: %LINK-3-UPDOWN: Interface Serial0:0, changed state
to down
*Jan  8 00:10:53.206: %ISDN-6-DISCONNECT: Interface Serial0:1
disconnected from unknown , call lasted 22 seconds
*Jan  8 00:10:53.626: RM state:RM_RPM_RES_ALLOCATED event:DIALER_DISCON
DS0:0:0:0:1
/* Received  Disconnect event from signalling stack  for a call which
has a resource allocated. */
*Jan  8 00:10:53.626: RM:RPM event call drop
/* RM processing the disconnect event */
*Jan  8 00:10:53.626: Deallocated resource from res_group isdn1
*Jan  8 00:10:53.626: RM state:RM_RPM_DISCONNECTING
event:RM_RPM_DISC_ACK DS0:0:0:0:1
/* An intermediate state while the DISCONNECT event is being processed
by external servers, before RM goes back into IDLE state.
*/
The following table describes the significant fields shown in the display.
Table 3 debug resource-pool Field Descriptions Field
Description
RM state:RM_IDLE
Resource manager state that displays no active calls.
RM state:RM_RES_AUTHOR
Resource authorization state.
RES_AUTHOR_SUCCESS DS0: shelf:slot:port:channel
Actual physical resource that is used
Allocated resource from res_group
Physical resource group that accepts the call.
RM profile <x>, allocated resource <x>
Specific customer profile and resource group names used to accept the call.
RM state: RM_RES_ALLOCATING
Resource manager state that unifies a call with a physical resource.
debug rif
To display information on entries entering and leaving the routing information field (RIF) cache, use the debugrif command in privileged EXEC mode. To disable debugging output, use the no form of this command.
Usage Guidelines
In order to use the debugrif command to display traffic source-routed through an interface, fast switching of source route bridging (SRB) frames must first be disabled with the nosource-bridgeroute-cache interface configuration command.
Examples
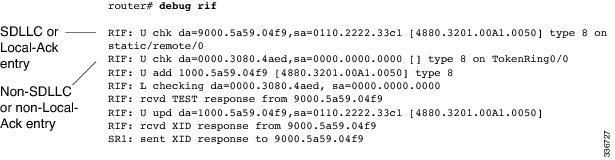
The following is sample output from the debugrif command:
The first line of output is an example of a RIF entry for an interface configured for SDLC Logical Link Control (SDLLC) or Local-Ack. The following table describes significant fields shown in the display.
The following line of output is an example of a RIF entry for an interface that is not configured for SDLLC or Local-Ack:
RIF: U chk da=0000.3080.4aed,sa=0000.0000.0000 [] type 8 on TokenRing0/0Notice that the source address contains only zero values (0000.0000.0000), and that the RIF string is null ([ ]). The last element in the entry indicates that this route was learned from a virtual ring, rather than a real Token Ring port.
The following line shows that a new entry has been added to the RIF cache:
RIF: U add 1000.5a59.04f9 [4880.3201.00A1.0050] type 8The following line shows that a RIF cache lookup operation has taken place:
RIF: L checking da=0000.3080.4aed, sa=0000.0000.0000The following line shows that a TEST response from address 9000.5a59.04f9 was inserted into the RIF cache:
RIF: rcvd TEST response from 9000.5a59.04f9The following line shows that the RIF entry for this route has been found and updated:
RIF: U upd da=1000.5a59.04f9,sa=0110.2222.33c1 [4880.3201.00A1.0050]The following line shows that an XID response from this address was inserted into the RIF cache:
RIF: rcvd XID response from 9000.5a59.04f9The following line shows that the router sent an XID response to this address:
SR1: sent XID response to 9000.5a59.04f9The following table explains the other possible lines of debugrif command output.
Table 5 Additional debug rif Field Descriptions Field
Description
RIF: L Sending XID for <address>
Router/bridge wanted to send a packet to address but did not find it in the RIF cache. It sent an XID explorer packet to determine which RIF it should use. The attempted packet is dropped.
RIF: L No buffer for XID to <address>
Similar to the previous description; however, a buffer in which to build the XID packet could not be obtained.
RIF: U remote rif too small <rif>
Packet’s RIF was too short to be valid.
RIF: U rej <address> too big <rif>
Packet’s RIF exceeded the maximum size allowed and was rejected. The maximum size is 18 bytes.
RIF: U upd interface <address>
RIF entry for this router/bridge’s interface has been updated.
RIF: U ign <address> interface update
RIF entry that would have updated an interface corresponding to one of this router’s interfaces.
RIF: U add <address><rif>
RIF entry for address has been added to the RIF cache.
RIF: U no memory to add rif for <address>
No memory to add a RIF entry for address.
RIF: removing rif entry for <address,typecode>
RIF entry for address has been forcibly removed.
RIF: flushed <address>
RIF entry for address has been removed because of a RIF cache flush.
RIF: expired <address>
RIF entry for address has been aged out of the RIF cache.
debug route-map ipc
To display a summary of the one-way Inter-process Communications (IPC) messages set from the route processor (RP) to the Versatile Interface Processor (VIP) about NetFlow policy routing when distributed Cisco Express Forwarding (dCEF) is enabled, use the debug route-map ipccommand in privileged EXEC mode. To disable debugging output, use the no form of this command.
Usage Guidelines
This command is especially helpful for policy routing with dCEF switching.
This command displays a summary of one-way IPC messages from the RP to the VIP about NetFlow policy routing. If you execute this command on the RP, the messages are shown as “Sent.” If you execute this command on the VIP console, the IPC messages are shown as “Received.”
Examples
The following is sample output from the debug route-map ipccommand executed at the RP:
Router# debug route-map ipc
Routemap related IPC debugging is on

Router# configure terminal
Enter configuration commands, one per line. End with CNTL/Z.
Router(config)# ip cef distributed
Router(config)#^Z
Router#
RM-IPC: Clean routemap config in slot 0
RM-IPC: Sent clean-all-routemaps; len 12
RM-IPC: Download all policy-routing related routemap config to slot 0
RM-IPC: Sent add routemap test(seq:10); n_len 5; len 17
RM-IPC: Sent add acl 1 of routemap test(seq:10); len 21
RM-IPC: Sent add min 10 max 300 of routemap test(seq:10); len 24
RM-IPC: Sent add preced 1 of routemap test(seq:10); len 17
RM-IPC: Sent add tos 4 of routemap test(seq:10); len 17
RM-IPC: Sent add nexthop 50.0.0.8 of routemap test(seq:10); len 20
RM-IPC: Sent add default nexthop 50.0.0.9 of routemap test(seq:10); len 20
RM-IPC: Sent add interface Ethernet0/0/3(5) of routemap test(seq:10); len 20
RM-IPC: Sent add default interface Ethernet0/0/2(4) of routemap test(seq:10); len 20
The following is sample output from the debug route-map ipccommand executed at the VIP:
VIP-Slot0# debug route-map ipc
Routemap related IPC debugging is on

VIP-Slot0#
RM-IPC: Rcvd clean-all-routemaps; len 12
RM-IPC: Rcvd add routemap test(seq:10); n_len 5; len 17
RM-IPC: Rcvd add acl 1 of routemap test(seq:10); len 21
RM-IPC: Rcvd add min 10 max 300 of routemap test(seq:10); len 24
RM-IPC: Rcvd add preced 1 of routemap test(seq:10); len 17
RM-IPC: Rcvd add tos 4 of routemap test(seq:10); len 17
RP-IPC: Rcvd add nexthop 50.0.0.8 of routemap test(seq:10); len 20
RP-IPC: Rcvd add default nexthop 50.0.0.9 of routemap test(seq:10); len 20
RM-IPC: Rcvd add interface Ethernet0/3 of routemap tes; len 20
RM-IPC: Rcvd add default interface Ethernet0/2 of routemap test(seq:10); len 20
debug rpms-proc preauth
To enable diagnostic reporting of preauthentication information, use the debugrpms-procpreauth command in privileged EXEC mode. To disable debugging output, use the no form of this command.
Examples
The following example shows debugging output for two calls. The first is a leg 3 SIP call, and the second is a leg 3 H.323 call:
Router# debug rpms-proc preauth all
All RPMS Process preauth tracing is enabled
Feb 10 14:00:07.236: Entering rpms_proc_print_preauth_req
Feb 10 14:00:07.236: Request = 0
Feb 10 14:00:07.236: Preauth id = 8
Feb 10 14:00:07.236: EndPt Type  = 1
Feb 10 14:00:07.236: EndPt = 192.168.80.70
Feb 10 14:00:07.236: Resource Service = 1
Feb 10 14:00:07.236: Call_origin = answer
Feb 10 14:00:07.236: Call_type = voip
Feb 10 14:00:07.236: Calling_num = 2220001
Feb 10 14:00:07.236: Called_num = 1120001
Feb 10 14:00:07.236: Protocol  = 1
Feb 10 14:00:07.236:rpms_proc_create_node:Created node with preauth_id = 8
Feb 10 14:00:07.236:rpms_proc_send_aaa_req:uid got is 19
Feb 10 14:00:07.240:rpms_proc_preauth_response:Context is for preauth_id 8, aaa_uid 19
Feb 10 14:00:07.240:rpms_proc_preauth_response:Deleting Tree node for preauth id 8 uid 19
Feb 10 14:00:07.284: Entering rpms_proc_print_preauth_req
Feb 10 14:00:07.284: Request = 0
Feb 10 14:00:07.284: Preauth id = 9
Feb 10 14:00:07.284: EndPt Type  = 1
Feb 10 14:00:07.284: EndPt = 192.168.81.102
Feb 10 14:00:07.284: Resource Service = 1
Feb 10 14:00:07.284: Call_origin = answer
Feb 10 14:00:07.284: Call_type = voip
Feb 10 14:00:07.284: Calling_num = 2210001
Feb 10 14:00:07.284: Called_num = 1#1110001
Feb 10 14:00:07.284: Protocol  = 0
Feb 10 14:00:07.288:rpms_proc_create_node:Created node with preauth_id = 9
Feb 10 14:00:07.288:rpms_proc_send_aaa_req:uid got is 21
Feb 10 14:00:07.300:rpms_proc_preauth_response:Context is for preauth_id 9, aaa_uid 21
Feb 10 14:00:07.300:rpms_proc_preauth_response:Deleting Tree node for preauth id 9 uid 21
The following example shows the output for a single leg 3 H.323 call:
Router# debug rpms-proc preauth h323

RPMS Process H323 preauth tracing is enabled
Feb 10 14:04:57.867: Entering rpms_proc_print_preauth_req
Feb 10 14:04:57.867: Request = 0
Feb 10 14:04:57.867: Preauth id = 10
Feb 10 14:04:57.867: EndPt Type  = 1
Feb 10 14:04:57.867: EndPt = 192.168.81.102
Feb 10 14:04:57.867: Resource Service = 1
Feb 10 14:04:57.867: Call_origin = answer
Feb 10 14:04:57.867: Call_type = voip
Feb 10 14:04:57.867: Calling_num = 2210001
Feb 10 14:04:57.867: Called_num = 1#1110001
Feb 10 14:04:57.867: Protocol  = 0
Feb 10 14:04:57.867:rpms_proc_create_node:Created node with preauth_id = 10
Feb 10 14:04:57.867:rpms_proc_send_aaa_req:uid got is 25
Feb 10 14:04:57.875:rpms_proc_preauth_response:Context is for preauth_id 10, aaa_uid 25
Feb 10 14:04:57.875:rpms_proc_preauth_response:Deleting Tree node for preauth id 10 uid 25
The following example shows output for a single leg 3 SIP call:
Router# debug rpms-proc preauth sip
RPMS Process SIP preauth tracing is enabled
Feb 10 14:08:02.880: Entering rpms_proc_print_preauth_req
Feb 10 14:08:02.880: Request = 0
Feb 10 14:08:02.880: Preauth id = 11
Feb 10 14:08:02.880: EndPt Type  = 1
Feb 10 14:08:02.880: EndPt = 192.168.80.70
Feb 10 14:08:02.880: Resource Service = 1
Feb 10 14:08:02.880: Call_origin = answer
Feb 10 14:08:02.880: Call_type = voip
Feb 10 14:08:02.880: Calling_num = 2220001
Feb 10 14:08:02.880: Called_num = 1120001
Feb 10 14:08:02.880: Protocol  = 1
Feb 10 14:08:02.880:rpms_proc_create_node:Created node with preauth_id = 11
Feb 10 14:08:02.880:rpms_proc_send_aaa_req:uid got is 28
Feb 10 14:08:02.888:rpms_proc_preauth_response:Context is for preauth_id 11, aaa_uid 28
Feb 10 14:08:02.888:rpms_proc_preauth_response:Deleting Tree node for preauth id 11 uid 28
The following table describes the significant fields shown in the display.
Table 6 debug rpms-proc preauth Field Descriptions Field
Description
Request
Request Type--0 for preauthentication, 1 for disconnect.
Preauth id
Identifier for the preauthentication request.
EndPt Type
Call Origin End Point Type--1 for IP address, 2 for Interzone ClearToken (IZCT) value.
EndPt
Call Origin End Point Value--An IP address or IZCT value.
Resource Service
Resource Service Type--1 for Reservation, 2 for Query.
Call_origin
Answer.
Call_type
Voice over IP (VoIP).
Calling_num
Calling party number (calling line identification, or CLID).
Called_num
Called party number (dialed number identification service, or DNIS).
Protocol
0 for H.323, 1 for SIP.
function reports
Various identifiers and status reports for executed functions.
debug rtpspi all
To debug all Routing Table Protocol (RTP) security parameter index (SPI) errors, sessions, and in/out functions, use the debug rtpspi all command in privileged EXEC mode. To disable debugging output, use the no form of this command.
Usage Guidelines
Caution
Be careful when you use this command because it can result in console flooding and reduced voice quality.
Examples
The following example shows a debug trace for RTP SPI errors, sessions, and in/out functions on a gateway:
Router# debug rtpspi all
RTP SPI Error, Session and function in/out tracings are enabled.
*Mar  1 00:38:59.381:rtpspi_allocate_rtp_port:Entered.
*Mar  1 00:38:59.381:rtpspi_allocate_rtp_port:allocated RTP port 16544
*Mar  1 00:38:59.381:rtpspi_allocate_rtp_port:Success. port = 16544. Leaving.
*Mar  1 00:38:59.381:rtpspi_call_setup_request:entered.
        Call Id = 5, dest = 0.0.0.0;   callInfo:
        final dest flag = 0,
        rtp_session_mode = 0x2,
        local_ip_addrs = 0x5000001,remote_ip_addrs = 0x0,
        local rtp port = 16544, remote rtp port = 0
*Mar  1 00:38:59.381:rtpspi_call_setup_request:spi_info copied for rtpspi_app_data_t.
*Mar  1 00:38:59.385:rtpspi_call_setup_request:leaving
*Mar  1 00:38:59.385:rtpspi_call_setup() entered
*Mar  1 00:38:59.385:rtpspi_initialize_ccb:Entered
*Mar  1 00:38:59.385:rtpspi_initialize_ccb:leaving
*Mar  1 00:38:59.385:rtpspi_call_setup:rtp_session_mode = 0x2
*Mar  1 00:38:59.385:rtpspi_call_setup:mode = CC_CALL_NORMAL.
        destianation number = 0.0.0.0
*Mar  1 00:38:59.385:rtpspi_call_setup:Passed local_ip_addrs=0x5000001
*Mar  1 00:38:59.385:rtpspi_call_setup:Passed local_rtp_port = 16544
*Mar  1 00:38:59.385:rtpspi_call_setup:Saved RTCP Session = 0x1AF57E0
*Mar  1 00:38:59.385:rtpspi_call_setup:Passed remote rtp port = 0.
*Mar  1 00:38:59.389:rtpspi_start_rtcp_session:entered. rtp session mode=0x2, rem rtp=0, rem ip=0x0
*Mar  1 00:38:59.389:rtpspi_get_rtcp_mode:entered. rtp_mode = 0x2
*Mar  1 00:38:59.389:rtpspi_start_rtcp_session:Starting RTCP session.
        Local IP addr = 0x5000001, Remote IP addr = 0x0,
        Local RTP port = 16544, Remote RTP port = 0, mode = 0x2
*Mar  1 00:38:59.389:rtpspi_start_rtcp_session:RTP Session creation Success.
*Mar  1 00:38:59.389:rtpspi_call_setup:RTP Session creation Success.
*Mar  1 00:38:59.389:rtpspi_call_setup:calling cc_api_call_connected()
*Mar  1 00:38:59.389:rtpspi_call_setup:Leaving.
*Mar  1 00:38:59.393:rtpspi_bridge:entered. conf id = 1, src i/f = 0x1859E88,
        dest i/f = 0x1964EEC, src call id = 5, dest call id = 4
        call info = 0x1919140, xmit fn = 0xDA7494, tag = 0
*Mar  1 00:38:59.393:rtpspi_get_rtcp_mode:entered. rtp_mode = 0x2
*Mar  1 00:38:59.393:rtpspi_modify_rtcp_session_parameters():xmit fn=0xDA7494,
dstIF=0x1964EEC, dstCallID=4, voip_mode=0x2, rtp_mode=0x2, ssrc_status=0
*Mar  1 00:38:59.393:rtpspi_bridge:Calling cc_api_bridge_done() for 5(0x1AF5400) and 4(0x0).
*Mar  1 00:38:59.393:rtpspi_bridge:leaving.
*Mar  1 00:38:59.397:rtpspi_caps_ind:Entered. vdb = 0x1859E88 call id = 5, srcCallId = 4
*Mar  1 00:38:59.397:rtpspi_caps_ind:caps from VTSP:codec=0x83FB, codec_bytes=0x50,
                    fax rate=0x7F, vad=0x3 modem=0x0
*Mar  1 00:38:59.397:rtpspi_get_rtcp_session_parameters():CURRENT VALUES:
dstIF=0x1964EEC, dstCallID=4, current_seq_num=0x0
*Mar  1 00:38:59.397:rtpspi_get_rtcp_session_parameters():NEW VALUES:
dstIF=0x1964EEC, dstCallID=4, current_seq_num=0x261C
*Mar  1 00:38:59.397:rtpspi_caps_ind:Caps Used:codec=0x1, codec bytes=80,
        fax rate=0x1, vad=0x1, modem=0x1, dtmf_relay=0x1, seq_num_start=0x261D
*Mar  1 00:38:59.397:rtpspi_caps_ind:calling cc_api_caps_ind().
*Mar  1 00:38:59.397:rtpspi_caps_ind:Returning success
*Mar  1 00:38:59.397:rtpspi_caps_ack:Entered. call id = 5, srcCallId = 4
*Mar  1 00:38:59.397:rtpspi_caps_ack:leaving.
*Mar  1 00:38:59.618:rtpspi_call_modify:entered. call-id=5, nominator=0x7, params=0x18DD440
*Mar  1 00:38:59.618:rtpspi_call_modify:leaving
*Mar  1 00:38:59.618:rtpspi_do_call_modify:Entered. call-id = 5
*Mar  1 00:38:59.622:rtpspi_do_call_modify:Remote RTP port changed. New port=16432
*Mar  1 00:38:59.622:rtpspi_do_call_modify:Remote IP addrs changed. New IP addrs=0x6000001
*Mar  1 00:38:59.622:rtpspi_do_call_modify:new mode 2 is the same as the current mode
*Mar  1 00:38:59.622:rtpspi_do_call_modify:Starting new RTCP session.
*Mar  1 00:38:59.622:rtpspi_start_rtcp_session:entered. rtp session mode=0x2, rem rtp=16432, rem ip=0x6000001
*Mar  1 00:38:59.622:rtpspi_get_rtcp_mode:entered. rtp_mode = 0x2
*Mar  1 00:38:59.622:rtpspi_start_rtcp_session:Removing old RTCP session.
*Mar  1 00:38:59.622:rtpspi_start_rtcp_session:Starting RTCP session.
        Local IP addr = 0x5000001, Remote IP addr = 0x6000001,
        Local RTP port = 16544, Remote RTP port = 16432, mode = 0x2
*Mar  1 00:38:59.622:rtpspi_start_rtcp_session:RTCP Timer creation Success. (5)*(5000)
*Mar  1 00:38:59.622:rtpspi_start_rtcp_session:RTP Session creation Success.
*Mar  1 00:38:59.622:rtpspi_do_call_modify:RTP Session creation Success.
*Mar  1 00:38:59.622:rtpspi_do_call_modify:Calling cc_api_call_modify(), result=0x0
*Mar  1 00:38:59.626:rtpspi_do_call_modify:success. leaving
*Mar  1 00:39:05.019:rtpspi_call_modify:entered. call-id=5, nominator=0x7, params=0x18DD440
*Mar  1 00:39:05.019:rtpspi_call_modify:leaving
*Mar  1 00:39:05.019:rtpspi_do_call_modify:Entered. call-id = 5
*Mar  1 00:39:05.019:rtpspi_do_call_modify:New remote RTP port = old rtp port = 16432
*Mar  1 00:39:05.019:rtpspi_do_call_modify:New remote IP addrs = old IP addrs = 0x6000001
*Mar  1 00:39:05.019:rtpspi_do_call_modify:Mode changed. new = 3, old = 2
*Mar  1 00:39:05.019:rtpspi_get_rtcp_mode:entered. rtp_mode = 0x3
*Mar  1 00:39:05.023:rtpspi_modify_rtcp_session_parameters():xmit fn=0xDA7494,
dstIF=0x1964EEC, dstCallID=4, voip_mode=0x3, rtp_mode=0x3, ssrc_status=2
*Mar  1 00:39:05.023:rtpspi_do_call_modify:RTCP Timer start.
*Mar  1 00:39:05.023:rtpspi_do_call_modify:Calling cc_api_call_modify(), result=0x0
*Mar  1 00:39:05.023:rtpspi_do_call_modify:success. leaving
*Mar  1 00:40:13.786:rtpspi_bridge_drop:entered. src call-id=5, dest call-id=4, tag=0
*Mar  1 00:40:13.786:rtpspi_get_rtcp_mode:entered. rtp_mode = 0x3
*Mar  1 00:40:13.786:rtpspi_modify_rtcp_session_parameters():xmit fn=0x0,
dstIF=0x0, dstCallID=0, voip_mode=0x3, rtp_mode=0x3, ssrc_status=2
*Mar  1 00:40:13.786:rtpspi_bridge_drop:leaving
*Mar  1 00:40:13.790:rtpspi_call_disconnect:entered. call-id=5, cause=16, tag=0
*Mar  1 00:40:13.790:rtpspi_call_disconnect:leaving.
*Mar  1 00:40:13.790:rtpspi_do_call_disconnect:Entered. call-id = 5
*Mar  1 00:40:13.790:rtpspi_do_call_disconnect:calling rtpspi_call_cleanup(). call-id=5
*Mar  1 00:40:13.794:rtpspi_call_cleanup:entered. ccb = 0x1AF5400, call-id=5, rtp port = 16544
*Mar  1 00:40:13.794:rtpspi_call_cleanup:releasing ccb cache. RTP port=16544
*Mar  1 00:40:13.794:rtpspi_store_call_history_entry():Entered.
*Mar  1 00:40:13.794:rtpspi_store_call_history_entry():Leaving.
*Mar  1 00:40:13.794:rtpspi_call_cleanup:RTCP Timer Stop.
*Mar  1 00:40:13.794:rtpspi_call_cleanup:deallocating RTP port 16544.
*Mar  1 00:40:13.794:rtpspi_free_rtcp_session:Entered.
*Mar  1 00:40:13.794:rtpspi_free_rtcp_session:Success. Leaving
*Mar  1 00:40:13.794::rtpspi_call_cleanup freeing ccb (0x1AF5400)
*Mar  1 00:40:13.794:rtpspi_call_cleanup:leaving
*Mar  1 00:40:13.794:rtpspi_do_call_disconnect:leaving
Related Commands
Command
Description
debug rtpspi errors
Debugs RTP SPI errors.
debug rtpspi inout
Debugs RTP SPI in/out functions.
debug rtpspi send-nse
Triggers the RTP SPI to send a triple redundant NSE.
debug sgcp errors
Debugs SGCP errors.
debug sgcp events
Debugs SGCP events.
debug sgcp packet
Debugs SGCP packets.
debug vtsp send-nse
Sends and debugs a triple redundant NSE from the DSP to a remote gateway.
debug rtpspi errors
To debug Routing Table Protocol (RTP) security parameter index (SPI) errors, use the debug rtpspi errorscommand in privileged EXEC mode. To disable debugging output, use the no form of this command.
Usage Guidelines
Caution
Be careful when you use this command because it can result in console flooding and reduced voice quality.
Examples
This example shows a debug trace for RTP SPI errors on two gateways. The following example shows the debug trace on the first gateway:
Router# debug rtpspi errors
00:54:13.272:rtpspi_do_call_modify:new mode 2 is the same as the current mode
00:54:18.738:rtpspi_do_call_modify:New remote RTP port = old rtp port = 16452
00:54:18.738:rtpspi_do_call_modify:New remote IP addrs = old IP addrs = 0x6000001
The following example shows the debug trace on the second gateway:
Router# debug rtpspi errors
00:54:08:rtpspi_process_timers:
00:54:08:rtpspi_process_timers:Timer 0x1A5AF9C expired.
00:54:08:rtpspi_process_timers:Timer expired for callID 0x3
00:54:08:rtpspi_process_timers:
00:54:08:rtpspi_process_timers:Timer 0x1A5AF9C expired.
00:54:08:rtpspi_process_timers:Timer expired for callID 0x3
00:54:08:rtpspi_process_timers:
00:54:08:rtpspi_process_timers:Timer 0x1A5AF9C expired.
00:54:08:rtpspi_process_timers:Timer expired for callID 0x3
00:54:09:rtpspi_process_timers:
00:54:09:rtpspi_process_timers:Timer 0x1A5AFBC expired.
00:54:09:rtpspi_process_timers:Timer expired for callID 0x3
00:54:09:rtpspi_process_timers:
00:54:09:rtpspi_process_timers:Timer 0x1A5B364 expired.
00:54:09:rtpspi_process_timers:Timer expired for callID 0x3
Related Commands
Command
Description
debug rtpspi all
Debugs all RTP SPI errors, sessions, and in/out functions.
debug rtpspi inout
Debugs RTP SPI in/out functions.
debug rtpspi send-nse
Triggers the RTP SPI to send a triple redundant NSE.
debug sgcp errors
Debugs SGCP errors.
debug sgcp events
Debugs SGCP events.
debug sgcp packet
Debugs SGCP packets.
debug vtsp send-nse
Sends and debugs a triple redundant NSE from the DSP to a remote gateway.
debug rtpspi inout
To debug Routing Table Protocol (RTP) security parameter index (SPI) in/out functions, use the debug rtpspi inoutcommand in privileged EXEC mode. To disable debugging output, use the no form of this command.
Usage Guidelines
Caution
Be careful when you use this command because it can result in console flooding and reduced voice quality.
Examples
The following example shows a debug trace for RTP SPI in/out functions on a gateway:
Router#
debug rtpspi inout
*Mar  1 00:57:24.565:rtpspi_allocate_rtp_port:Entered.
*Mar  1 00:57:24.565:rtpspi_allocate_rtp_port:Success. port = 16520. Leaving.
*Mar  1 00:57:24.565:rtpspi_call_setup_request:entered.
        Call Id = 9, dest = 0.0.0.0;   callInfo:
        final dest flag = 0,
        rtp_session_mode = 0x2,
        local_ip_addrs = 0x5000001,remote_ip_addrs = 0x0,
        local rtp port = 16520, remote rtp port = 0
*Mar  1 00:57:24.565:rtpspi_call_setup_request:spi_info copied for rtpspi_app_data_t.
*Mar  1 00:57:24.565:rtpspi_call_setup_request:leaving
*Mar  1 00:57:24.569:rtpspi_call_setup() entered
*Mar  1 00:57:24.569:rtpspi_initialize_ccb:Entered
*Mar  1 00:57:24.569:rtpspi_initialize_ccb:leaving
*Mar  1 00:57:24.569:rtpspi_start_rtcp_session:entered. rtp session mode=0x2, rem rtp=0, rem ip=0x0
*Mar  1 00:57:24.569:rtpspi_get_rtcp_mode:entered. rtp_mode = 0x2
*Mar  1 00:57:24.569:rtpspi_call_setup:Leaving.
*Mar  1 00:57:24.573:rtpspi_bridge:entered. conf id = 3, src i/f = 0x1859E88,
        dest i/f = 0x1964EEC, src call id = 9, dest call id = 8
        call info = 0x1919140, xmit fn = 0xDA7494, tag = 0
*Mar  1 00:57:24.573:rtpspi_get_rtcp_mode:entered. rtp_mode = 0x2
*Mar  1 00:57:24.573:rtpspi_bridge:leaving.
*Mar  1 00:57:24.573:rtpspi_caps_ind:Entered. vdb = 0x1859E88 call id = 9, srcCallId = 8
*Mar  1 00:57:24.577:rtpspi_caps_ind:Returning success
*Mar  1 00:57:24.577:rtpspi_caps_ack:Entered. call id = 9, srcCallId = 8
*Mar  1 00:57:24.577:rtpspi_caps_ack:leaving.
*Mar  1 00:57:24.818:rtpspi_call_modify:entered. call-id=9, nominator=0x7, params=0x18DD440
*Mar  1 00:57:24.818:rtpspi_call_modify:leaving
*Mar  1 00:57:24.818:rtpspi_do_call_modify:Entered. call-id = 9
*Mar  1 00:57:24.818:rtpspi_start_rtcp_session:entered. rtp session mode=0x2, rem rtp=16396, rem ip=0x6000001
*Mar  1 00:57:24.822:rtpspi_get_rtcp_mode:entered. rtp_mode = 0x2
*Mar  1 00:57:24.822:rtpspi_do_call_modify:success. leaving
*Mar  1 00:57:30.296:rtpspi_call_modify:entered. call-id=9, nominator=0x7, params=0x18DD440
*Mar  1 00:57:30.296:rtpspi_call_modify:leaving
*Mar  1 00:57:30.300:rtpspi_do_call_modify:Entered. call-id = 9
*Mar  1 00:57:30.300:rtpspi_get_rtcp_mode:entered. rtp_mode = 0x3
*Mar  1 00:57:30.300:rtpspi_do_call_modify:success. leaving
*Mar  1 00:58:39.055:rtpspi_bridge_drop:entered. src call-id=9, dest call-id=8, tag=0
*Mar  1 00:58:39.055:rtpspi_get_rtcp_mode:entered. rtp_mode = 0x3
*Mar  1 00:58:39.055:rtpspi_bridge_drop:leaving
*Mar  1 00:58:39.059:rtpspi_call_disconnect:entered. call-id=9, cause=16, tag=0
*Mar  1 00:58:39.059:rtpspi_call_disconnect:leaving.
*Mar  1 00:58:39.059:rtpspi_do_call_disconnect:Entered. call-id = 9
*Mar  1 00:58:39.059:rtpspi_call_cleanup:entered. ccb = 0x1AF5400, call-id=9, rtp port = 16520
*Mar  1 00:58:39.059:rtpspi_store_call_history_entry():Entered.
*Mar  1 00:58:39.059:rtpspi_store_call_history_entry():Leaving.
*Mar  1 00:58:39.059:rtpspi_free_rtcp_session:Entered.
*Mar  1 00:58:39.059:rtpspi_free_rtcp_session:Success. Leaving
*Mar  1 00:58:39.063:rtpspi_call_cleanup:leaving
*Mar  1 00:58:39.063:rtpspi_do_call_disconnect:leaving
Related Commands
Command
Description
debug rtpspi all
Debugs all RTP SPI errors, sessions, and in/out functions.
debug rtpspi errors
Debugs RTP SPI errors.
debug rtpspi send-nse
Triggers the RTP SPI to send a triple redundant NSE.
debug sgcp errors
Debugs SGCP errors.
debug sgcp events
Debugs SGCP events.
debug sgcp packet
Debugs SGCP packets.
debug vtsp send-nse
Sends and debugs a triple redundant NSE from the DSP to a remote gateway.
debug rtpspi send-nse
To trigger the Routing Table Protocol (RTP) security parameter index (SPI) software module to send a triple redundant NSE, use the debug rtpspi send-nsecommand in privileged EXEC mode. To disable this action, use the no form of the command.
Examples
The following example shows the RTP SPI software module set to send an NSE:
Router# debug rtpspi send-nseRelated Commands
Command
Description
debug rtpspi all
Debugs all RTP SPI errors, sessions, and in/out functions.
debug rtpspi errors
Debugs RTP SPI errors.
debug rtpspi inout
Debugs RTP SPI in/out functions.
debug sgcp errors
Debugs SGCP errors.
debug sgcp events
Debugs SGCP events.
debug sgcp packet
Debugs SGCP packets.
debug vtsp send-nse
Sends and debugs a triple redundant NSE from the DSP to a remote gateway.
debug rtpspi session
To debug all Routing Table Protocol (RTP) security parameter index (SPI) sessions, use the debug rtpspi sessioncommand in privileged EXEC mode. To disable debugging, use the no form of this command.
Examples
The following example shows a debug trace for RTP SPI sessions on a gateway:
Router# debug rtpspi session
*Mar  1 01:01:51.593:rtpspi_allocate_rtp_port:allocated RTP port 16406
*Mar  1 01:01:51.593:rtpspi_call_setup:rtp_session_mode = 0x2
*Mar  1 01:01:51.593:rtpspi_call_setup:mode = CC_CALL_NORMAL.
        destianation number = 0.0.0.0
*Mar  1 01:01:51.593:rtpspi_call_setup:Passed local_ip_addrs=0x5000001
*Mar  1 01:01:51.593:rtpspi_call_setup:Passed local_rtp_port = 16406
*Mar  1 01:01:51.593:rtpspi_call_setup:Saved RTCP Session = 0x1AFDFBC
*Mar  1 01:01:51.593:rtpspi_call_setup:Passed remote rtp port = 0.
*Mar  1 01:01:51.598:rtpspi_start_rtcp_session:Starting RTCP session.
        Local IP addr = 0x5000001, Remote IP addr = 0x0,
        Local RTP port = 16406, Remote RTP port = 0, mode = 0x2
*Mar  1 01:01:51.598:rtpspi_start_rtcp_session:RTP Session creation Success.
*Mar  1 01:01:51.598:rtpspi_call_setup:RTP Session creation Success.
*Mar  1 01:01:51.598:rtpspi_call_setup:calling cc_api_call_connected()
*Mar  1 01:01:51.598:rtpspi_modify_rtcp_session_parameters():xmit fn=0xDA7494,
dstIF=0x1964EEC, dstCallID=10, voip_mode=0x2, rtp_mode=0x2, ssrc_status=0
*Mar  1 01:01:51.598:rtpspi_bridge:Calling cc_api_bridge_done() for 11(0x1AF5400) and 10(0x0).
*Mar  1 01:01:51.602:rtpspi_caps_ind:caps from VTSP:codec=0x83FB, codec_bytes=0x50,
                    fax rate=0x7F, vad=0x3 modem=0x0
*Mar  1 01:01:51.602:rtpspi_get_rtcp_session_parameters():CURRENT VALUES:
dstIF=0x1964EEC, dstCallID=10, current_seq_num=0x0
*Mar  1 01:01:51.602:rtpspi_get_rtcp_session_parameters():NEW VALUES:
dstIF=0x1964EEC, dstCallID=10, current_seq_num=0xF1E
*Mar  1 01:01:51.602:rtpspi_caps_ind:Caps Used:codec=0x1, codec bytes=80,
        fax rate=0x1, vad=0x1, modem=0x1, dtmf_relay=0x1, seq_num_start=0xF1F
*Mar  1 01:01:51.602:rtpspi_caps_ind:calling cc_api_caps_ind().
*Mar  1 01:01:51.822:rtpspi_do_call_modify:Remote RTP port changed. New port=16498
*Mar  1 01:01:51.822:rtpspi_do_call_modify:Remote IP addrs changed. New IP addrs=0x6000001
*Mar  1 01:01:51.822:rtpspi_do_call_modify:Starting new RTCP session.
*Mar  1 01:01:51.822:rtpspi_start_rtcp_session:Removing old RTCP session.
*Mar  1 01:01:51.822:rtpspi_start_rtcp_session:Starting RTCP session.
        Local IP addr = 0x5000001, Remote IP addr = 0x6000001,
        Local RTP port = 16406, Remote RTP port = 16498, mode = 0x2
*Mar  1 01:01:51.822:rtpspi_start_rtcp_session:RTCP Timer creation Success. (5)*(5000)
*Mar  1 01:01:51.826:rtpspi_start_rtcp_session:RTP Session creation Success.
*Mar  1 01:01:51.826:rtpspi_do_call_modify:RTP Session creation Success.
*Mar  1 01:01:51.826:rtpspi_do_call_modify:Calling cc_api_call_modify(), result=0x0
*Mar  1 01:01:57.296:rtpspi_do_call_modify:Mode changed. new = 3, old = 2
*Mar  1 01:01:57.296:rtpspi_modify_rtcp_session_parameters():xmit fn=0xDA7494,
dstIF=0x1964EEC, dstCallID=10, voip_mode=0x3, rtp_mode=0x3, ssrc_status=2
*Mar  1 01:01:57.296:rtpspi_do_call_modify:RTCP Timer start.
*Mar  1 01:01:57.296:rtpspi_do_call_modify:Calling cc_api_call_modify(), result=0x0
*Mar  1 01:03:06.108:rtpspi_modify_rtcp_session_parameters():xmit fn=0x0,
dstIF=0x0, dstCallID=0, voip_mode=0x3, rtp_mode=0x3, ssrc_status=2
*Mar  1 01:03:06.112:rtpspi_do_call_disconnect:calling rtpspi_call_cleanup(). call-id=11
*Mar  1 01:03:06.112:rtpspi_call_cleanup:releasing ccb cache. RTP port=16406
*Mar  1 01:03:06.112:rtpspi_call_cleanup:RTCP Timer Stop.
*Mar  1 01:03:06.112:rtpspi_call_cleanup:deallocating RTP port 16406.
*Mar  1 01:03:06.112::rtpspi_call_cleanup freeing ccb (0x1AF5400)
Related Commands
Command
Description
debug rtpspi all
Debugs all RTP SPI errors, sessions, and in/out functions.
debug rtpspi errors
Debugs RTP SPI errors.
debug rtpspi inout
Debugs RTP SPI in/out functions.
debug rtpspi send-nse
Triggers the RTP SPI to send a triple redundant NSE.
debug sgcp errors
Debugs SGCP errors.
debug sgcp events
Debugs SGCP events.
debug sgcp packet
Debugs SGCP packets.
sgcp
Starts and allocates resources for the SCGP daemon.
debug vtsp send-nse
Sends and debugs a triple redundant NSE from the DSP to a remote gateway.
debug rtr error
NoteEffective with Cisco IOS Release 12.2(31)SB2, the debugrtrerrorcommand is replaced by the debugipslamonitorerrorcommand. Effective with Cisco IOS Release 12.2(33)SRB, the debugrtrerrorcommand is replaced by the debugipslaerrorcommand. See the debugipslamonitorerror and debugipslaerror commands for more information.
To enable debugging output of Cisco IOS IP Service Level Agreements (SLAs) operation run-time errors, use the debugrtrerrorcommand in privileged EXEC mode. To disable debugging output, use the noform of this command.
Command History
Release
Modification
11.2
This command was introduced.
12.0(5)T
This command was modified.
12.3(14)T
This command was replaced by the debugipslamonitorerrorcommand.
12.2(31)SB2
This command was replaced by the debugipslamonitorerrorcommand.
12.2(33)SRB
This command was replaced by the debugipslaerrorcommand.
Usage Guidelines
The debugrtrerrorcommand displays run-time errors. When an operation number other than 0 is specified, all run-time errors for that operation are displayed when the operation is active. When the operation number is 0, all run-time errors relating to the IP SLAs scheduler process are displayed. When no operation number is specified, all run-time errors for all active operations configured on the router are displayed.
NoteUse the debugrtrerrorcommand before using the debugrtrtrace command because the debugrtrerrorcommand generates a lesser amount of debugging output.
Examples
The following is sample output from the debugrtrerror command. The output indicates failure because the target is not there or because the responder is not enabled on the target. All debugging output for IP SLAs (including the output from the debugrtrtrace command) has the following format.
Router# debug rtr error
May  5 05:00:35.483: control message failure:1
May  5 05:01:35.003: control message failure:1
May  5 05:02:34.527: control message failure:1
May  5 05:03:34.039: control message failure:1
May  5 05:04:33.563: control message failure:1
May  5 05:05:33.099: control message failure:1
May  5 05:06:32.596: control message failure:1
May  5 05:07:32.119: control message failure:1
May  5 05:08:31.643: control message failure:1
May  5 05:09:31.167: control message failure:1
May  5 05:10:30.683: control message failure:1
The following table describes the significant fields shown in the display.
Table 7 debug rtr error Field Descriptions Field
Description
RTR 1
Number of the operation generating the message.
Error Return Code
Message identifier indicating the error type (or error itself).
LU0 RTR Probe 1
Name of the process generating the message.
in echoTarget on call luReceive
LuApiReturnCode of InvalidHandle - invalid host name or API handle
Supplemental messages that pertain to the message identifier.
debug rtr mpls-lsp-monitor
NoteEffective with Cisco IOS Release 12.2(31)SB2, the debug rtr mpls-lsp-monitorcommand is replaced by the debug ip sla monitor mpls-lsp-monitorcommand. Effective with Cisco IOS Release 12.2(33)SRB, the debug rtr mpls-lsp-monitorcommand is replaced by the debug ip sla mpls-lsp-monitorcommand. See the debug ip sla monitor mpls-lsp-monitor and debug ip sla mpls-lsp-monitor commands for more information.
To enable debugging output for the IP Service Level Agreements (SLAs) label switched path (LSP) Health Monitor, use the debug rtr mpls-lsp-monitorcommand in privileged EXEC mode. To disable debugging output, use the no form of this command.
Command History
Release
Modification
12.2(27)SBC
This command was introduced.
12.2(33)SRA
This command was integrated into Cisco IOS Release 12.2(33)SRA.
12.2(31)SB2
This command was replaced by the debug ip sla monitor mpls-lsp-monitorcommand.
12.2(33)SRB
This command was replaced by the debug ip sla mpls-lsp-monitorcommand.
Examples
The following is sample output from the debug rtr mpls-lsp-monitor command. This output shows that three VPNs associated with router 10.10.10.8 (red, blue, and green) were discovered and that this information was added to the LSP Health Monitor scan queue. Also, since router 10.10.10.8 is a newly discovered Border Gateway Protocol (BGP) next hop neighbor, a new IP SLAs operation for router 10.10.10.8 (Probe 100005) is being created and added to the LSP Health Monitor multioperation schedule. Even though router 10.10.10.8 belongs to three VPNs, only one IP SLAs operation is being created.
Router# debug rtr mpls-lsp-monitor SAA MPLSLM debugging for all entries is on *Aug 19 19:59: SAA MPLSLM(1):Next hop 10.10.10.8 added in AddQ *Aug 19 19:59: SAA MPLSLM(1):Next hop 10.10.10.8 added in AddQ *Aug 19 19:59: SAA MPLSLM(1):Next hop 10.10.10.8 added in AddQ *Aug 19 19:59: SAA MPLSLM(1):Adding vrf red into tree entry 10.10.10.8 *Aug 19 19:59: SAA MPLSLM(1):Adding Probe 100005 *Aug 19 19:59: SAA MPLSLM(1):Adding ProbeID 100005 to tree entry 10.10.10.8 (1) *Aug 19 19:59: SAA MPLSLM(1):Adding vrf blue into tree entry 10.10.10.8 *Aug 19 19:59: SAA MPLSLM(1):Duplicate in AddQ 10.10.10.8 *Aug 19 19:59: SAA MPLSLM(1):Adding vrf green into tree entry 10.10.10.8 *Aug 19 19:59: SAA MPLSLM(1):Duplicate in AddQ 10.10.10.8 *Aug 19 19:59: SAA MPLSLM(1):Added Probe(s) 100005 will be scheduled after 26 secs over schedule period 60debug rtr trace
NoteEffective with Cisco IOS Release 12.2(31)SB2, the debug rtr tracecommand is replaced by the debug ip sla monitor tracecommand. Effective with Cisco IOS Release 12.2(33)SRB, the debug rtr tracecommand is replaced by the debug ip sla tracecommand. See the debug ip sla monitor trace and debug ip sla trace commands for more information.
To trace the execution of a Cisco IOS IP Service Level Agreements (SLAs) operation, use the debug rtr tracecommand in privileged EXEC mode. To disable trace debugging output, use the noform of this command.
Command History
Release
Modification
11.2
This command was introduced.
12.0(5)T
This command was modified.
12.3(14)T
This command was replaced by the debug ip sla monitor tracecommand.
12.2(31)SB2
This command was replaced by the debug ip sla monitor tracecommand.
12.2(33)SRB
This command was replaced by the debug ip sla tracecommand.
Usage Guidelines
When an operation number other than 0 is specified, execution for that operation is traced. When the operation number is 0, the IP SLAs scheduler process is traced. When no operation number is specified, all active operations are traced.
The debug rtr trace command also enables debug rtr error command for the specified operation. However, the no debug rtr trace command does not disable the debug rtr error command. You must manually disable the command by using the no debug rtr error command.
All debuggng output (including debug rtr error command output) has the format shown in the debug rtr error command output example.
NoteThe debug rtr tracecommand can generate a large number of debug messages. First use the debug rtr error command, and then use the debug rtr trace on a per-operation basis.
Examples
The following is sample output from the debug rtr trace command. In this example, an operation is traced through a single operation attempt: the setup of a connection to the target, and the attempt at an echo to calculate UDP packet response time.
Router# debug rtr trace Router# RTR 1:Starting An Echo Operation - IP RTR Probe 1 May 5 05:25:08.584:rtt hash insert :3.0.0.3 3383 May 5 05:25:08.584: source=3.0.0.3(3383) dest-ip=5.0.0.1(9) May 5 05:25:08.588:sending control msg: May 5 05:25:08.588: Ver:1 ID:51 Len:52 May 5 05:25:08.592:cmd:command:RTT_CMD_UDP_PORT_ENABLE, ip:5.0.0.1, port:9, duration:5000 May 5 05:25:08.607:receiving reply May 5 05:25:08.607: Ver:1 ID:51 Len:8 May 5 05:25:08.623: local delta:8 May 5 05:25:08.627: delta from responder:1 May 5 05:25:08.627: received <16> bytes and responseTime = 3 (ms) May 5 05:25:08.631:rtt hash remove:3.0.0.3 3383RTR 1:Starting An Echo Operation - IP RTR Probe 1 May 5 05:26:08.104:rtt hash insert :3.0.0.3 2974 May 5 05:26:08.104: source=3.0.0.3(2974) dest-ip=5.0.0.1(9) May 5 05:26:08.108:sending control msg: May 5 05:26:08.108: Ver:1 ID:52 Len:52 May 5 05:26:08.112:cmd:command:RTT_CMD_UDP_PORT_ENABLE, ip:5.0.0.1, port:9, duration:5000 May 5 05:26:08.127:receiving reply May 5 05:26:08.127: Ver:1 ID:52 Len:8 May 5 05:26:08.143: local delta:8 May 5 05:26:08.147: delta from responder:1 May 5 05:26:08.147: received <16> bytes and responseTime = 3 (ms) May 5 05:26:08.151:rtt hash remove:3.0.0.3 2974RTR 1:Starting An Echo Operation - IP RTR Probe 1debug rtsp
To show the status of the Real-Time Streaming Protocol (RTSP) client or server, use the debug rtsp command in privileged EXEC mode. To disable debugging output, use the no form of this command.
debug rtsp type [ all | api | error | pmh | session | socket ]
[no] debug rtsp type [ all | api | pmh | session | socket ]
Syntax Description
Command History
Release
Modification
12.1(3)T
This command was introduced.
12.2(11)T
The new debug header was added to the following Cisco routers: Cisco 2600 series, Cisco 3620, Cisco 3640, and Cisco 3660 series; on the following universal gateways: Cisco AS5350, Cisco AS5400, and Cisco AS5850; on the following access servers: Cisco AS5300, and Cisco AS5800; and, on the Cisco MC3810 multiservice access concentrators.
Examples
The following is sample output that displays when the debug rtsp command is entered with the apikeyword:
Router# debug rtsp api ! RTSP client API debugging is on ! Jan 1 00:23:15.775:rtsp_api_create_session:sess_id=0x61A07C78,evh=0x60D6E62C context=0x61A07B28 Jan 1 00:23:15.775:rtsp_api_request:msg=0x61C2B10C Jan 1 00:23:15.775:rtsp_api_handle_req_set_params:msg=0x61C2B10C Jan 1 00:23:15.775:rtsp_api_free_msg_buffer:msg=0x61C2B10C Jan 1 00:23:15.775:rtsp_api_request:msg=0x61C293CC Jan 1 00:23:15.775:rtsp_api_handle_req_set_params:msg=0x61C293CC Jan 1 00:23:15.775:rtsp_api_free_msg_buffer:msg=0x61C293CC Jan 1 00:23:15.775:rtsp_api_request:msg=0x61C2970C Jan 1 00:23:15.775:rtsp_api_handle_req_set_params:msg=0x61C2970C Jan 1 00:23:15.775:rtsp_api_free_msg_buffer:msg=0x61C2970C ! Jan 1 00:23:15.775:rtsp_api_request:msg=0x61C29A4C ! Jan 1 00:23:22.099:rtsp_api_free_msg_buffer:msg=0x61C29A4C Jan 1 00:23:22.115:rtsp_api_request:msg=0x61C2A40C Jan 1 00:23:22.115:rtsp_api_free_msg_buffer:msg=0x61C2A40Cdebug rtsp all
To display all related information about the Real Time Streaming Protocol (RTSP) data, use the debugrtspallcommand in privileged EXEC mode. To disable debugging output, use the no form of this command.
Usage Guidelines
We recommend that you log output from the debugrtspall command to a buffer rather than sending the output to the console; otherwise, the size of the output could severely impact the performance of the gateway.
Examples
The following example shows debugging output for thedebugrtspallcommand. The showdebug command shows which RTSP modules are traced.
Router# debug rtsp all
All RTSP client debugging is on
Router# show debug
RTSP:
  RTSP client Protocol Error debugging is on
  RTSP client Protocol Message Handler debugging is on
  RTSP client API debugging is on
  RTSP client socket debugging is on
  RTSP client session debugging is on
Router#
Router#!call initiated
Router#
*Mar 11 03:14:23.471: //-1//RTSP:/rtsp_get_new_scb:
*Mar 11 03:14:23.471: //-1//RTSP:/rtsp_initialize_scb:
*Mar 11 03:14:23.471: //-1//RTSP:/rtsplib_init_svr_session: 0x63A5FE6C
*Mar 11 03:14:23.471: //-1//RTSP:/rtsp_api_create_session: evh=0x6155F0D4 context=0x6345042C
*Mar 11 03:14:23.471: //-1//RTSP:/rtsp_get_new_scb:
*Mar 11 03:14:23.471: //-1//RTSP:/rtsp_initialize_scb:
*Mar 11 03:14:23.471: //-1//RTSP:/rtsplib_init_svr_session: 0x63A5D874
*Mar 11 03:14:23.471: //-1//RTSP:/rtsp_api_create_session: evh=0x6155F204 context=0x6345046C
*Mar 11 03:14:23.471: //-1//RTSP:RS45:/rtsp_api_request: msg=0x63A59FB8
*Mar 11 03:14:23.471: //-1//RTSP:RS45:/rtsp_api_handle_req_set_params: msg=0x63A59FB8
*Mar 11 03:14:23.475: //-1//RTSP:RS45:/rtsp_api_free_msg_buffer: msg=0x63A59FB8
*Mar 11 03:14:23.475: //-1//RTSP:RS45:/rtsp_api_request: msg=0x63A5A304
*Mar 11 03:14:23.475: //-1//RTSP:RS45:/rtsp_api_handle_req_set_params: msg=0x63A5A304
*Mar 11 03:14:23.475: //-1//RTSP:RS45:/rtsp_api_free_msg_buffer: msg=0x63A5A304
*Mar 11 03:14:23.475: //-1//RTSP:RS45:/rtsp_api_request: msg=0x63A5A650
*Mar 11 03:14:23.475: //-1//RTSP:RS45:/rtsp_api_handle_req_set_params: msg=0x63A5A650
*Mar 11 03:14:23.475: //166//RTSP:LP:RS45:/rtsp_api_handle_req_set_params:
*Mar 11 03:14:23.475: //-1//RTSP:RS45:/rtsp_api_free_msg_buffer: msg=0x63A5A650
*Mar 11 03:14:23.475: //-1//RTSP:RS46:/rtsp_api_request: msg=0x63A5A99C
*Mar 11 03:14:23.475: //-1//RTSP:RS46:/rtsp_api_handle_req_set_params: msg=0x63A5A99C
*Mar 11 03:14:23.475: //166//RTSP:LP:RS46:/rtsp_api_handle_req_set_params:
*Mar 11 03:14:23.475: //-1//RTSP:RS46:/rtsp_api_free_msg_buffer: msg=0x63A5A99C
Router#
Router#!call answered
Router#
Router#!digits dialed
Router#
Router#!call terminated
Router#
*Mar 11 03:14:51.603: //-1//RTSP:RS45:/rtsp_api_request: msg=0x63A5ACE8
*Mar 11 03:14:51.603: //-1//RTSP:RS46:/rtsp_api_request: msg=0x63A5B034
*Mar 11 03:14:51.607: //-1//RTSP:RS45:/rtsp_control_process_msg:
*Mar 11 03:14:51.607: //166//RTSP:/rtsp_control_process_msg: received MSG request of TYPE 0
*Mar 11 03:14:51.607: //166//RTSP:/rtsp_set_event: api_req_msg_type=RTSP_API_REQ_DESTROY
*Mar 11 03:14:51.607: //166//RTSP:/rtsp_session_cleanup:
*Mar 11 03:14:51.607: //-1//RTSP:/rtsplib_free_svr_session:
*Mar 11 03:14:51.607: //-1//RTSP:/rtsplib_stop_timer: timer(0x638D5DDC) stops
*Mar 11 03:14:51.611: //166//RTSP:/rtsp_create_session_history: scb=0x63A5FE6C, callID=0xA6
*Mar 11 03:14:51.611: //166//RTSP:/rtsp_create_session_history: No streams in session control block
*Mar 11 03:14:51.611: //166//RTSP:/rtsp_session_cleanup: deleting session: scb=0x63A5FE6C
*Mar 11 03:14:51.611: //-1//RTSP:RS45:/rtsp_api_free_msg_buffer: msg=0x63A5ACE8
*Mar 11 03:14:51.611: //-1//RTSP:RS46:/rtsp_control_process_msg:
*Mar 11 03:14:51.611: //166//RTSP:/rtsp_control_process_msg: received MSG request of TYPE 0
*Mar 11 03:14:51.611: //166//RTSP:/rtsp_set_event: api_req_msg_type=RTSP_API_REQ_DESTROY
*Mar 11 03:14:51.611: //166//RTSP:/rtsp_session_cleanup:
*Mar 11 03:14:51.611: //-1//RTSP:/rtsplib_free_svr_session:
*Mar 11 03:14:51.611: //-1//RTSP:/rtsplib_stop_timer: timer(0x63A60110) stops
*Mar 11 03:14:51.611: //166//RTSP:/rtsp_create_session_history: scb=0x63A5D874, callID=0xA6
*Mar 11 03:14:51.611: //166//RTSP:/rtsp_create_session_history: No streams in session control block
*Mar 11 03:14:51.611: //166//RTSP:/rtsp_session_cleanup: deleting session: scb=0x63A5D874
*Mar 11 03:14:51.611: //-1//RTSP:RS46:/rtsp_api_free_msg_buffer: msg=0x63A5B034
The following table describes the significant fields shown in the display.
Related Commands
Command
Description
debug rtsp api
Displays debugging output for the RTSP client API.
debug rtsp error
Displays error message for RTSP data.
debug rtsp pmh
Displays debugging messages for the PMH.
debug rtsp socket
Displays debugging output for the RTSP client socket data.
voice call debug
Allows configuration of the voice call debugging output.
debug rtsp api
To display information about the Real Time Streaming Protocol (RTSP) application programming interface (API) messages passed down to the RTSP client, use the debugrtspapicommand in privileged EXEC mode. To disable debugging output, use the no form of this command.
Usage Guidelines
We recommend that you log output from the debugrtspapi command to a buffer rather than sending the output to the console; otherwise, the size of the output could severely impact the performance of the gateway.
Examples
The following example shows output from thedebugrtspapicommand:
Router# debug rtsp api
RTSP client API debugging is on
Router# !call initiated
*Mar 11 03:04:41.699: //-1//RTSP:/rtsp_api_create_session: evh=0x6155F0D4 context=0x6345088C
*Mar 11 03:04:41.699: //-1//RTSP:/rtsp_api_create_session: evh=0x6155F204 context=0x634508CC
*Mar 11 03:04:41.699: //-1//RTSP:RS35:/rtsp_api_request: msg=0x63A59FB8
*Mar 11 03:04:41.699: //-1//RTSP:RS35:/rtsp_api_handle_req_set_params: msg=0x63A59FB8
*Mar 11 03:04:41.699: //-1//RTSP:RS35:/rtsp_api_free_msg_buffer: msg=0x63A59FB8
*Mar 11 03:04:41.699: //-1//RTSP:RS35:/rtsp_api_request: msg=0x63A5A304
*Mar 11 03:04:41.699: //-1//RTSP:RS35:/rtsp_api_handle_req_set_params: msg=0x63A5A304
*Mar 11 03:04:41.699: //-1//RTSP:RS35:/rtsp_api_free_msg_buffer: msg=0x63A5A304
*Mar 11 03:04:41.703: //-1//RTSP:RS35:/rtsp_api_request: msg=0x63A5A650
*Mar 11 03:04:41.703: //-1//RTSP:RS35:/rtsp_api_handle_req_set_params: msg=0x63A5A650
*Mar 11 03:04:41.703: //146//RTSP:LP:RS35:/rtsp_api_handle_req_set_params:
*Mar 11 03:04:41.703: //-1//RTSP:RS35:/rtsp_api_free_msg_buffer: msg=0x63A5A650
*Mar 11 03:04:41.703: //-1//RTSP:RS36:/rtsp_api_request: msg=0x63A5A99C
*Mar 11 03:04:41.703: //-1//RTSP:RS36:/rtsp_api_handle_req_set_params: msg=0x63A5A99C
*Mar 11 03:04:41.703: //146//RTSP:LP:RS36:/rtsp_api_handle_req_set_params:
*Mar 11 03:04:41.703: //-1//RTSP:RS36:/rtsp_api_free_msg_buffer: msg=0x63A5A99C
Router!call answered
Router#!digits dialed
Router#!call terminated
*Mar 11 03:05:15.367: //-1//RTSP:RS35:/rtsp_api_request: msg=0x63A5ACE8
*Mar 11 03:05:15.367: //-1//RTSP:RS36:/rtsp_api_request: msg=0x63A5B034
*Mar 11 03:05:15.367: //-1//RTSP:RS35:/rtsp_api_free_msg_buffer: msg=0x63A5ACE8
*Mar 11 03:05:15.367: //-1//RTSP:RS36:/rtsp_api_free_msg_buffer: msg=0x63A5B034
The following table describes the significant fields shown in the display.
debug rtsp client
NoteEffective with Release 12.3(4), the debug rtsp cleint command is replaced by the debug rtsp session command. See the debug rtsp session command for more information.
To display client information and stream information for the stream that is currently active for the Real Time Streaming Protocol (RTSP) client, use the debug rtsp clientcommand in privileged EXEC mode. To disable debugging output, use the no form of this command.
Usage Guidelines
We recommend that you log output from the debug rtsp client command to a buffer rather than sending the output to the console; otherwise, the size of the output could severely impact the performance of the gateway.
Related Commands
Command
Description
debug rtsp api
Displays debugging output for the RTSP client API.
debug rtsp error
Displays error message for RTSP data.
debug rtsp pmh
Displays debugging messages for the PMH.
debug rtsp socket
Displays debugging output for the RTSP client socket data.
voice call debug
Allows configuration of the voice call debugging output.
debug rtsp client session
NoteEffective with Release 12.3(4), the debug rtsp cleint sessioncommand is replaced by the debug rtsp session command. See the debug rtsp session command for more information.
To display debug messages about the Real Time Streaming Protocol (RTSP) client or the current session, use the debug rtspcommand. To disable debugging output, use the no form of this command.
Syntax Description
client
(Optional) Displays client information and stream information for the stream that is currently active.
session
(Optional) Displays cumulative information about the session, packet statistics, and general call information such as call ID, session ID, individual RTSP stream URLs, packet statistics, and play duration.
Examples
The following example displays the debug messages of the RTSP session:
Router# debug rtsp session RTSP client session debugging is on router# Jan 1 00:08:36.099:rtsp_get_new_scb: Jan 1 00:08:36.099:rtsp_initialize_scb: Jan 1 00:08:36.099:rtsp_control_process_msg: Jan 1 00:08:36.099:rtsp_control_process_msg:received MSG request of TYPE 0 Jan 1 00:08:36.099:rtsp_set_event: Jan 1 00:08:36.099:rtsp_set_event:api_req_msg_type=RTSP_API_REQ_PLAY Jan 1 00:08:36.103:rtsp_set_event:url:[rtsp://rtsp-cisco.cisco.com:554/en_welcome.au] Jan 1 00:08:36.103:rtsp_process_async_event:SCB=0x62128F08 Jan 1 00:08:36.103:rtsp_process_async_event:rtsp_state = RTSP_SES_STATE_IDLE rtsp_event = RTSP_EV_PLAY_OR_REC Jan 1 00:08:36.103:act_idle_event_play_or_rec_req: Jan 1 00:08:36.103:rtsp_resolve_dns: Jan 1 00:08:36.103:rtsp_resolve_dns:IP Addr = 1.13.79.6: Jan 1 00:08:36.103:rtsp_connect_to_svr: Jan 1 00:08:36.103:rtsp_connect_to_svr:socket=0, connection_state = 2 Jan 1 00:08:36.103:rtsp_start_timer:timer (0x62128FD0)starts - delay (10000) Jan 1 00:08:36.107:rtsp_control_main:SOCK= 0 Event=0x1 Jan 1 00:08:36.107:rtsp_stop_timer:timer(0x62128FD0) stops Jan 1 00:08:36.107:rtsp_process_async_event:SCB=0x62128F08 Jan 1 00:08:36.107:rtsp_process_async_event:rtsp_state = RTSP_SES_STATE_IDLE rtsp_event = RTSP_EV_SVR_CONNECTED Jan 1 00:08:36.107:act_idle_event_svr_connected: Jan 1 00:08:36.107:rtsp_control_main:SOCK= 0 Event=0x1 Jan 1 00:08:36.783:rtsp_control_main:SOCK= 0 Event=0x1 Jan 1 00:08:36.783:rtsp_process_async_event:SCB=0x62128F08 Jan 1 00:08:36.783:rtsp_process_async_event:rtsp_state = RTSP_SES_STATE_READY rtsp_event = RTSP_EV_SVR_DESC_OR_ANNOUNCE_RESP Jan 1 00:08:36.783:act_ready_event_desc_or_announce_resp: Jan 1 00:08:36.783:act_ready_event_desc_or_announce_resp:RTSP_STATUS_DESC_OR_ANNOUNCE_RESP_OK Jan 1 00:08:37.287:rtsp_control_main:SOCK= 0 Event=0x1 Jan 1 00:08:37.287:rtsp_process_async_event:SCB=0x62128F08 Jan 1 00:08:37.287:rtsp_process_async_event:rtsp_state = RTSP_SES_STATE_READY rtsp_event = RTSP_EV_SVR_SETUP_RESP Jan 1 00:08:37.287:act_ready_event_setup_resp: Jan 1 00:08:37.287:act_ready_event_setup_resp:Remote RTP Port=13344 Jan 1 00:08:37.287:rtsp_rtp_stream_setup:scb=0x62128F08, callID=0x7 record=0 Jan 1 00:08:37.287:rtsp_rtp_stream_setup:Starting RTCP session. Local IP addr = 1.13.79.45, Remote IP addr = 1.13.79.6, Local RTP port = 18748, Remote RTP port = 13344 CallID=8 Jan 1 00:08:37.291:xmit_func = 0x0 vdbptr = 0x61A0FC98 Jan 1 00:08:37.291:rtsp_control_main:CCAPI Queue Event Jan 1 00:08:37.291:rtsp_rtp_associate_done:ev=0x62070E08, callID=0x7 Jan 1 00:08:37.291:rtsp_rtp_associate_done:scb=0x62128F08 Jan 1 00:08:37.291:rtsp_rtp_associate_done:callID=0x7, pVdb=0x61F4FBC8, Jan 1 00:08:37.291: spi_context=0x6214145C Jan 1 00:08:37.291: disposition=0, playFunc=0x60CA2238, Jan 1 00:08:37.291: codec=0x5, vad=0, mediaType=6, Jan 1 00:08:37.291: stream_assoc_id=1 Jan 1 00:08:37.291:rtsp_rtp_modify_session:scb=0x62128F08, callID=0x7 Jan 1 00:08:37.291:rtsp_process_async_event:SCB=0x62128F08 Jan 1 00:08:37.291:rtsp_process_async_event:rtsp_state = RTSP_SES_STATE_READY rtsp_event = RTSP_EV_ASSOCIATE_DONE Jan 1 00:08:37.291:act_ready_event_associate_done: Jan 1 00:08:37.291:rtsp_get_stream: Jan 1 00:08:37.783:rtsp_control_main:SOCK= 0 Event=0x1 Jan 1 00:08:37.783:rtsp_process_async_event:SCB=0x62128F08 Jan 1 00:08:37.783:rtsp_process_async_event:rtsp_state = RTSP_SES_STATE_READY rtsp_event = RTSP_EV_SVR_PLAY_OR_REC_RESP Jan 1 00:08:37.783:act_ready_event_play_or_rec_resp: Jan 1 00:08:37.783:rtsp_start_timer:timer (0x62128FB0)starts - delay (4249) rtsp-5# Jan 1 00:08:42.035:rtsp_process_timer_events: Jan 1 00:08:42.035:rtsp_process_timer_events:PLAY OR RECORD completed Jan 1 00:08:42.035:rtsp_process_async_event:SCB=0x62128F08 Jan 1 00:08:42.035:rtsp_process_async_event:rtsp_state = RTSP_SES_STATE_PLAY_OR_REC rtsp_event = RTSP_EV_PLAY_OR_REC_TIMER_EXPIRED Jan 1 00:08:42.035:act_play_event_play_done: Jan 1 00:08:42.035:act_play_event_play_done:elapsed play time = 4249 total play time = 4249 Jan 1 00:08:42.035:rtsp_send_teardown_to_svr: Jan 1 00:08:42.487:rtsp_control_main:SOCK= 0 Event=0x1 Jan 1 00:08:42.487:rtsp_process_async_event:SCB=0x62128F08 Jan 1 00:08:42.487:rtsp_process_async_event:rtsp_state = RTSP_SES_STATE_PLAY_OR_REC rtsp_event = RTSP_EV_SVR_TEARDOWN_RESP Jan 1 00:08:42.487:act_play_event_teardown_resp: Jan 1 00:08:42.487:rtsp_server_closed: Jan 1 00:08:42.487:rtsp_send_resp_to_api: Jan 1 00:08:42.487:rtsp_send_resp_to_api:sending RESP=RTSP_STATUS_PLAY_COMPLETE Jan 1 00:08:42.491:rtsp_rtp_teardown_stream:scb=0x62128F08, callID=0x7 Jan 1 00:08:42.491:rtsp_rtp_stream_cleanup:scb=0x62128F08, callID=0x7 Jan 1 00:08:42.491:rtsp_update_stream_stats:scb=0x62128F08, stream=0x61A43350, Jan 1 00:08:42.491:call_info=0x6214C67C, callID=0x7 Jan 1 00:08:42.491:rtsp_update_stream_stats:rx_bytes = 25992 Jan 1 00:08:42.491:rtsp_update_stream_stats:rx_packetes = 82 Jan 1 00:08:42.491:rtsp_reinitialize_scb: Jan 1 00:08:42.503:rtsp_control_process_msg: Jan 1 00:08:42.503:rtsp_control_process_msg:received MSG request of TYPE 0 Jan 1 00:08:42.503:rtsp_set_event: Jan 1 00:08:42.503:rtsp_set_event:api_req_msg_type=RTSP_API_REQ_DESTROY Jan 1 00:08:42.503:rtsp_session_cleanup: Jan 1 00:08:42.503:rtsp_create_session_history:scb=0x62128F08, callID=0x7 Jan 1 00:08:42.503:rtsp_insert_session_history_record:current=0x6214BDC8, callID=0x7 Jan 1 00:08:42.503:rtsp_insert_session_history_record:count = 3 Jan 1 00:08:42.503:rtsp_insert_session_history_record:starting history record deletion_timer of10 minutes Jan 1 00:08:42.503:rtsp_session_cleanup:deleting session:scb=0x62128F08 Router#debug rtsp error
To display error information about the Real-Time Streaming Protocol (RTSP) client, use the debug rtsp errorcommand in privileged EXEC mode. To disable debugging output, use the no form of this command.
Usage Guidelines
We recommend that you log output from the debug rtsp errorcommand to a buffer rather than sending the output to the console; otherwise, the size of the output could severely impact the performance of the gateway.
debug rtsp pmh
To display debugging information about the Protocol Message Handler (PMH), use the debug rtsp pmhcommand in privileged EXEC mode. To disable debugging output, use the no form of this command.
Usage Guidelines
We recommend that you log output from the debug rtsp pmh command to a buffer rather than sending the output to the console; otherwise, the size of the output could severely impact the performance of the gateway.
debug rtsp session
To display client information and stream information for the stream that is currently active for the Real Time Streaming Protocol (RTSP) client, use the debugrtspsessioncommand in privileged EXEC mode. To disable debugging output, use the no form of this command.
Command History
Release
Modification
12.1(3)T
This command was introduced.
12.2(11)T
This command was implemented on the following platforms: Cisco 2600 series, Cisco 3620, Cisco 3640, and Cisco 3660, Cisco AS5350, Cisco AS5400, Cisco AS5850, Cisco AS5300, Cisco AS5800, and Cisco MC3810.
12.3(4)T
This command replaces the debugrtspclient command and the debugrtspclientsession command.
Usage Guidelines
We recommend that you log output from the debugrtspsession command to a buffer rather than sending the output to the console; otherwise, the size of the output could severely impact the performance of the gateway.
Examples
The following example shows the display of the debugging messages of the RTSP session:
Router# debug rtsp session
RTSP client session debugging is on
Router#
Router#!call initiated
Router#
*Mar 11 03:09:58.123: //-1//RTSP:/rtsp_get_new_scb:
*Mar 11 03:09:58.123: //-1//RTSP:/rtsp_initialize_scb:
*Mar 11 03:09:58.123: //-1//RTSP:/rtsplib_init_svr_session: 0x63A5FE6C
*Mar 11 03:09:58.123: //-1//RTSP:/rtsp_get_new_scb:
*Mar 11 03:09:58.123: //-1//RTSP:/rtsp_initialize_scb:
*Mar 11 03:09:58.123: //-1//RTSP:/rtsplib_init_svr_session: 0x63A5D874
Router#
Router#!call answered
Router#
Router#!digits dialed
Router#
Router#!call terminated
Router#
*Mar 11 03:10:38.139: //-1//RTSP:RS41:/rtsp_control_process_msg:
*Mar 11 03:10:38.139: //158//RTSP:/rtsp_control_process_msg: received MSG request of TYPE 0
*Mar 11 03:10:38.139: //158//RTSP:/rtsp_set_event: api_req_msg_type=RTSP_API_REQ_DESTROY
*Mar 11 03:10:38.139: //158//RTSP:/rtsp_session_cleanup:
*Mar 11 03:10:38.139: //-1//RTSP:/rtsplib_free_svr_session:
*Mar 11 03:10:38.139: //-1//RTSP:/rtsplib_stop_timer: timer(0x638D5DDC) stops
*Mar 11 03:10:38.143: //158//RTSP:/rtsp_create_session_history: scb=0x63A5FE6C, callID=0x9E
*Mar 11 03:10:38.143: //158//RTSP:/rtsp_create_session_history: No streams in session control block
*Mar 11 03:10:38.143: //158//RTSP:/rtsp_session_cleanup: deleting session: scb=0x63A5FE6C
*Mar 11 03:10:38.143: //-1//RTSP:RS42:/rtsp_control_process_msg:
*Mar 11 03:10:38.143: //158//RTSP:/rtsp_control_process_msg: received MSG request of TYPE 0
*Mar 11 03:10:38.143: //158//RTSP:/rtsp_set_event: api_req_msg_type=RTSP_API_REQ_DESTROY
*Mar 11 03:10:38.143: //158//RTSP:/rtsp_session_cleanup:
*Mar 11 03:10:38.143: //-1//RTSP:/rtsplib_free_svr_session:
*Mar 11 03:10:38.143: //-1//RTSP:/rtsplib_stop_timer: timer(0x63A60110) stops
*Mar 11 03:10:38.143: //158//RTSP:/rtsp_create_session_history: scb=0x63A5D874, callID=0x9E
*Mar 11 03:10:38.143: //158//RTSP:/rtsp_create_session_history: No streams in session control block
*Mar 11 03:10:38.143: //158//RTSP:/rtsp_session_cleanup: deleting session: scb=0x63A5D874
The following table describes the significant fields shown in the display.
Related Commands
Command
Description
debug rtsp api
Displays debugging output for the RTSP client API.
debug rtsp error
Displays error message for RTSP data.
debug rtsp pmh
Displays debugging messages for the PMH.
debug rtsp socket
Displays debugging output for the RTSP client socket data.
voice call debug
Allows configuration of the voice call debugging output.
debug rtsp socket
To display debugging messages about the packets received or sent on the TCP or User Datagram Protocol (UDP) sockets, use the debug rtsp socketcommand in privileged EXEC mode. To disable debugging output, use the no form of this command.
Command History
Release
Modification
12.1(3)T
This command was introduced.
12.2(11)T
This command was implemented on the following platforms: Cisco 2600 series, Cisco 3620, Cisco 3640, and Cisco 3660, Cisco AS5350, Cisco AS5400, Cisco AS5850, Cisco AS5300, Cisco AS5800, and Cisco MC3810.
12.2SX
This command is supported in the Cisco IOS Release 12.2SX train. Support in a specific 12.2SX release of this train depends on your feature set, platform, and platform hardware.
Usage Guidelines
Each Real-Time Streaming Protocol (RTSP) session has a TCP port for control and a UDP (RTP) port for delivery of data. The control connection (TCP socket) is used to exchange a set of messages (request from the RTSP client and the response from the server) for displaying a prompt. The debug rtsp socket command enables the user to debug the message exchanges being done on the TCP control connection.
NoteWe recommend that you log output from the debug rtsp socket command to a buffer rather than sending the output to the console; otherwise, the size of the output could severely impact the performance of the gateway.
debug rudpv1
For debug information for Reliable User Datagram Protocol (RUDP), use the debug rudpv1 command in privileged EXEC mode. To disable debugging output, use the noform of this command.
debug rudpv1 { application | performance | retransmit | segment | signal | state | timer | transfer }
no debug rudpv1 { application | performance | retransmit | segment | signal | state | timer | transfer }
Command History
Release
Modification
12.1(1)T
This command was introduced.
12.2(4)T
This command was implemented on the Cisco 2600 series, Cisco 3600 series, and Cisco MC3810.
12.2(2)XB
This command was implemented on the Cisco AS5350 and Cisco AS5400 universal gateways.
12.2(2)XB1
This command was implemented on the Cisco AS5850 platform.
12.2(8)T
This command was implemented on Cisco IAD2420 series integrated access devices (IADs).
12.2(11)T
This command was implemented on the Cisco AS5350, Cisco AS5400, and Cisco AS5850 platforms.
12.2(33)SRA
This command was integrated into Cisco IOS Release 12.2(33)SRA.
Examples
The following is sample output from the debug rudpv1 application command:
Router# debug rudpv1 application
Rudpv1:Turning application debugging on
*Jan  1 00:20:38.271:Send to appl (61F72B6C), seq 12
*Jan  1 00:20:48.271:Send to appl (61F72B6C), seq 13
*Jan  1 00:20:58.271:Send to appl (61F72B6C), seq 14
*Jan  1 00:21:08.271:Send to appl (61F72B6C), seq 15
*Jan  1 00:21:18.271:Send to appl (61F72B6C), seq 16
*Jan  1 00:21:28.271:Send to appl (61F72B6C), seq 17
*Jan  1 00:21:38.271:Send to appl (61F72B6C), seq 18
*Jan  1 00:21:48.275:Send to appl (61F72B6C), seq 19
*Jan  1 00:21:58.275:Send to appl (61F72B6C), seq 20
*Jan  1 00:22:08.275:Send to appl (61F72B6C), seq 21
*Jan  1 00:22:18.275:Send to appl (61F72B6C), seq 22
*Jan  1 00:22:28.275:Send to appl (61F72B6C), seq 23
*Jan  1 00:22:38.275:Send to appl (61F72B6C), seq 24
*Jan  1 00:22:48.279:Send to appl (61F72B6C), seq 25
*Jan  1 00:22:58.279:Send to appl (61F72B6C), seq 26
*Jan  1 00:23:08.279:Send to appl (61F72B6C), seq 27
*Jan  1 00:23:18.279:Send to appl (61F72B6C), seq 28
*Jan  1 00:23:28.279:Send to appl (61F72B6C), seq 29
The following is sample output from the debug rudpv1 performance command:
Router# debug rudpv1 performance
Rudpv1:Turning performance debugging on
corsair-f#
*Jan  1 00:44:27.299:
*Jan  1 00:44:27.299:Rudpv1 Sent:Pkts 11,  Data Bytes 236,  Data Pkts 9
*Jan  1 00:44:27.299:Rudpv1 Rcvd:Pkts 10,  Data Bytes 237,  Data Pkts 9
*Jan  1 00:44:27.299:Rudpv1 Discarded:0,  Retransmitted 0
*Jan  1 00:44:27.299:
*Jan  1 00:44:37.299:
*Jan  1 00:44:37.299:Rudpv1 Sent:Pkts 11,  Data Bytes 236,  Data Pkts 9
*Jan  1 00:44:37.299:Rudpv1 Rcvd:Pkts 10,  Data Bytes 237,  Data Pkts 9
*Jan  1 00:44:37.299:Rudpv1 Discarded:0,  Retransmitted 0
*Jan  1 00:44:37.299:
*Jan  1 00:44:47.299:
*Jan  1 00:44:47.299:Rudpv1 Sent:Pkts 11,  Data Bytes 236,  Data Pkts 9
*Jan  1 00:44:47.299:Rudpv1 Rcvd:Pkts 11,  Data Bytes 236,  Data Pkts 9
*Jan  1 00:44:47.299:Rudpv1 Discarded:0,  Retransmitted 0
*Jan  1 00:44:47.299:
The following is sample output from the debug rudpv1 retransmit command:
Router# debug rudpv1 retransmit
Rudpv1:Turning retransmit/softreset debugging on
*Jan  1 00:52:59.799:Retrans timer, set to ack 199
*Jan  1 00:52:59.903:Retrans timer, set to ack 200
*Jan  1 00:53:00.003:Retrans timer, set to ack 201
*Jan  1 00:53:00.103:Retrans timer, set to ack 202
*Jan  1 00:53:00.203:Retrans timer, set to ack 203
*Jan  1 00:53:00.419:Retrans timer, set to ack 97
*Jan  1 00:53:00.503:Retrans handler fired, 203
*Jan  1 00:53:00.503:Retrans:203:205:
*Jan  1 00:53:00.503:
*Jan  1 00:53:00.607:Retrans timer, set to ack 207
*Jan  1 00:53:00.907:Retrans timer, set to ack 210
*Jan  1 00:53:01.207:Retrans handler fired, 210
*Jan  1 00:53:01.207:Retrans:210:211:212:
*Jan  1 00:53:01.207:
*Jan  1 00:53:01.207:Retrans timer, set to ack 213
*Jan  1 00:53:01.311:Retrans timer, set to ack 214
*Jan  1 00:53:01.419:Retrans timer, set to ack 98
*Jan  1 00:53:01.611:Retrans timer, set to ack 215
*Jan  1 00:53:01.711:Retrans timer, set to ack 218
*Jan  1 00:53:01.811:Retrans timer, set to ack 219
*Jan  1 00:53:01.911:Retrans timer, set to ack 220
*Jan  1 00:53:02.011:Retrans timer, set to ack 221
*Jan  1 00:53:02.311:Retrans handler fired, 221
*Jan  1 00:53:02.311:Retrans:221:
*Jan  1 00:53:02.311:
*Jan  1 00:53:02.311:Retrans timer, set to ack 222
*Jan  1 00:53:02.415:Retrans timer, set to ack 225
The following is sample output from the debug rudpv1 segment command:
Router# debug rudpv1 segment
Rudpv1:Turning segment debugging on
*Jan  1 00:41:36.359:Rudpv1: (61F72DAC) Rcvd ACK 61..198 (32)
*Jan  1 00:41:36.359:Rudpv1: (61F72DAC) Send ACK 199..61 (32)
*Jan  1 00:41:36.459:Rudpv1: (61F72DAC) Rcvd ACK 62..199 (8)
*Jan  1 00:41:36.459:Rudpv1: (61F72DAC) Rcvd ACK 62..199 (32)
*Jan  1 00:41:36.459:Rudpv1: (61F72DAC) Send ACK 200..62 (32)
*Jan  1 00:41:36.559:Rudpv1: (61F72DAC) Rcvd ACK 63..200 (32)
*Jan  1 00:41:36.559:Rudpv1: (61F72DAC) Send ACK 201..63 (32)
*Jan  1 00:41:36.659:Rudpv1: (61F72DAC) Rcvd ACK 64..201 (32)
*Jan  1 00:41:36.659:Rudpv1: (61F72DAC) Send ACK 202..64 (32)
*Jan  1 00:41:36.759:Rudpv1: (61F72DAC) Rcvd ACK 65..202 (32)
*Jan  1 00:41:36.759:Rudpv1: (61F72DAC) Send ACK 203..65 (32)
*Jan  1 00:41:36.859:Rudpv1: (61F72DAC) Rcvd ACK 66..202 (32)
*Jan  1 00:41:36.859:Rudpv1: (61F72DAC) Send ACK 204..66 (32)
*Jan  1 00:41:36.959:Rudpv1: (61F72DAC) Rcvd ACK 67..202 (32)
*Jan  1 00:41:36.959:Rudpv1: (61F72DAC) Rcvd ACK EAK 68..202 (9)
*Jan  1 00:41:36.959:Rudpv1: (61F72DAC) Send ACK 203..67 (32)
*Jan  1 00:41:36.963:Rudpv1: (61F72DAC) Send ACK 205..67 (32)
*Jan  1 00:41:36.963:Rudpv1: (61F72DAC) Rcvd ACK 68..204 (8)
*Jan  1 00:41:37.051:Rudpv1: (61F72B6C) Send ACK NUL 118..96 (8)
*Jan  1 00:41:37.051:Rudpv1: (61F72B6C) Rcvd ACK 97..118 (8)
*Jan  1 00:41:37.059:Rudpv1: (61F72DAC) Rcvd ACK 68..205 (32)
*Jan  1 00:41:37.063:Rudpv1: (61F72DAC) Send ACK 206..68 (32)
*Jan  1 00:41:37.263:Rudpv1: (61F72DAC) Rcvd ACK 70..206 (32)
*Jan  1 00:41:37.363:Rudpv1: (61F72DAC) Send ACK EAK 207..68 (9)
*Jan  1 00:41:37.363:Rudpv1: (61F72DAC) Rcvd ACK 71..206 (32)
*Jan  1 00:41:37.363:Rudpv1: (61F72DAC) Rcvd ACK 69..206 (32)
*Jan  1 00:41:37.363:Rudpv1: (61F72DAC) Send ACK 207..71 (8)
*Jan  1 00:41:37.363:Rudpv1: (61F72DAC) Send ACK 207..71 (32)
*Jan  1 00:41:37.363:Rudpv1: (61F72DAC) Send ACK 208..71 (32)
*Jan  1 00:41:37.363:Rudpv1: (61F72DAC) Send ACK 209..71 (32)
*Jan  1 00:41:37.367:Rudpv1: (61F72DAC) Rcvd ACK 72..209 (8)
*Jan  1 00:41:37.463:Rudpv1: (61F72DAC) Rcvd ACK 72..209 (32)
*Jan  1 00:41:37.463:Rudpv1: (61F72DAC) Send ACK 210..72 (32)
*Jan  1 00:41:37.563:Rudpv1: (61F72DAC) Rcvd ACK 73..210 (32)
*Jan  1 00:41:37.563:Rudpv1: (61F72DAC) Send ACK 211..73 (32)
The following is sample output from the debug rudpv1 signal command:
Router# debug rudpv1 signal
Rudpv1:Turning signal debugging on
*Jan  1 00:39:59.551:Rudpv1:Sent CONN_FAILED to connID 61F72DAC, sess 33
*Jan  1 00:39:59.551:
*Jan  1 00:39:59.551:Rudpv1:Sent CONN_TRANS_STATE to connID 61F72B6C, sess 34
*Jan  1 00:39:59.551:
*Jan  1 00:39:59.551:Rudpv1:Sent CONN_TRANS_STATE to connID 61F72DAC, sess 33
*Jan  1 00:39:59.551:
*Jan  1 00:39:59.551:Rudpv1:Sent CONN_OPEN to connID 61F72B6C, sess 34
*Jan  1 00:39:59.551:Rudpv1:Sent AUTO_RESET to connID 61F72DAC, sess 33
*Jan  1 00:39:59.551:
*Jan  1 00:40:00.739:%LINK-5-CHANGED:Interface FastEthernet0, changed state
to administratively down
*Jan  1 00:40:01.739:%LINEPROTO-5-UPDOWN:Line protocol on Interface
FastEthernet0, changed state to down
*Jan  1 00:40:04.551:Rudpv1:Sent CONN_RESET to connID 61F72DAC, sess 33
*Jan  1 00:40:04.551:
*Jan  1 00:40:05.051:Rudpv1:Clearing conn rec values, index 2, connid
61F72DAC
*Jan  1 00:40:10.051:Rudpv1:Sent CONN_RESET to connID 61F72DAC, sess 33
*Jan  1 00:40:10.051:
*Jan  1 00:40:10.551:Rudpv1:Clearing conn rec values, index 2, connid
61F72DAC
*Jan  1 00:40:15.551:Rudpv1:Sent CONN_RESET to connID 61F72DAC, sess 33
*Jan  1 00:40:15.551:
*Jan  1 00:40:16.051:Rudpv1:Clearing conn rec values, index 2, connid
61F72DAC
*Jan  1 00:40:21.051:Rudpv1:Sent CONN_RESET to connID 61F72DAC, sess 33
*Jan  1 00:40:21.051:
*Jan  1 00:40:21.551:Rudpv1:Clearing conn rec values, index 2, connid
61F72DAC
*Jan  1 00:40:25.587:%LINK-3-UPDOWN:Interface FastEthernet0, changed state
to up
*Jan  1 00:40:26.551:Rudpv1:Sent CONN_RESET to connID 61F72DAC, sess 33
*Jan  1 00:40:26.551:
*Jan  1 00:40:26.587:%LINEPROTO-5-UPDOWN:Line protocol on Interface
FastEthernet0, changed state to up
*Jan  1 00:40:27.051:Rudpv1:Clearing conn rec values, index 2, connid
61F72DAC
*Jan  1 00:40:28.051:Rudpv1:Sent CONN_OPEN to connID 61F72DAC, sess 33
The following is sample output from the debug rudpv1 state command:
Router# debug rudpv1 state
Rudpv1:Turning state debugging on
*Jan  1 00:38:37.323:Rudpv1: (61F72DAC) State Change:OPEN -> CONN_FAILURE
*Jan  1 00:38:37.323:Rudpv1: (61F72B6C) State Change:OPEN -> TRANS_STATE
*Jan  1 00:38:37.323:Rudpv1: (61F72DAC) State Change:CONN_FAILURE ->
TRANS_STATE
*Jan  1 00:38:37.323:Rudpv1: (61F72B6C) State Change:TRANS_STATE -> OPEN
*Jan  1 00:38:37.323:Rudpv1: (61F72DAC) State Change:TRANS_STATE -> SYN_SENT
*Jan  1 00:38:37.455:%LINK-5-CHANGED:Interface FastEthernet0, changed state
to administratively down
*Jan  1 00:38:38.451:%LINEPROTO-5-UPDOWN:Line protocol on Interface
FastEthernet0, changed state to down
*Jan  1 00:38:42.323:Rudpv1: (61F72DAC) State Change:SYN_SENT -> CLOSED
*Jan  1 00:38:42.823:Rudpv1: (61F72DAC) State Change:INACTIVE -> SYN_SENT
*Jan  1 00:38:47.823:Rudpv1: (61F72DAC) State Change:SYN_SENT -> CLOSED
*Jan  1 00:38:48.323:Rudpv1: (61F72DAC) State Change:INACTIVE -> SYN_SENT
*Jan  1 00:38:53.323:Rudpv1: (61F72DAC) State Change:SYN_SENT -> CLOSED
*Jan  1 00:38:53.823:Rudpv1: (61F72DAC) State Change:INACTIVE -> SYN_SENT
*Jan  1 00:38:56.411:%LINK-3-UPDOWN:Interface FastEthernet0, changed state
to up
*Jan  1 00:38:57.411:%LINEPROTO-5-UPDOWN:Line protocol on Interface
FastEthernet0, changed state to up
*Jan  1 00:38:57.823:Rudpv1: (61F72DAC) State Change:SYN_SENT -> OPEN
The following is sample output from the debug rudpv1 timer command:
Router# debug rudpv1 timer
Rudpv1:Turning timer debugging on
*Jan  1 00:53:40.647:Starting Retrans timer for connP = 61F72B6C, delay = 300
*Jan  1 00:53:40.647:Stopping SentList timer for connP = 61F72B6C
*Jan  1 00:53:40.747:Starting NullSeg timer for connP = 61F72B6C, delay = 1000
*Jan  1 00:53:40.747:Stopping Retrans timer for connP = 61F72B6C
*Jan  1 00:53:40.747:Starting Retrans timer for connP = 61F72B6C, delay = 300
*Jan  1 00:53:40.747:Stopping SentList timer for connP = 61F72B6C
*Jan  1 00:53:40.847:Starting NullSeg timer for connP = 61F72B6C, delay = 1000
*Jan  1 00:53:40.847:Stopping Retrans timer for connP = 61F72B6C
*Jan  1 00:53:40.847:Starting Retrans timer for connP = 61F72B6C, delay = 300
*Jan  1 00:53:40.847:Stopping SentList timer for connP = 61F72B6C
*Jan  1 00:53:40.947:Starting NullSeg timer for connP = 61F72B6C, delay = 1000
*Jan  1 00:53:40.947:Stopping Retrans timer for connP = 61F72B6C
*Jan  1 00:53:40.947:Starting Retrans timer for connP = 61F72B6C, delay = 300
*Jan  1 00:53:40.947:Stopping SentList timer for connP = 61F72B6C
*Jan  1 00:53:41.047:Starting NullSeg timer for connP = 61F72B6C, delay = 1000
*Jan  1 00:53:41.147:Starting NullSeg timer for connP = 61F72B6C, delay = 1000
*Jan  1 00:53:41.151:Starting NullSeg timer for connP = 61F72B6C, delay = 1000
*Jan  1 00:53:41.151:Starting NullSeg timer for connP = 61F72B6C, delay = 1000
*Jan  1 00:53:41.151:Stopping Retrans timer for connP = 61F72B6C
*Jan  1 00:53:41.151:Starting SentList timer for connP = 61F72B6C, delay = 300
*Jan  1 00:53:41.419:Timer Keepalive (NullSeg) triggered for conn = 61F72DAC
*Jan  1 00:53:41.419:Starting Retrans timer for connP = 61F72DAC, delay = 300
*Jan  1 00:53:41.419:Stopping SentList timer for connP = 61F72DAC
*Jan  1 00:53:41.419:Starting NullSeg timer for connP = 61F72DAC, delay = 1000
*Jan  1 00:53:41.419:Stopping Retrans timer for connP = 61F72DAC
*Jan  1 00:53:41.451:Timer SentList triggered for conn = 61F72B6C
*Jan  1 00:53:41.451:Starting SentList timer for connP = 61F72B6C, delay = 300
*Jan  1 00:53:41.451:Starting NullSeg timer for connP = 61F72B6C, delay = 1000
*Jan  1 00:53:41.451:Stopping SentList timer for connP = 61F72B6C
*Jan  1 00:53:41.551:Starting NullSeg timer for connP = 61F72B6C, delay = 1000
*Jan  1 00:53:41.551:Starting NullSeg timer for connP = 61F72B6C, delay = 1000
*Jan  1 00:53:41.551:Starting NullSeg timer for connP = 61F72B6C, delay = 1000
*Jan  1 00:53:41.551:Starting NullSeg timer for connP = 61F72B6C, delay = 1000
The following is sample output from the debug rudpv1 transfer command:
Router# debug rudpv1 transfer
Rudpv1:Turning transfer debugging on
*Jan  1 00:37:30.567:Rudpv1:Send TCS, connId 61F72B6C, old connId 61F72DAC
*Jan  1 00:37:30.567:Rudpv1:Initiate transfer state, old conn 61F72DAC to
new conn 61F72B6C
*Jan  1 00:37:30.567:Rudpv1:Old conn send window 51 .. 52
*Jan  1 00:37:30.567:Rudpv1:New conn send window 255 .. 2
*Jan  1 00:37:30.567:Rudpv1:Rcvd TCS 142, next seq 142
*Jan  1 00:37:30.567:Rudpv1:Rcv'ing trans state, old conn 61F72DAC to new
conn 61F72B6C
*Jan  1 00:37:30.567:Rudpv1:Seq adjust factor 148
*Jan  1 00:37:30.567:Rudpv1:New rcvCur 142
*Jan  1 00:37:30.567:Rudpv1:Send transfer state, old conn 61F72DAC to new
conn 61F72B6C
*Jan  1 00:37:30.567:Rudpv1:Send TCS, connId 61F72B6C, old connId 61F72DAC,
seq adjust 208, indication 0
*Jan  1 00:37:30.567:Rudpv1:Transfer seg 51 to seg 3 on new conn
*Jan  1 00:37:30.567:Rudpv1:Finishing transfer state, old conn 61F72DAC to
new conn 61F72B6C
*Jan  1 00:37:30.567:Rudpv1:Send window 2 .. 4