Feedback
Table Of Contents
Cisco IPICS Dispatch Console Reference
Cisco IPICS Dispatch Console Main Window
Powered On Direct Dial Channels
Audio Replay Controls for Resources
Radio Details for Tone Control Radios Tab
Radio Details for Nextel Radios Tab
Radio Details for Nextel Radios Tab: Selectors Subtab
Radio Details for Nextel Radios Tab: Call Subtab
Radio Details for Nextel Radios Tab: Alerts Subtab
Radio Details for EF Johnson Radios Tab
Radio Details for EF Johnson Radios Tab: Selectors Subtab
Radio Details for EF Johnson Radios Tab: Alerts Subtab
Channel Details for P25 Channels Tab
Settings Tab—Audio Connections Options
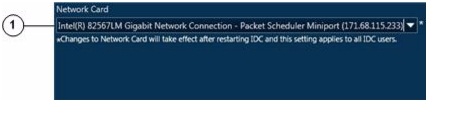
Settings Tab—Network Settings Options
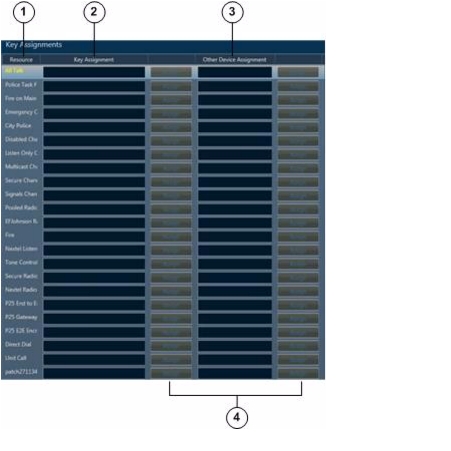
Settings Tab—Key Assignments Options
Settings Tab—Dialer-Channel Audio Options
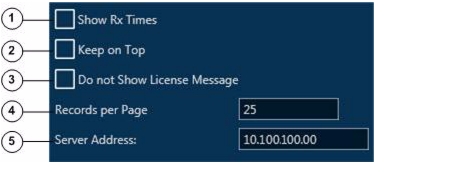
Settings Tab—Miscellaneous Options
Adding a Resource to an Incident or VTG
Obtaining a Source URL for a YouTube Video
Viewing an Image or Video in an Incident
Dial Pad and Channel Patch Area
Dialer Patch Manager Pop-Up Window
Establishing and Patching a Call from the Dial Pad and Channel Patch Area
P25 Supplementary Services Area
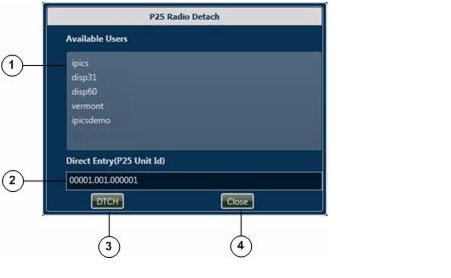
P25 Radio Detach Pop-Up Window
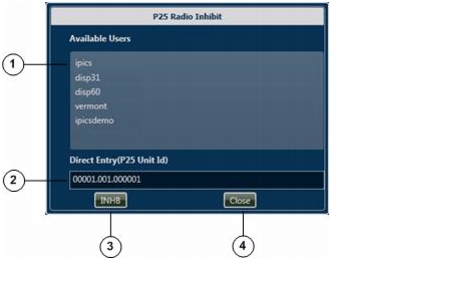
P25 Radio Inhibit Pop-Up Window
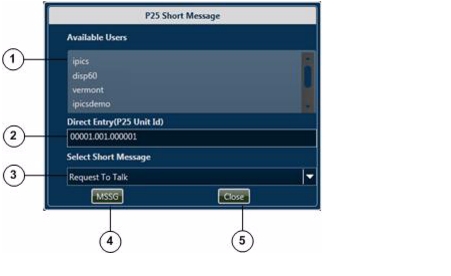
P25 Short Message Pop-Up Window
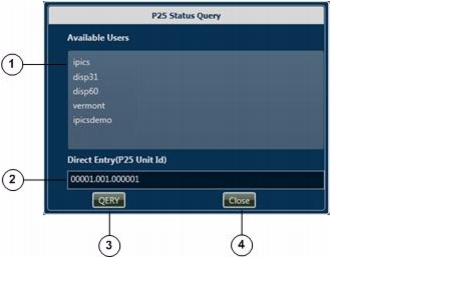
P25 Status Query Pop-Up Window
P25 Radio Unit Monitor Pop-Up Window
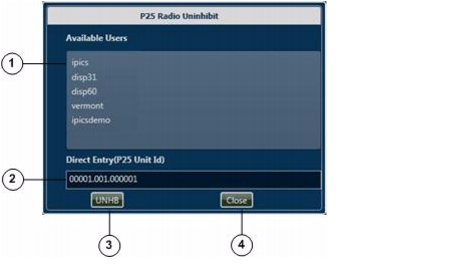
P25 Radio Uninhibit Pop-Up Window
All Talk and Patch Controls Area
Responding to Emergency Mode in the Cisco IPICS Dispatch Console
Responding to Emergency Mode in the SRCI
Cisco IPICS Dispatch Console Reference
This chapter provides detailed information about the screens, windows, and options in the Cisco IPICS Dispatch Console.
The information, buttons, and tabs that are available to you in the Cisco IPICS Dispatch Console depend on your Cisco IPICS Dispatch Console user license type, your Cisco IPICS user type and the items with which you are associated in the Cisco IPICS Administration Console. For related information, see the "Cisco IPICS Dispatch Console License Types" section and the "Cisco IPICS Dispatch Console Features Available by User Type" section.
In addition, most resources must be associated with your Cisco IPICS ops view before you can see and access them in the Cisco IPICS Dispatch Console.
This chapter includes these topics:
•
Cisco IPICS Dispatch Console Main Window
•
•
•
Cisco IPICS Dispatch Console Main Window
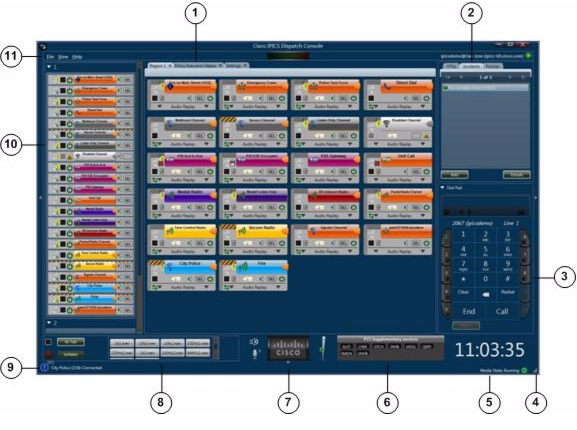
The Main window appears when you log in to the Cisco IPICS Dispatch Console. This window provides access to the Cisco IPICS Dispatch Console features and provide tools for managing incidents, VTGs, channels, radios, resources, and related items.
Figure 3-1 illustrates the Cisco IPICS Dispatch Console Main window.
Figure 3-1 Cisco IPICS Dispatch Console Main Window
View area—Can display these tabs:
•
•
•
•
•
•
See the "View Area" section
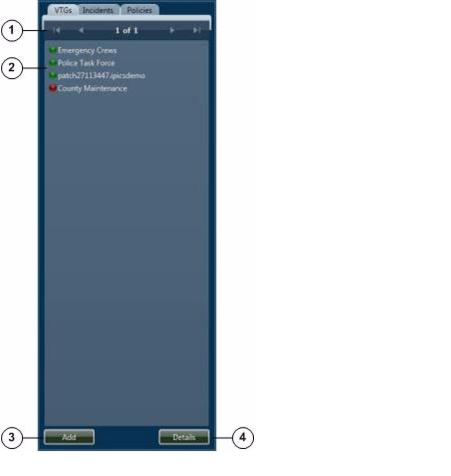
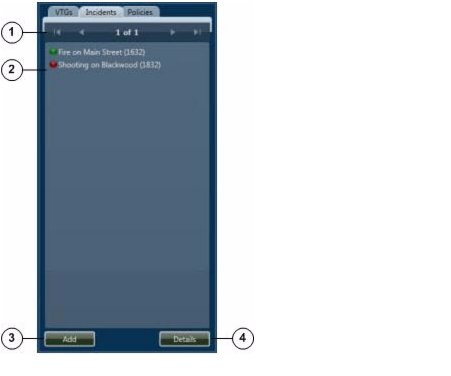
Items Tabs area—Includes tabs that list VTGs, incidents, and policies, and provides quick access to detailed information about any of these items.
A user with the Cisco IPICS Dispatcher role or All role sees the VTGs, Incidents, and Policies tabs in this area. Other Cisco IPICS users see the Policies tab only.
See the "Items Tabs Area" section
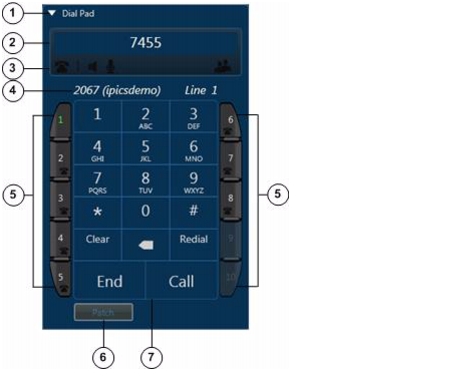
Dial Pad and Channel Patch area—Lets you place up to 10 simultaneous telephone calls and optionally patch each call to up to 3 selected resources per call.
This area is available only to users with the Cisco IPICS Dispatcher role or All role and requires a Cisco IPICS Dispatch Console Platinum user license.
Resize handle—Appears when the Main window is not maximized. Click and drag to resize the Main window.
—
System information area —Displays the system time and the status of the Wave Engine process.
P25 Supplementary Services area—Displays and provides access to the supplementary services that are defined in the Cisco IPICS Administration Console for the Cisco ISSI Gateway.
Master audio controls area—Provides controls for muting and controlling the volume of the audio that is received from all powered-on resources. Also displays information about a microphone.
All Talk and Patch Controls area—Provides controls for talking to multiple resources, patching multiple resources together, or sending alert tones to multiple resources simultaneously.
Event log message area—Displays log messages. The icon indicates the severity. The number to the right of the icon indicates how many unread messages are in the event log. Click the icon or message to see the event log.
See the "Event Log Window" section
Regions list—Displays the regions that are configured in the Cisco IPICS Administration Console and provides controls for the resources in each region.
See the "Regions List" section
Menu bar—Provides access to various Cisco IPICS Dispatch Console menus and options and information about your Cisco IPICS Dispatch Console session.
See the "Menu Bar" section
Menu Bar
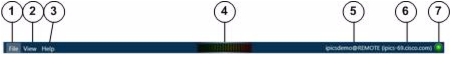
The Cisco IPICS Dispatch Console menu bar provides access to various Cisco IPICS Dispatch Console menus and options. Figure 3-2 illustrates the menu bar.
Figure 3-2 Menu Bar
File menu. Click to access the Close option, which exits the Cisco IPICS Dispatch Console. For related information, see the "Exiting the Cisco IPICS Dispatch Console" section.
View menu. Click to access these options:
•
•
•
Help menu. Click to access these options:
•
•
When this window is open, you must click OK to close it before you can access other Cisco IPICS Dispatch Console functions.
Volume indicator for outgoing audio.
Indicates your Cisco IPICS user name (to the left of the @ character) and the Cisco IPICS location to which the Cisco IPICS Dispatch Console is connected (to the right of the @ character).
Indicates the host name of the Cisco IPICS server to which the Cisco IPICS Dispatch Console is logged in.
Cisco IPICS Dispatch Console operating mode indicator. A green icon, as shown, indicates that the Cisco IPICS Dispatch Console is operating in on-line mode. A red icon indicates that it is operating in off-line mode.
View Area
The View area displays tabs from which you can control a variety of Cisco IPICS Dispatch Console features and functions. The following sections describe these tabs, features, and functions in detail:
•
•
•
•
•
Region Tab
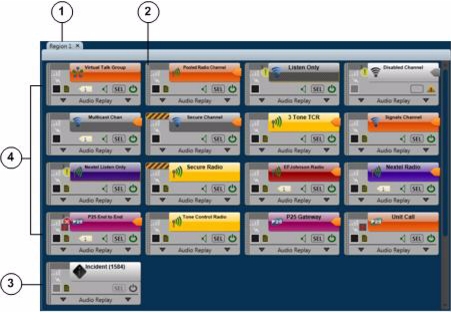
The Region tab appears by default when you start the Cisco IPICS Dispatch Console. It provides information about and controls for resources that are configured for a region and with which you are associated. The configuration and association procedures are performed in the Cisco IPICS Administration Console. Cisco IPICS supports up to 20 regions, and each one has its own Region tab.
Resources include radios, standard channels, P25 channels, VTGs, incidents, and direct dial channels. Each resource is in either the powered on state or the powered off state. When a resource is powered on, it can be used to transmit and receive audio, and various other Cisco IPICS Dispatch Console functions become available for it. You can use the Cisco IPICS Dispatch Console to communicate with other Cisco IPICS Dispatch Console users who also have powered on the resource.
An alert icon
indicates that a resource is experiencing connectivity issues or that the resource is disabled in the Cisco IPICS Administration Console.
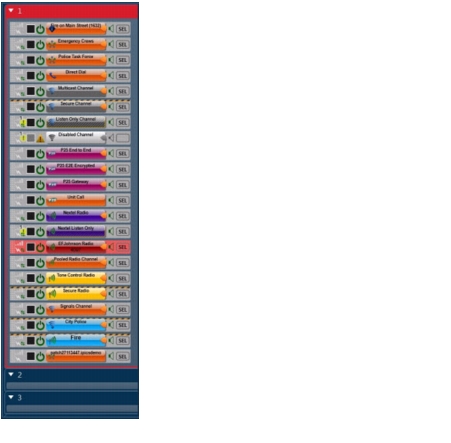
Figure 3-3 illustrates the Region tab. This example shows a region with 17 resources, which have been configured in the Cisco IPICS Administration Console. In this example, six of the resources are powered on and one is powered off. In addition, this example shows resources that have been assigned custom colors in the Cisco IPICS Administration Console. You may find that using custom colors is convenient for quickly locating resources in the Cisco IPICS Dispatch Console.
Figure 3-3 Region Tab
Name of the region as configured in the Cisco IPICS Administration Console. Cisco IPICS provides 6 default regions, with the default names Region 1 through Region 6.
Click the X to exit the tab.
Resource handle. Used to drag and drop the resource to another location in the Region tab.
Powered-off resource. When a resource is powered off, you can click the Power button
to power it on. (You also can power on a resource by clicking its Power button in the Regions list.)
When you click this button to power on a P25 channel, you are prompted for additional information that you must provide before the channel powers on. See the "Powered-On P25 Channels" section for details.
The power button for a powered on resource appears as
.
Powered-on resources. A powered-on resource displays several buttons and information, as described in the following sections:
•
When a resource is powered on, you can click the Power button
to power it off.
Note
Resources types in the Region tab are identified by icons, as follows:
•
—Channel icon
•
—P25 channel icon
•
—Direct dial channel icon
•
—Radio icon
•
—VTG icon
•
—Incident icon
A region may include more resources than you can see at once. In that case, use the scroll bars on the Region tab to display other resources.
The resources in the Region tab are arranged in a grid. You can rearrange the display by moving any resource to any empty cell in the grid. To move a resource, click and hold its handle, then drag and drop the resource to a new location. While you drag a resource, the Region tab displays the grid cells.
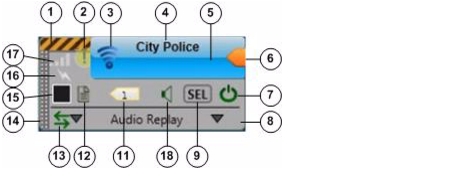
Powered-On Channels
When you power on a channel as described in Figure 3-3, you can access various controls and information that apply to the channel. Figure 3-4 illustrates a powered-on channel.
Figure 3-4 Powered-On Channel
Secure channel indicator—Yellow and black stripes
appear if this resource is configured as a secure channel in the Cisco IPICS Administration Console. Otherwise, this indicator appears gray.
Event Log Message icon—Indicates that the event log contains one or more messages that relates to this resource. The icon indicates the severity of the message and can appear as
(indicates a warning message),
(indicates an error message), or
(indicates an informational message). The number to the left of the icon indicates how many unread messages that relate to this resource are in the event log. Click the icon to see the event log. For related information, see the "Event Log Window" section.
Channel icon—Indicates that this resource is a channel.
Channel name—Name that is configured for the channel in the Cisco IPICS Administration Console.
PTT area—Click and hold anywhere in this area to talk (transmit audio) to others who are using this channel. Release when you are not talking.
If this area changes to yellow when you click it or when it is latched, you have engaged the push to talk (PTT) feature.
When you engage the PTT feature, a green bar appears at the bottom of the PTT area when the channel is ready to transmit audio. To ensure that your audio is fully transmitted, wait until the green bar completely displays before you start talking.
If this area appears gray with a red bar at the bottom when you click it, the channel cannot transmit audio. This situation can occur in a variety of cases, such as if no microphone is selected for this Cisco IPICS Dispatch Console (see the Settings Tab—Audio Connections Options).
This area displays diagonal lines if this resource is configured as listen-only or if your Cisco IPICS user account is configured as listen only.
When audio is received, this area may show the talker ID (either the Cisco IPICS user ID or the radio unit ID). Talker ID is not displayed if you are logged in using the Remote location and Cisco IPICS is using an RMS, or if your network or system cannot obtain this information.
Latch button—Appears if the latch functionality is enabled for you and this channel as follows:
•
•
Click the Latch button to latch the PTT feature. Click it again to unlatch. When you latch the PTT feature, this button becomes green and the PTT area becomes yellow.
Power button—Click to power off a powered-on channel.
This button can appear in the following states:
•
•
•
•
Expand audio replay controls area—Click anywhere in this area to display the audio replay controls. Click this area again to hide the audio replay controls.
For more information, see the "Audio Replay Controls for Resources" section.
Audio Selection button—Choose the device group to which audio that the channel receives is sent. Options are SEL, U1, U2, and U3, which correspond to the device groups SELECTED, UNSELECTED1, UNSELECTED2, and UNSELECTED3, respectively.
For information about configuring device groups, see the "Settings Tab—Audio Connections Options" section.
Mute button—Click to locally mute (silence) incoming audio traffic from the channel. The button changes to the Unmute button
. Click the Unmute button to unmute. You also can unmute by moving the volume control slider in the expanded Audio Replay Controls area.
Incident icon—Appears if the channel is a participant in one or more incidents. The number in this icon designates how many incidents the channel is a participant in. Click this icon to see the list of these incidents. Click any incident in the list to display the Incident Details tab.
For more information, see the Incident Details Tab.
Details button—Appears only if radio control signals are associated with the channel. Click to display buttons that correspond to the control signals that are configured for the channel, then click a button to send its control signal on the channel.
(Radio control signal associations are made in the Cisco IPICS Administration Console from the Signals tab in the Associations window, which you access from the Configuration > Channels window. For instructions, see Cisco IPICS Server Administration Guide.)
Patch icon—Appears if this channel is patched to one or more other resources.
For more information, see the "All Talk and Patch Controls Area" section.
Resource handle—Use to drag and drop the channel to another location in the Region tab.
For more information, see the "Region Tab" section
Select check box—Appears only if Advanced IDC Permissions are configured for you in the Cisco IPICS Administration Console. Check to include this channel when you use the PTT, Patch, or alert tones features. For information about these features, see the "All Talk and Patch Controls Area" section.
Transmit indicator—Turns red when you transmit audio on the channel.
Incoming traffic indicator—Turns green when the channel receives audio traffic.
Powered-On P25 Channels
When you power on a talk group P25 channel as described in Figure 3-3, you are prompted to provide additional information that the system requires before the channel can be used. The information depends on the P25 channel type, which can be either of the following:
•
When you power on a talk group P25 channel, you are prompted to choose a mode for the channel. Options are EndtoEnd P25 and Gateway P25.
The EndToEnd P25 option causes the resource to act as if it is a P25 radio. In this mode, advanced P25 features, such as encrypted voice data, are supported for communication with other P25 radios. However, there is a limit of four powered-on P25 channels in EndToEnd P25 mode per Cisco IPICS Dispatch Console. If you need more than four powered-on P25 channels, consider using the Gateway P25 option. This mode causes the Cisco ISSI Gateway to convert P25 voice data to G.711 multicast data. In this mode, the P25 channel functions similarly to a regular channel. The number of powered-on P25 channels in Gateway P25 mode is not limited to four.
•
When you power on a unit call P25 channel, the Subscriber ID dialog box appears. Enter your fully-qualified P25 subscriber ID, and click OK. Enter ID is in the format: WACN_ID.system_ID.unit_ID, where:
–
–
–
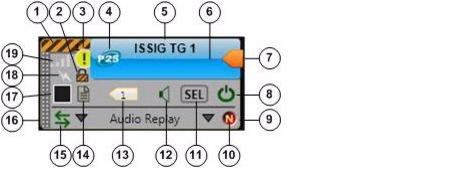
When the P25 channel is powered up, you can access various controls and information that apply to the channel. Figure 3-5 illustrates a powered-on P25 channel.
Figure 3-5 Powered-On P25 Channel
Secure channel indicator—Yellow and black stripes
appear if this resource is configured as a secure channel in the Cisco IPICS Administration Console. Otherwise, this indicator appears gray.
Lock icon—Indicates that the P25 channel is encrypted.
You enable and disable encryption for the channel by using the Transmit Mode button as described in the "Channel Details for P25 Channels Tab" section.
Event Log Message icon—Indicates that the event log contains one or more messages that relates to this resource. The icon indicates the severity of the message and can appear as
(indicates a warning message),
(indicates an error message), or
(indicates an informational message). The number to the left of the icon indicates how many unread messages that relate to this resource are in the event log. Click the icon to see the event log. For related information, see the "Event Log Window" section.
P25 icon—Indicates that this resource is a P25 channel.
Channel name—Name that is configured for the P25 channel in the Cisco IPICS Administration Console.
PTT area—Click and hold anywhere in this area to talk (transmit audio) to others who are using this P25 channel. Release when you are not talking.
If this area changes to yellow when you are clicking it or when it is latched, you have engaged the push to talk (PTT) feature. If this area flashes when you click it or when you engage latch, you do not have the floor.
When you engage the PTT feature, a green bar appears at the bottom of the PTT area when the channel is ready to transmit audio. To ensure that your audio is fully transmitted, wait until the green bar completely displays before you start talking.
If this area appears gray with a red bar at the bottom when you click it, the channel cannot transmit audio. This situation can occur in a variety of cases, such as if no microphone selected for this Cisco IPICS Dispatch Console (see the Settings Tab—Audio Connections Options).
This area displays diagonal lines if this resource is configured as listen-only or if your Cisco IPICS user account is configured as listen only.
In addition, when audio is received, this area may show the ID of the talker as follows:
•
•
When audio is received, this area may show the talker ID (either the P25 subscriber ID of the IPICS user you are communicating or the radio ID of the device you are communicating with). Talker ID is not displayed if you are logged in using the Remote location and Cisco IPICS is using an RMS, or if your network or system cannot obtain this information.
Latch button—Appears if the latch functionality is enabled for you and this P25 channel as follows:
•
•
Click the Latch button to latch the PTT feature. Click it again to unlatch. When you latch the PTT feature, this button becomes green and the PTT area becomes yellow.
Power button—Click to power off a powered-on P25 channel.
This button can appear in the following states:
•
•
•
•
Expand audio replay controls area—Click anywhere in this area to display the audio replay controls. Click this area again to hide the audio replay controls.
For more information, see the "Audio Replay Controls for Resources" section.
Mode indicator—Indicates that this P25 channel has been powered on in the EndtoEnd P25 mode.
Audio Selection button—Choose the device group to which audio that the P25 channel receives is sent. Options are SEL, U1, U2, and U3, which correspond to the device groups SELECTED, UNSELECTED1, UNSELECTED2, and UNSELECTED3, respectively.
For information about configuring device groups, see the "Settings Tab—Audio Connections Options" section.
Mute button—Click to locally mute (silence) incoming audio traffic from the P25 channel. The button changes to the Unmute button
. Click the Unmute button to unmute. You also can unmute by moving the volume control slider in the expanded Audio Replay Controls area.
Incident icon—Appears if the P25 channel is a participant in one or more incidents. The number in this icon designates how many incidents the P25 channel is a participant in. Click this icon to see the list of these incidents. Click any incident in the list to display the Incident Details tab.
For more information, see the Incident Details Tab.
Channel Details button—Click to display the Channel Details for P25 Channels tab. For more information, see the "Channel Details for P25 Channels Tab" section.
This button does not appear if Cisco IPICS is using an RMS and this P25 channel has been powered up in the Gateway P25 mode.
Patch icon—Appears if this P25 channel is patched to one or more other resources.
For more information, see the "All Talk and Patch Controls Area" section.
Resource handle—Use to drag and drop the P25 channel to another location in the Region tab.
For more information, see the "Region Tab" section
Select check box—Appears only if Advanced IDC Permissions are configured for you in the Cisco IPICS Administration Console. Check to include this P25 channel when you use the PTT, Patch, DTMF, or alert tones features. For information about these features, see the "All Talk and Patch Controls Area" section.
Transmit indicator—Turns red when you transmit audio on the P25 channel.
Incoming traffic indicator—Turns green when the P25 channel receives audio traffic.
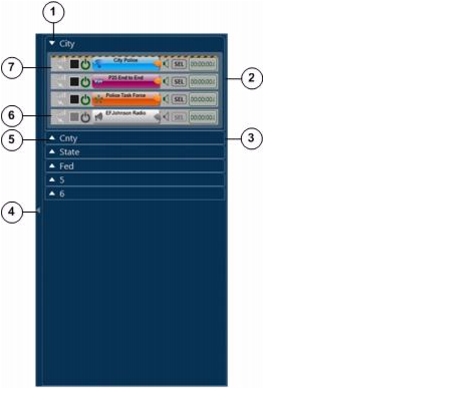
Powered On Direct Dial Channels
A direct dial channel is a channel that you can use to place a telephone call. To use this functionality, the Cisco IPICS direct dial feature must be configured and phones must be associated with you in the Cisco IPICS Administration Console. Then, each phone that is associated with you appears as a dial channel in the Cisco IPICS Dispatch Console.
When you power on a direct dial channel as described in Figure 3-3, it dials the telephone number that is configured for it. When the call is answered, you can click in the PTT area to communicate with the person who answered it.
Figure 3-6 illustrates a powered-on direct dial channel.
Figure 3-6 Powered-On Direct Dial Channel
Event Log Message icon—Indicates that the event log contains one or more messages that relates to this resource. The icon indicates the severity of the message and can appear as
(indicates a warning message),
(indicates an error message), or
(indicates an informational message). The number to the left of the icon indicates how many unread messages that relate to this resource are in the event log. Click the icon to see the event log. For related information, see the "Event Log Window" section.
Direct dial channel icon—Indicates that this resource is a channel.
Channel name—Name that is configured for the direct dial channel in the Cisco IPICS Administration Console.
PTT area—Click and hold anywhere in this area to talk (transmit audio) to others who are using this channel. Release when you are not talking.
If area changes to yellow when you are clicking it, you have engaged the push to talk (PTT) feature.
When you engage the PTT feature, a green bar appears at the bottom of the PTT area when the channel is ready to transmit audio. To ensure that your audio is fully transmitted, wait until the green bar completely displays before you start talking.
If this area appears gray with a red bar at the bottom when you click it, the channel cannot transmit audio. This situation can occur in a variety of cases, such as if no microphone is selected for this Cisco IPICS Dispatch Console (see the Settings Tab—Audio Connections Options).
Latch button—Appears if the Allow Latch option must be enabled for your Cisco IPICS user account in the Cisco IPICS Administration Console.
Click this button to latch the PTT feature. Click it again to unlatch. When you latch the PTT feature, this button becomes green and the PTT area becomes yellow.
Power button—Click to power off a powered-on direct dial channel and disconnect the telephone call.
This button can appear in the following states:
•
•
•
•
Expand audio replay controls area—Click anywhere in this area to display the audio replay controls. Click this area again to hide the audio replay controls.
For more information, see the "Audio Replay Controls for Resources" section.
Audio Selection button—Choose the device group to which audio that the direct dial channel receives is sent. Options are SEL, U1, U2, and U3, which correspond to the device groups SELECTED, UNSELECTED1, UNSELECTED2, and UNSELECTED3, respectively.
For information about configuring device groups, see the "Settings Tab—Audio Connections Options" section.
Mute button—Click to locally mute (silence) incoming audio traffic from the direct dial channel. The button changes to the Unmute button
. Click the Unmute button to unmute. You also can unmute by moving the volume control slider in the expanded Audio Replay Controls area.
Patch icon—Appears if this direct dial channel is patched to one or more other resources.
For more information, see the "All Talk and Patch Controls Area" section.
Resource handle—Use to drag and drop the direct dial channel to another location in the Region tab.
For more information, see the "Region Tab" section
Select check box—Appears only if Advanced IDC Permissions are configured for you in the Cisco IPICS Administration Console. Check to include this direct dial channel when you use the PTT, Patch, or alert tones features. For information about these features, see the "All Talk and Patch Controls Area" section.
Transmit indicator—Turns red when you transmit audio on the direct dial channel.
Incoming traffic indicator—Turns green when the direct dial channel receives audio traffic.
Powered-On Radios
When you power on a radio as described in Figure 3-3, you can access various controls and information that apply to the incident. Figure 3-7 illustrates a powered-on radio.
Figure 3-7 Powered-On Radio
Secure radio indicator—Yellow and black stripes
appear if this resource is configured as a secure radio in the Cisco IPICS Administration Console. Otherwise, this indicator appears gray.
Event Log Message icon—Indicates that the event log contains one or more messages that relates to this resource. The icon indicates the severity of the message and can appear as
(indicates a warning message),
(indicates an error message), or
(indicates an informational message). The number to the left of the icon indicates how many unread messages that relate to this resource are in the event log. Click the icon to see the event log. For related information, see the "Event Log Window" section.
Radio icon—Indicates that this resource is a radio.
Radio name—Name that is configured for the radio in the Cisco IPICS Administration Console.
PTT area—Click and hold anywhere in this area to talk (transmit audio) to others who are using this radio. Release when you are not talking.
If this area changes to yellow when you are clicking it or when it is latched, you have engaged the push to talk (PTT) feature.
When you engage the PTT feature, a green bar appears at the bottom of the PTT area when the radio is ready to transmit audio. To ensure that your audio is fully transmitted, wait until the green bar completely displays before you start talking.
If this area appears gray with a red bar at the bottom when you click it, the radio cannot transmit audio. This situation can occur in a variety of cases, such as if no microphone is selected for this Cisco IPICS Dispatch Console (see the Settings Tab—Audio Connections Options).
This area displays diagonal lines if this resource is configured as listen-only or if your Cisco IPICS user account is configured as listen only.
When audio is received, this area may show the talker ID (either the Cisco IPICS user ID or the radio unit ID). Talker ID is not displayed if you are logged in using the Remote location and Cisco IPICS is using an RMS, or if your network or system cannot obtain this information.
Latch button—Appears if the latch functionality is enabled for you and this radio as follows:
•
•
Click the Latch button to latch the PTT feature. Click it again to unlatch. When you latch the PTT feature, this button becomes green and the PTT area becomes yellow.
Power button—Click to power off a powered-on radio.
This button can appear in the following states:
•
•
•
•
Expand audio replay controls area—Click anywhere in this area to display the audio replay controls. Click this area again to hide the audio replay controls.
For more information, see the "Audio Replay Controls for Resources" section.
Audio Selection button—Choose the device group to which audio that the radio receives is sent. Options are SEL, U1, U2, and U3, which correspond to the device groups SELECTED, UNSELECTED1, UNSELECTED2, and UNSELECTED3, respectively.
For information about configuring device groups, see the "Settings Tab—Audio Connections Options" section.
Mute button—Click to locally mute (silence) incoming audio traffic from the radio. The button changes to the Unmute button
. Click the Unmute button to unmute. You also can unmute by moving the volume control slider in the expanded Audio Replay Controls area.
Incident icon—Appears if the radio is a participant in one or more incidents. The number in this icon designates how many incidents the radio is a participant in. Click this icon to see the list of these incidents. Click any incident in the list to display the Incident Details tab.
For more information, see the Incident Details Tab.
Radio Details button—Click to display the Radio Details tab.
This button does not apply for pooled Nextel or EF Johnson radios if Cisco IPICS is using an RMS.
For more information about the Radio Details tab, see the appropriate section for the radio type:
•
•
Patch icon—Appears if this radio is patched to one or more other resources.
For more information, see the "All Talk and Patch Controls Area" section.
Resource handle—Use to drag and drop the radio to another location in the Region tab.
For more information, see the "Region Tab" section
Select check box—Appears only if Advanced IDC Permissions are configured for you in the Cisco IPICS Administration Console. Check to include this radio when you use the PTT, Patch, DTMF, or alert tones features. For information about these features, see the "All Talk and Patch Controls Area" section.
Transmit indicator—Turns red when you transmit audio on the radio.
Incoming traffic indicator—Turns green when the radio receives audio traffic.
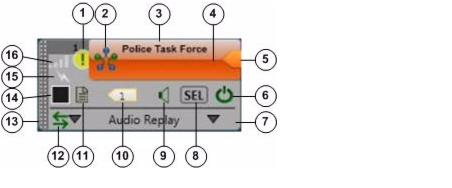
Powered-On VTGs
When you power on a VTG as described in Figure 3-3, you can access various controls and information that apply to the VTG. Figure 3-8 illustrates a powered-on VTG.
Figure 3-8 Powered-On VTG
Event Log Message icon—Indicates that the event log contains one or more messages that relates to this resource. The icon indicates the severity of the message and can appear as
(indicates a warning message),
(indicates an error message), or
(indicates an informational message). The number to the left of the icon indicates how many unread messages that relate to this resource are in the event log. Click the icon to see the event log. For related information, see the "Event Log Window" section.
VTG icon—Indicates that this resource is a VTG.
VTG name—Name that is configured for the VTG in the Cisco IPICS Administration Console. The system automatically adds the number in parentheses, and increments it by one for each new VTG.
PTT area—Click and hold anywhere in this area to talk (transmit audio) to others who are participating in this VTG. Release when you are not talking.
If this area changes to yellow when you are clicking it or when it is latched, you have engaged the PTT feature.
When you engage the PTT feature, a green bar appears at the bottom of the PTT area when the resource is ready to transmit audio. To ensure that your audio is fully transmitted, wait until the green bar completely displays before you start talking.
If this area appears gray with a red bar at the bottom when you click it, the resource cannot transmit audio. This situation can occur in a variety of cases, such as if no microphone is selected for this Cisco IPICS Dispatch Console (see the Settings Tab—Audio Connections Options).
This area displays diagonal lines if this resource is configured as listen-only or if your Cisco IPICS user account is configured as listen only.
When audio is received, this area may show the talker ID (either the Cisco IPICS user ID or the radio unit ID). Talker ID is not displayed if you are logged in using the Remote location and Cisco IPICS is using an RMS, or if your network or system cannot obtain this information.
Latch button—Appears if the latch functionality is enabled for you and this VTG as follows:
•
•
Click the Latch button to latch the PTT feature. Click it again to unlatch. When you latch the PTT feature, this button becomes green and the PTT area becomes yellow.
Power button—Click to power off a powered-on VTG.
This button can appear in the following states:
•
•
•
•
Expand audio replay controls area—Click anywhere in this area to display the audio replay controls. Click this area again to hide the audio replay controls.
For more information, see the "Audio Replay Controls for Resources" section.
Audio Selection button—Choose the device group to which audio that the VTG receives is sent. Options are SEL, U1, U2, and U3, which correspond to the device groups SELECTED, UNSELECTED1, UNSELECTED2, and UNSELECTED3, respectively.
For information about configuring device groups, see the "Settings Tab—Audio Connections Options" section.
Mute button—Click to locally mute (silence) incoming audio traffic from the VTG. The button changes to the Unmute button
.Click the Unmute button to unmute. You also can unmute by moving the volume control slider in the expanded Audio Replay Controls area.
VTG Details button—Click to display the VTG Details tab. For more information, see the "VTG Details Tab" section.
This button is available only to users with the Cisco IPICS Dispatcher role or All role.
Patch icon—Appears if this VTG is patched to one or more other resources.
For more information, see the "All Talk and Patch Controls Area" section.
Resource handle—Use to drag and drop the VTG to another location in the Region tab.
For more information, see the "Region Tab" section
Select check box—Appears only if Advanced IDC Permissions are configured for you in the Cisco IPICS Administration Console. Check to include this VTG when you use the PTT, Patch, or alert tones features. For information about these features, see the "All Talk and Patch Controls Area" section.
Transmit indicator—Turns red when you transmit audio on the VTG.
Incoming traffic indicator—Turns green when the VTG receives audio traffic.
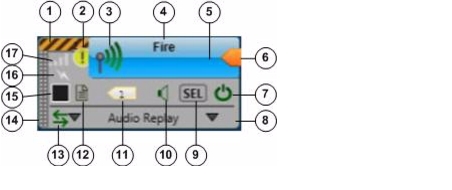
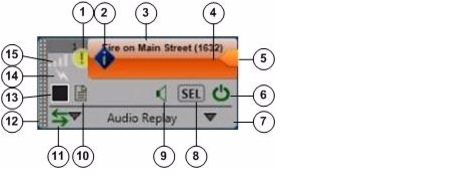
Powered-On Incidents
When you power on an incident as described in Figure 3-3, you can access various controls and information that apply to the incident. Figure 3-9 illustrates a powered-on incident.
Figure 3-9 Powered-On Incident
Event Log Message icon—Indicates that the event log contains one or more messages that relates to this resource. The icon indicates the severity of the message and can appear as
(indicates a warning message),
(indicates an error message), or
(indicates an informational message). The number to the left of the icon indicates how many unread messages that relate to this resource are in the event log. Click the icon to see the event log. For related information, see the "Event Log Window" section.
Incident icon—Indicates that this resource is an incident.
Incident name—Name that is configured for the incident in the Cisco IPICS Dispatch Console. The system automatically adds the number in parentheses, and increments it by one for each new incident.
PTT area—Click and hold anywhere in this area to talk (transmit audio) to others who are participating in this incident. Release when you are not talking.
This area displays diagonal lines if this resource is configured as listen-only or if your Cisco IPICS user account is configured as listen only.
When audio is received, this area may show the talker ID (either the Cisco IPICS user ID or the radio unit ID). Talker ID is not displayed if you are logged in using the Remote location and Cisco IPICS is using an RMS, or if your network or system cannot obtain this information.
Latch button—Appears if the latch functionality is enabled for you and this incident as follows:
•
•
Click the Latch button to latch the PTT feature. Click it again to unlatch. When you latch the PTT feature, this button becomes green and the PTT area becomes yellow.
Power button—Click to power off a powered-on incident.
This button can appear in the following states:
•
•
•
•
Expand audio replay controls area—Click anywhere in this area to display the audio replay controls. Click this area again to hide the audio replay controls.
For more information, see the "Audio Replay Controls for Resources" section.
Audio Selection button—Choose the device group to which audio that the incident receives is sent. Options are SEL, U1, U2, and U3, which correspond to the device groups SELECTED, UNSELECTED1, UNSELECTED2, and UNSELECTED3, respectively.
For information about configuring device groups, see the "Settings Tab—Audio Connections Options" section.
Mute button—Click to locally mute (silence) incoming audio traffic from the incident. The button changes to the Unmute button
. Click the Unmute button to unmute. You also can unmute by moving the volume control slider in the expanded Audio Replay Controls area.
Incident Details button—Click to display the Incident Details tab. For more information, see the "Incident Details Tab" section.
Patch icon—Appears if this incident is patched to one or more other resources.
For more information, see the "All Talk and Patch Controls Area" section.
Resource handle—Use to drag and drop the incident to another location in the Region tab.
For more information, see the "Region Tab" section
Select check box—Appears only if Advanced IDC Permissions are configured for you in the Cisco IPICS Administration Console. Check to include this incident when you use the PTT, Patch, or alert tones features. For information about these features, see the "All Talk and Patch Controls Area" section.
Transmit indicator—Turns red when you transmit audio on the incident.
Incoming traffic indicator—Turns green when the incident receives audio traffic.
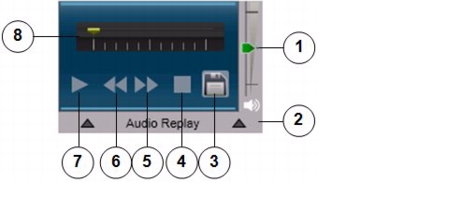
Audio Replay Controls for Resources
This section explains the features that you can access after you click anywhere in the in the expand audio replay controls area
for a resource in the Region tab. These features include a volume control for the resource and replay controls.
The Cisco IPICS Dispatch Console maintains a recording of the most recent 60 seconds of incoming and outgoing audio transmissions for each powered on resource. The audio replay controls let you review and save these recent transmissions. When you use these controls to start audio playback, the system creates a temporary "snapshot" of the most recent audio transmissions (up to 60 seconds). You can listen to any or all of the content of this audio snapshot, repeat all or part of it as needed, and save it as a .wav file for future reference.
If an audio stream contains a period of silence (no audio traffic) that lasts 5 seconds or longer, the system omits this period from the 60-second audio recording. When you play back audio from which a period of silence has been omitted, a beep tone sounds at the point of the omission.
Figure 3-10 illustrates the expanded audio controls. These controls appear when you click the expand audio replay controls area for any resource. (They also appear if you click the Audio Received time stamp for a resource in the Regions list.)
Figure 3-10 Audio Replay Controls
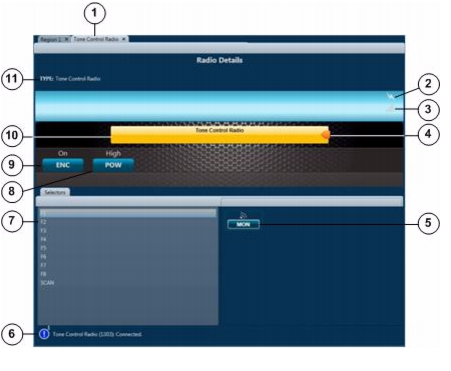
Radio Details for Tone Control Radios Tab
The Radio Details for Tone Control Radios tab provides features for managing a tone control radio. It appears when you click the Radio Details button
for a powered-on tone control radio in the View area.
Figure 3-11 illustrates the Radio Details for Tone Control Radios tab. Most settings that you make in this tab in your Cisco IPICS Dispatch Console also affect other Cisco IPICS Dispatch Consoles.
Figure 3-11 Radio Details for Tone Control Radios Tab
Tab name—Shows the name of the radio as it is configured in the Cisco IPICS Administration console.
Click the X to exit the tab.
Transmit indicator—Turns red when you transmit audio on the radio.
Incoming traffic indicator—Turns green when the radio receives audio traffic.
Latch button—Appears if the latch functionality is enabled for you and this radio as follows:
•
•
Click the Latch button to latch the PTT feature. Click it again to unlatch. When you latch the PTT feature, this button becomes green and the PTT area becomes yellow.
Monitor button—Click to enable monitoring, which bypasses the squelch feature of the radio and lets you hear all audio that the channel receives. Click the button again to stop monitoring.
This button appears only if this functionality is configured in the descriptor file for this radio, the Temporarily Monitor Frequencies control is enabled for the radio in the Cisco IPICS Administration Console, and this control is associated with your Cisco IPICS user account.
Event log message area—Displays log messages that are related to this radio. The icon indicates the severity of the message and can appear as
(indicates a warning message),
(indicates an error message), or
(indicates an informational message). The number to the right of the icon indicates how many unread messages that relate to this resource are in the event log. Click the icon or message to see the event log. For related information, see the "Event Log Window" section.
List of channels that are configured for the radio. Click a channel in this list to change the radio to that channel.
Choosing the channel named "SCAN" causes the radio to scan all of the channels that it has configured. When the radio locates a channel that is transmitting, it will either stop scanning or briefly stay on that channel then continue scanning. The action that it takes depends on the radio.
Power button—Click as needed to choose the transmit power level for the radio. Options are low, med, and high, or low and high, depending on the radio. These options specify low power, medium power, and high power.
This button appears only if this functionality is configured in the descriptor file for this radio, the High/Medium/Low Transmit Power control is enabled for the radio in the Cisco IPICS Administration Console, and this control is associated with your Cisco IPICS user account.
Encryption button—Click as needed to enable or disable the built-in over the air (OTA) encryption of a radio. Options are On and Off. When this option is set to On, audio that the radio transmits is encrypted by using a key in the radio.
This button appears only if this functionality is configured in the descriptor file for this radio, the Enable/Disable OTA Encryption control is enabled for the radio in the Cisco IPICS Administration Console, and this control is associated with your Cisco IPICS user account.
PTT button—Click and hold to talk (transmit audio) to others who are using this radio. Release when you are not talking.
This button changes to yellow when you are clicking it or when it is latched, which indicates that you have engaged the push to talk (PTT) feature. This button appears with diagonal lines if this radio is configured as listen-only or if your Cisco IPICS user account is configured as listen only.
This button shows the name of the radio as it is configured in the Cisco IPICS Administration Console.
Indicates that this device is a tone control radio.
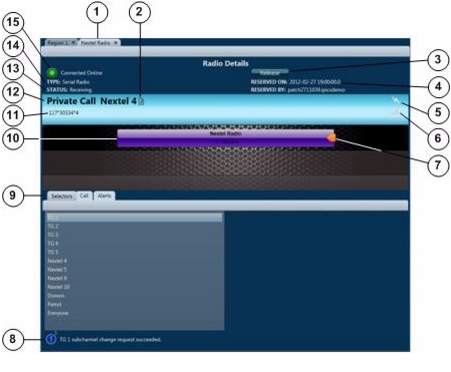
Radio Details for Nextel Radios Tab
The Radio Details for Nextel Radios tab provides features for managing a serial control Nextel radio.
The tab appears when you click the Radio Details button
for a powered-on Nextel radio in the View area, unless your Cisco IPICS Dispatch Console is communicating via an RMS component and you either specify the Remote location when you log in to the Cisco IPICS Dispatch Console or the radio for which you are viewing the Radio Details for Nextel Radios tab is in a location other than the location that you logged in to. In either of these situations, the Serial Radio Control Interface (SRCI) appears when you click the Radio Details button. The SRCI provides access to controls, selectors, and IPICS Connect functionality for the radio. For detailed information about the SRCI, see the "Managing Radios and Radio Descriptors" chapter in Cisco IPICS Administration Server Guide.
Figure 3-12 illustrates the Radio Details for Nextel Radios tab.
Most settings that you make on this tab in your Cisco IPICS Dispatch Console also affect other Cisco IPICS Dispatch Consoles. In addition settings affect the Serial Radio Control Interface (SRCI), which is described in detail in Cisco IPICS Server Administration Guide.
Figure 3-12 Radio Details for Nextel Radios Tab
Tab name—Shows the name of the radio as it is configured in the Cisco IPICS Administration Console.
Click the X to exit the tab.
When you place a group call on this radio, click this icon to see a list of the participants in the group call.
Reserve/Release toggle button—Click the Reserve button to indicate to other users that you would like to use this radio. When you click this button, your Cisco IPICS user name and full name appear in the Reserved By field and the date and time that you clicked it appear in the Reserved On field. In addition, the name of the button changes to Release. In this case, other Cisco IPICS Dispatch Console and SRCI users see the Release button and they see your information in the Reserved By and Reserved On fields.
This function is provided as a courtesy only and does not block any user from controlling the radio. Any Cisco IPICS Dispatch Console or SRCI user can click the Release button, which clears the Reserved By and Reserved On information and changes the button name to Reserve.
Reserved information—Provides the following information, if the radio has been reserved:
•
•
For related information, see row 3 in this table.
Transmit indicator—Turns red when you transmit audio on the radio.
Incoming traffic indicator—Turns green when the radio receives audio traffic.
Latch button—Appears if the latch functionality is enabled for you and this radio as follows:
•
•
Click the Latch button to latch the PTT feature. Click it again to unlatch. When you latch the PTT feature, this button becomes green and the PTT area becomes yellow.
Event log message area—Displays log messages that are related to this radio. The icon indicates the severity of the message and can appear as
(indicates a warning message),
(indicates an error message), or
(indicates an informational message). The number to the right of the icon indicates how many unread messages that relate to this resource are in the event log. Click the icon or message to see the event log. For related information, see the "Event Log Window" section.
Subtabs. See the following sections for detailed information:
•
•
PTT button—Click and hold to talk (transmit audio) to others who are using this radio. Release when you are not talking.
If this button changes to yellow when you are clicking it or when it is latched, you have engaged the push to talk (PTT) feature. This button appears with diagonal lines if this radio is configured as listen-only or if your Cisco IPICS user account is configured as listen only.
This button shows the name of the radio as it is configured in the Cisco IPICS Administration Console. In addition, when audio is received, this area may show the talker ID (either the Cisco IPICS user ID or the radio unit ID). Talker ID is not displayed if you are logged in using the Remote location and Cisco IPICS is using an RMS, or if your network or system cannot obtain this information.
Talker ID of the radio or Cisco IPICS Dispatch Console that your are using this radio to communicate with:
•
•
Talker ID is not displayed if you are logged in using the Remote location and Cisco IPICS is using an RMS, or if your network or system cannot obtain this information.
Channel selector, group name, or private call ID that this radio is communicating with.
Current status of the radio. The status can include "Idle," "Receiving," "Transmitting," "Unknown," and various system messages.
Indicates that this device is a serial control radio.
Status indicator—Icon and text that indicate status information about the radio. Icons can appear as follows:
•
•
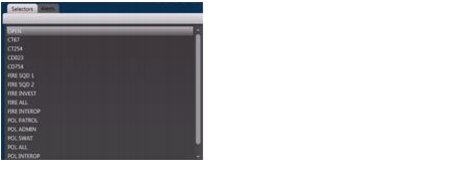
Radio Details for Nextel Radios Tab: Selectors Subtab
The Selectors subtab in the Radio Details for Nextel Radios tab displays the radio channels and talk groups that are available for the radio. Click an item in this list to communicate with it from this radio.
Figure 3-13 illustrates the Selectors subtab in the Radio Details for Nextel Radios tab.
Figure 3-13 Selectors Subtab in Radio Details for Nextel Radios Tab
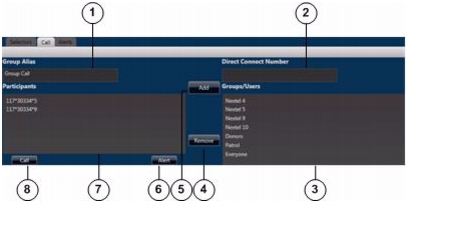
Radio Details for Nextel Radios Tab: Call Subtab
The Call subtab in the Radio Details for Nextel Radios tab allows you to make ad-hoc private and group radio calls, including calls to users from different predefined groups. You can also send a call alert (page) to a radio user.
Figure 3-14 illustrates the IPICS Connect tab.
Figure 3-14 Call Subtab in Radio Details for Nextel Radios Tab
Using the Call Tab
To place a call from the Call tab to a direct connect number or to a single user, follow these steps:
Procedure
Step 1
•
•
Step 2
To place a group call from the Call tab, follow these steps:
Procedure
Step 1
Step 2
•
•
Repeat this step as needed to specify up to 20 items in the Participants list.
Step 3
To send an alert (page) from the Call tab, follow these steps:
Procedure
Step 1
•
•
Step 2
You can send an alert to only one participant at a time.
Radio Details for Nextel Radios Tab: Alerts Subtab
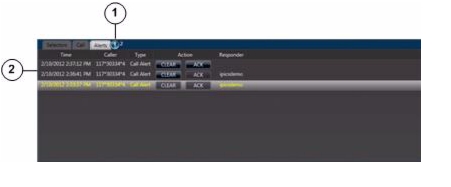
The Alerts subtab in the Radio Details for Nextel Radios tab shows current call alerts from the radio.
Figure 3-15 illustrates the Alerts subtab in the Radio Details for Nextel Radios tab.
Figure 3-15 Alerts Subtab in Radio Details for Nextel Radios Tab
Radio Details for EF Johnson Radios Tab
The Radio Details for EF Johnson Radios tab provides features for managing a serial control EF Johnson radio. It appears when you click the Radio Details button
for a powered-on EF Johnson radio in the View area.
Figure 3-16 illustrates the Radio Details for EF Johnson Radios tab.
Most settings that you make on this tab in your Cisco IPICS Dispatch Console also affect other Cisco IPICS Dispatch Consoles. In addition settings affect the Serial Radio Control Interface (SRCI), which is described in detail in Cisco IPICS Server Administration Guide.
The tab appears when you click the Radio Details button
for a powered-on EF Johnson radio in the View area, unless your Cisco IPICS Dispatch Console is communicating via an RMS component and you either specify the Remote location when you log in to the Cisco IPICS Dispatch Console or the radio for which you are viewing the Radio Details for EF Johnson Radios tab is in a location other than the location that you logged in to. In either of these situations, the Serial Radio Control Interface (SRCI) appears when you click the Radio Details button. The SRCI provides access to controls, selectors, and IPICS Connect functionality for the radio. For detailed information about the SRCI, see the "Managing Radios and Radio Descriptors" chapter in Cisco IPICS Server Administration Guide.
Figure 3-16 Radio Details for EF Johnson Radios Tab
Tab name—shows the name of the radio as it is configured in the Cisco IPICS Administration Console.
Click the X to exit the tab.
Reserve/Release toggle button—Click the Reserve button to indicate to other users that you would like to use this radio. When you click this button, your Cisco IPICS user name and full name appear in the Reserved By field and the date and time that you clicked it appear in the Reserved On field. In addition, the name of the button changes to Release. In this case, other Cisco IPICS Dispatch Console and SRCI users see the Release button and they see your information in the Reserved By and Reserved On fields.
This function is provided as a courtesy only and does not block any user from controlling the radio. Any Cisco IPICS Dispatch Console or SRCI user can click the Release button, which clears the Reserved By and Reserved On information and changes the button name to Reserve.
Reserved information—Provides the following information, if the radio has been reserved:
•
•
For more information, see row 3 in this table.
Transmit indicator—Turns red when you transmit audio on the radio.
Incoming traffic indicator—Turns green when the radio receives audio traffic.
Latch button—Appears if the latch functionality is enabled for you and this radio as follows:
•
•
Click the Latch button to latch the PTT feature. Click it again to unlatch. When you latch the PTT feature, this button becomes green and the PTT area becomes yellow.
Event log message area—Displays log messages that are related to this radio. The icon indicates the severity of the message and can appear as
(indicates a warning message),
(indicates an error message), or
(indicates an informational message). The number to the right of the icon indicates how many unread messages that relate to this resource are in the event log. Click the icon or message to see the event log. For related information, see the "Event Log Window" section.
Emergency button—Click as needed to enable or disable emergency mode for the radio. When you put a radio in emergency mode, it signals all other radios that are tuned to the same channel that it is in this mode. Then, the transmissions from this the selected channel on the radio receive higher priority than transmissions from other radios.
Options are ON and OFF, which indicate radio emergency mode on and off, respectively.
This button also can display UNKWN, which indicates that the RCS cannot determine an emergency state, and UNSPRT, which indicates that a state is not currently supported or is never supported by the radio.
This button appears only if this functionality is configured in the descriptor file for this radio, the Enable/Disable Emergency Mode control is enabled for the radio in the Cisco IPICS Administration Console, and this control is associated with your Cisco IPICS user account.
Power button—Click as needed to choose the transmit power level for the radio. Options are low, med, and high, or low and high, depending on the radio. These options specify low power, medium power, and high power.
This button also can display UNKWN, which indicates that the RCS cannot determine a power state, and UNSPRT, which indicates that a state is not currently supported or is never supported by the radio.
This button appears only if the power mode functionality is configured in the descriptor file for this radio, the Change the Transmit Power Level control is enabled for the radio in the Cisco IPICS Administration Console, and this control is associated with your Cisco IPICS user account.
Transmit Mode button—Click as needed to set the radio to either secure or clear transmit mode. Options are SEC and CLR, which indicate secure mode and clear mode, respectively.
This button also can display UNKWN, which indicates that the RCS cannot determine a transmit state; UNSPRT, which indicates that a state is not currently supported or is never supported by the radio; KEYFL, which indicates that a key required for encryption is not available; NOENC, which indicates that no encryption module is available; and MSMTCH, which indicates a mismatch between the user selected secure transmit mode and actual fixed or strapped transmit mode.
This button appears only if the transmit mode functionality is configured in the descriptor file for this radio, the Select Between Secure and Clear Transmit mode control is enabled for the radio in the Cisco IPICS Administration Console, and this control is associated with your Cisco IPICS user account.
Scan button—Click as needed to enable or disable scan mode. In scan mode, the radio scans all of the channels that it has configured. When the radio locates a channel that is transmitting, it will either stop scanning or briefly stay on that channel then continue scanning.
Options are ON and OFF, which indicate scan mode on and off, respectively.
This button also can display UNKWN, which indicates that the RCS cannot determine a scan state, and UNSPRT, which indicates that a state is not currently supported or is never supported by the radio.
This button appears only if the scan functionality is configured in the descriptor file for this radio, the Set Scan Mode control is enabled for the radio in the Cisco IPICS Administration Console, and this control is associated with your Cisco IPICS user account.
RTA button—Click as needed to set the radio to either repeater or talkaround transmit mode. Options are RPTR and TA, which indicate repeater mode and talkaround mode, respectively.
This button also can display UNKWN, which indicates that the RCS cannot determine a monitor state, and UNSPRT, which indicates that a state is not currently supported or is never supported by the radio.
This button appears only if the RTA functionality is configured in the descriptor file for this radio, the Select Between Repeater and Talkaround Transmit Mode control is enabled for the radio in the Cisco IPICS Administration Console, and this control is associated with your Cisco IPICS user account.
Monitor button—Click as needed to enable or disable monitoring. Monitoring bypasses the squelch feature of the radio so that you hear all audio that the radio receives on the selected channel. Options are ON and OFF, which indicate monitoring on and off, respectively.
This button also can display UNKWN, which indicates that the RCS cannot determine a monitor state, and UNSPRT, which indicates that a state is not currently supported or is never supported by the radio.
This button appears only if the monitor functionality is configured in the descriptor file for this radio, the Set Monitor Mode control is enabled for the radio in the Cisco IPICS Administration Console, and this control is associated with your Cisco IPICS user account.
Subtabs. See the following sections for detailed information:
•
PTT button—Click and hold to talk (transmit audio) to others who are using this radio. Release when you are not talking.
If this button changes to yellow when you are clicking it or when it is latched, you have engaged the push to talk (PTT) feature. This button appears with diagonal lines if this radio is configured as listen-only or if your Cisco IPICS user account is configured as listen only.
If you click the PTT button when the SCAN function is enabled (see row 12 in this table), scanning stops on the current channel and you can transmit audio on that channel. When you release the PTT button, the radio either resumes scanning, or remains on the current channel, depending on the radio.
This button shows the name of the radio as it is configured in the Cisco IPICS Administration Console. In addition, when audio is received, this area may show the talker ID (either the Cisco IPICS user ID or the radio unit ID).
Talker ID of the radio or Cisco IPICS Dispatch Console that your are using this radio to communicate with:
•
•
Talker ID is not displayed if you are logged in using the Remote location and Cisco IPICS is using an RMS, or if your network or system cannot obtain this information.
Channel selector you have chosen for this radio.
Current status of the radio. The status can include "Idle," "Receiving," "Transmitting," "Unknown," and various system messages.
Indicates that this device is a serial control radio.
Status indicator—Icon and text that indicate status information about the radio. Icons can appear as follows:
•
•
Radio Details for EF Johnson Radios Tab: Selectors Subtab
The Selectors subtab in the Radio Details for EF Johnson Radios tab displays the radio channels and talk groups that are available for the radio. Click an item in this list to communicate with it from this radio.
Figure 3-17 illustrates the Selectors subtab in the Radio Details for EF Johnson Radios tab.
Figure 3-17 Selectors Subtab in Radio Details for EF Johnson Radios Tab
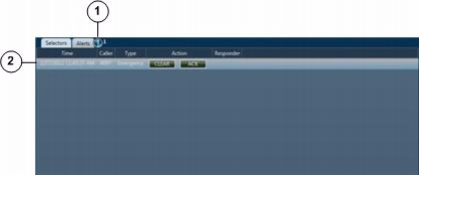
Radio Details for EF Johnson Radios Tab: Alerts Subtab
The Alerts subtab in the Radio Details for EF Johnson Radios tab shows current emergency alerts from the radio.
Figure 3-18 illustrates the Alerts subtab in the Radio Details for EF Johnson Radios tab.
Figure 3-18 Alerts Subtab in Radio Details for EF Johnson Radios Tab
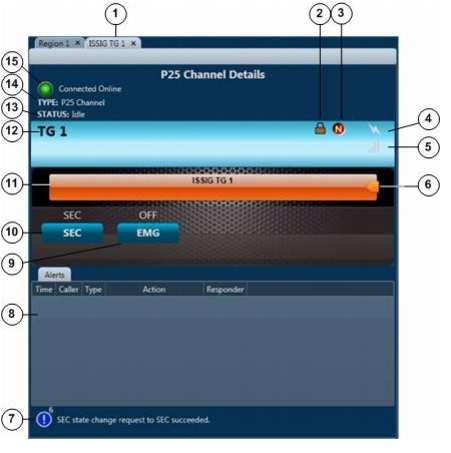
Channel Details for P25 Channels Tab
The Channel Details for P25 Channels tab provides features for managing a P25 channel. It appears when you click the Channel Details button
for a powered-on P25 channel radio in the View area.
Figure 3-19 illustrates the Channel Details for P25 Channels tab.
Most settings that you make on this tab in your Cisco IPICS Dispatch Console also affect other Cisco IPICS Dispatch Consoles.
Figure 3-19 Channel Details for P25 Channels Tab
Tab name—shows the name of the channel as it is configured in the Cisco IPICS Administration Console.
Click the X to exit the tab.
Lock icon—Indicates that the P25 channel is encrypted.
You enable and disable encryption for the channel as described in row 10 in this table.
Mode indicator—Applies only to P25 channels that are in EndtoEnd P25 mode, and indicates that the channel is in this mode.
Transmit indicator—Turns red when you transmit audio on the channel.
Incoming traffic indicator—Turns green when the channel receives audio traffic.
Latch button—Appears if the latch functionality is enabled for you and this channel as follows:
•
•
Click the Latch button to latch the PTT feature. Click it again to unlatch. When you latch the PTT feature, this button becomes green and the PTT area becomes yellow.
Event log message area—Displays log messages that are related to this channel. The icon indicates the severity of the message and can appear as
(indicates a warning message),
(indicates an error message), or
(indicates an informational message). The number to the right of the icon indicates how many unread messages that relate to this resource are in the event log. Click the icon or message to see the event log. For related information, see the "Event Log Window" section.
Alerts area—Displays current alerts for the channel. For each alert, this area includes this information and options:
•
•
•
•
–
–
•
You can resize any column by dragging a border next to its name.
Emergency button—Click as needed to enable or disable emergency mode for the channel. When you put a channel in emergency mode, it signals all other radios that are affiliated with this channel that it is in this mode when you PTT on this channel.
Options are ON and OFF, which indicate emergency mode on and off, respectively.
This button also can display UNKWN, which indicates that the RCS cannot determine an emergency state, and UNSPRT, which indicates that a state is not currently supported or is never supported by the channel.
This button appears only if this functionality is configured in the Cisco ISSI Gateway descriptor file for this channel and this control is associated with your Cisco IPICS user account.
Transmit Mode button—(This button does not appear for a strapped channel.) Click as needed to set the channel to either secure (encrypted) or clear transmit mode. Options are SEC and CLR, which indicate secure mode and clear mode, respectively.
This button also can display UNKWN, which indicates that the RCS cannot determine a transmit state; UNSPRT, which indicates that a state is not currently supported or is never supported by the channel; KEYFL, which indicates that a key required for encryption is not available; NOENC, which indicates that no encryption module is available; and MSMTCH, which indicates a mismatch between the user selected secure transmit mode and actual transmit mode.
This button appears only if the transmit mode functionality is configured in the Cisco ISSI Gateway descriptor file for this channel and this control is associated with your Cisco IPICS user account.
PTT button—Click and hold to talk (transmit audio) to others who are using this channel. Release when you are not talking.
If this button changes to yellow when you are clicking it or when it is latched, you have engaged the push to talk (PTT) feature. If it flashes when you click it, you do not have the floor. This button appears with diagonal lines if this channel is configured as listen-only or if your Cisco IPICS user account is configured as listen only.
This button shows the name of the channel as it is configured in the Cisco IPICS Administration Console. In addition, when audio is received, this area may show the talker ID (either the P25 subscriber ID of the IPICS user you are communicating or the radio ID of the device you are communicating with). Talker ID is not displayed if you are logged in using the Remote location and Cisco IPICS is using an RMS, or if your network or system cannot obtain this information.
Name of the selector to which this channel is assigned in the Cisco IPICS Administration Console.
Current status of the channel. Applies only to Applies only to P25 channels that are in EndtoEnd P25 mode. The status can include "Idle," "Receiving," "Transmitting," "Unknown," and various system messages.
Indicates that this device is a P25 channel.
Status indicator—Applies only to Applies only to P25 channels that are in EndtoEnd P25 mode. The icon and text that indicate status information about the channel. Icons can appear as follows:
•
•
VTG Details Tab
The VTG Details tab provides features that allow you to manage VTGs. It is available only for users with the Cisco IPICS Dispatcher role or All roles.
This tab appears when you take any of these actions:
•
for a powered-on VTG in the View area.
•
•
Figure 3-20 illustrates the VTG Details tab. The VTG name that appears on the tab is configured in the Cisco IPICS Administration Console or Cisco IPICS Dispatch Console.
Figure 3-20 VTG Details Tab
Tab name—shows the name of the VTG as it is configured in the Cisco IPICS Administration Console.
Click the X to exit the tab.
Close button—Click to exit the VTG Details tab.
Notify button—Click to initiate the notification action that is configured for the VTG in the Cisco IPICS Administration Console. The notification action affects the users that you choose in the Resource List (see row 12 in this table). A pop-up window confirms the action. Click OK to exit the pop-up window.
Deactivate button (available only when a VTG is activated)—Click to deactivate a VTG. When a VTG is deactivated, this button appears as Activate. Click the Activate button to activate the VTG.
When you activate a VTG, Cisco IPICS commits global resources, such as a multicast address and any necessary dial-in peers, so that the participants in the VTG can communicate with each other.
Save button—Click to save changes that you make in the Title or Description fields, or to the Allow Latch, Listen Only, Enable VAD, or RX Mute during PTT settings.
Dial button—Click to initiate the dial-out action that is configured for the VTG in the Cisco IPICS Administration Console. The dial-out action affects the users that you choose in the Resource List (see row 12 in this table). A pop-up window confirms the action. Click OK to exit the pop-up window.
Event log message area—Displays log messages that are related to this resource. The icon indicates the severity of the message. Click the icon or message to see the event log. For related information, see the "Event Log Window" section.
RX Mute during PTT drop-down list—Provides the following options for muting incoming traffic when you user the PTT button for this VTG:
•
•
•
Allow Latch selector—Use to enable or disable latch functionality for the VTG.
Allow Latch is disabled by default. An X
indicates that Allow Latch is enabled.
Listen Only selector—Use to control whether users can use the PTT button for this VTG. When option is selected, users cannot use the PTT button for this VTG so then can hear, but not transmit, audio.
Listen Only is disabled by default. An X
indicates that Listen Only is enabled.
Enable VAD selector—Use to enable or disable Voice Activity Detection (VAD) for the VTG. VAD can be useful when a user latches a resource and that resource sends unintended audio.
VAD is disabled by default. An X
indicates that VAD is enabled.
VTG Resources list—By default, displays a list of all resources in the VTG. You can display resources only of a specified type in this list by using the Filter buttons, as described in row 13 of this table.
The VTG Resources list includes the following columns. You can resize any column by dragging a border next to its name.
•
–
—Channel
–
—Cisco IPICS user
–
—VTG
–
—Radio
To select a a resource as the target of a dial-out or notification action, check its check box. Click a resource again to deselect it. To select or deselect all resources, click the check box at the top of this column.
•
•
–
—For a user, indicates that the user is enabled in the Cisco IPICS Administration Console. For other resource types, indicates that system resources have been allocated to allow them to participate in audio communications.
–
—Indicates that a resource is activating.
–
—For a user, indicates that the user is disabled in the Cisco IPICS Administration Console. For other resource types, indicates that system resources have not been allocated to allow them to participate in audio communications.
–
—Indicates that a channel or radio is disabled in the Cisco IPICS Administration Console. In this case the Cisco IPICS Dispatch Console cannot connect to the resource.
–
—Appears if the resource experiences an error.
Filter buttons for the VTG Resources list:
•
—Click to display all resources in the VTG
•
—Click to display channels only
•
—Click to display Cisco IPICS users only
•
—Click to display VTGs only
•
—Click to display radios only
When you filter the VTG Resources list, the following buttons appear:
•
—To remove one or more resources from the VTG, select each resource by checking its check box in the VTG Resources list, then click the Remove button.
•
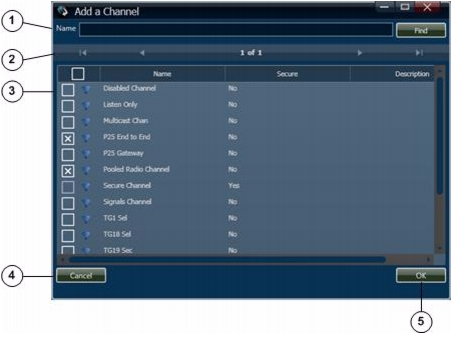
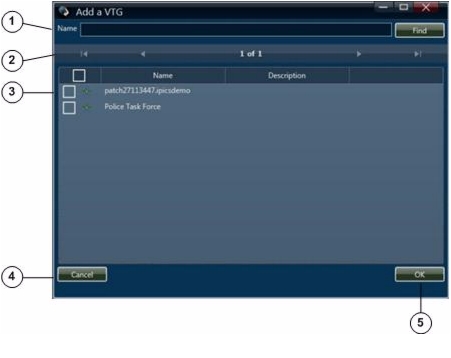
—To add a resource of the type that you are viewing to the VTG, click the Add button, then enter information in the pop-up window. For detailed instructions, see the "Adding a Resource to an Incident or VTG" section.
Note
Description field—Displays a description of the VTG, To change the description, edit this field, then click the Save button.
Title field—Displays the name of the VTG, To change the name, edit this field, then click the Save button. A VTG name include up to 40 characters.
VTG state indicator. This examples shows an activated VTG. The VTG state indicator for an inactive VTG appears as
.
Incident Details Tab
The Incident Details tab provides features for monitoring and managing incidents. It appears when you take any of these actions:
•
for a powered-on incident in the View area
•
•
•
for a powered-on channel, radio, or VTG, then double-click an incident in the incident list that appears
The Incident Details tab also lets you activate an incident VTG, which enables the participants in an incident to communicate with each other. An incident VTG is a convenient way to quickly establish communication between incident participants. It is not a standard Cisco IPICS VTG and does not appear as a VTG in the Items Tabs area or in the Cisco IPICS Administration Console.
Note
•
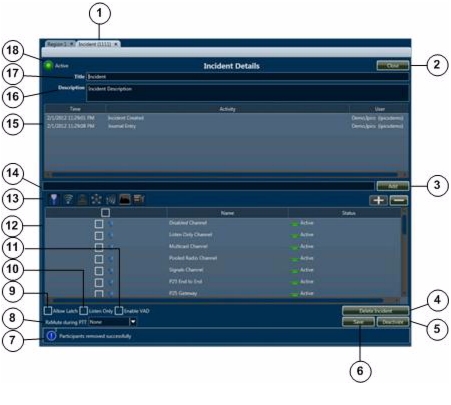
Figure 3-21 illustrates the Incident Details tab. The incident name that appears on the tab is the name that is in the Cisco IPICS Dispatch Console.
Figure 3-21 Incident Details Tab
Tab name—Shows the name of the incident and its unique, system-assigned numeric identifier.
Click the X to exit the tab.
Close button—Click to exit the Incident Details tab.
Add button—Click to add the text that you enter in the Journal Entry field (which appears to the left of this button) to the incident.
Delete Incident button—Deactivates the incident and removes it from the Cisco IPICS Dispatch Console.
Note
Deactivate button (available only when an incident VTG is activated)—Click to deactivate an incident VTG. When an incident VTG is deactivated, this button appears as Activate. Click the Activate button to activate the incident VTG.
Participants in an incident cannot communicate with each other unless its incident VTG is activated. For more information, see the "Understanding Incidents" section.
Save button—Click to saves changes that you make in Title or Description fields, or to the Allow Latch, Listen Only, Enable VAD, or RX Mute during PTT settings.
Event log message area—Displays log messages that are related to this resource. The icon indicates the severity of the message. Click the icon or message to see the event log. For related information, see the "Event Log Window" section.
RX Mute during PTT drop-down list—Provides the following options for muting incoming traffic when you use the PTT button for this incident VTG:
•
•
•
Allow Latch selector—Use to enable or disable latch functionality for the incident VTG.
Allow Latch is disabled by default. An X
indicates that Allow Latch is enabled.
Listen Only selector—Use to control whether users can use the PTT button for this incident VTG. When option is selected, users cannot use the PTT button for this incident VTG so then can hear, but not transmit, audio.
Listen Only is disabled by default. An X
indicates that Listen Only is enabled.
Enable VAD selector—Use to enable or disable Voice Activity Detection (VAD) for the incident VTG. VAD can be useful when a user latches a resource and that resource sends unintended audio.
VAD is disabled by default. An X
indicates that VAD is enabled.
Incident Resources list—By default, displays a list of all resources in the incident. You can display resources only of a specified type in this list by using the Filter buttons, as described in row 13 of this table.
This list includes the following columns. You can resize any column by dragging a border next to its name.
•
–
—Channel
–
—Cisco IPICS user
–
—VTG
–
—Radio
–
—Image
–
— Video
To select a a resource as the target of a dial-out or notification action, check its check box. Click a check box again to deselect it. To select or deselect all resources, click the check box at the top of this column.
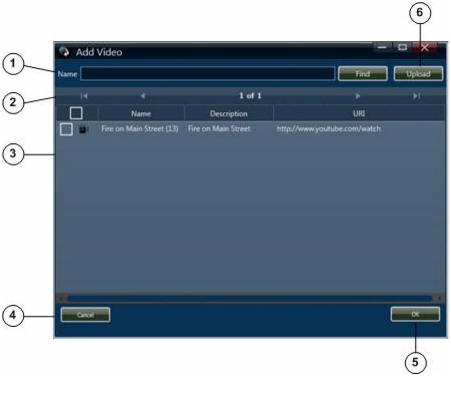
To view an image or video, double-click its name or icon. For more information, see the "Viewing an Image or Video in an Incident" section.
•
(continued)
•
–
—For a user, indicates that the user is enabled in the Cisco IPICS Administration Console. For other resource types, indicates that system resources have been allocated to allow them to participate in audio communications.
–
—Indicates that a resource is activating.
–
—For a user, indicates that the user is disabled in the Cisco IPICS Administration Console. For other resource types, indicates that system resources have not been allocated to allow them to participate in audio communications.
–
—Indicates that a channel or radio is disabled in the Cisco IPICS Administration Console. In this case the Cisco IPICS Dispatch Console cannot connect to the resource.
–
—Appears if the resource experiences an error.
Filter buttons for the Incident Resources list:
•
—Click to display all resources in the VTG
•
—Click to display channels only
•
—Click to display Cisco IPICS users only
•
—Click to display VTGs only
•
—Click to display radios only
•
—Click to display images only
•
—Click to display videos only
When you filter the Incident Resources list, the following buttons appear:
•
—To remove one or more resources from the incident, select each resource by checking its check box in the Incident Resources list, then click the Remove button.
•
—To add a resource of the type that you are viewing to the incident, click the Add button, then enter information in the pop-up window. For detailed instructions, see the "Adding a Resource to an Incident or VTG" section.
Note
Journal Entry field—Make a journal entry for the incident. A journal entry is a brief message that other users in this incident can see. To add the journal entry to the incident, click the Add button to the right of this field
Journal list—Displays the journal entries that users have added to this incident. Each journal entry includes this information:
•
•
•
Description field—Displays a description of the incident, To change the description, edit this field, then click the Save button.
Title field—Displays the name of the incident. To change the name, edit this field, then click the Save button. The name can include up to 40 characters.
Incident VTG state indicator—This example shows an activated incident VTG. The incident state indicator for an inactive incident VTG appears as
.
Participants in an incident cannot communicate with each other unless its incident VTG is activated. For more information, see the "Understanding Incidents" section.
Policy Execution Status Tab
The Policy Execution Status tab displays information about policies that have executed during your current Cisco IPICS Dispatch Console session.
A user with the Cisco IPICS Dispatcher role or All role can see information about all policies. Other users can see information only about policies with which they are associated.
By default, the Policy Execution Status tab displays a collapsed view of each policy, which shows the policy name and its status ("SUCCESSFUL" if it executed successfully or "FAILED" if it did not) and the date and time that the policy executed. You can expand any policy to see also the actions that it performed status of each action.
To display the Policy Execution Status tab, choose View > Policy Execution Status.
To close the tab, click the X next to the tab name.
Figure 3-22 illustrates the Policy Execution Status tab. This example shows one collapsed policy and one expanded policy.
Figure 3-22 Policy Execution Status Tab
Name of the tab.
Click the X to exit the tab.
Expand Policy button—Click to display an expanded view of a policy.
Collapse Policy button—Click to collapse an expanded view of a policy.
Settings Tab
The Settings tab provide options for configuring several Cisco IPICS Dispatch Console functions. These options include:
•
•
•
•
•
•
To display the Settings tab, choose View > Settings.
To close the tab, click the X next to the tab name.
Figure 3-23 illustrates the Settings tab. This example shows the Themes options, which appear by default when you choose this tab.
Figure 3-23 Settings Tab
Tab name.
Click the X to exit the tab.
Themes selector (shown selected)—Click to display the themes options.
For detailed information, see the "Settings Tab—Themes Options" section.
Audio Connections selector—Click to display the audio connections options.
For detailed information, see the "Settings Tab—Audio Connections Options" section.
Network Settings selector—Click to display the network settings options.
For detailed information, see the "Settings Tab—Network Settings Options" section.
Key Assignments selector—Click to display the key assignment options.
For detailed information, see the "Settings Tab—Key Assignments Options" section.
Dialer-Channel Audio selector—Click to display the dialer-channel audio options.
For detailed information, see the "Settings Tab—Dialer-Channel Audio Options" section.
Miscellaneous selector—Click to display the miscellaneous options.
For detailed information, see the "Settings Tab—Miscellaneous Options" section.
Settings Tab—Themes Options
The themes options in the Settings tab let you designate whether the Cisco IPICS Dispatch Console user interface appears in the light or dark color theme.
Figure 3-24 illustrates the themes options in the Settings tab.
Figure 3-24 Settings Tab—Themes Options
Settings Tab—Audio Connections Options
The audio connections options in the Settings tab lets you assign the audio input devices (typically headsets and speakers) on your PC to up to four groups, called SELECTED, UNSELECTED1, UNSELECTED2, and UNSELECTED3. Then, after you use the Audio Selection button for any channel, incident, radio, or VTG to choose a group, audio that that resource receives plays on each device that is assigned to the group.
For information about the Audio Selection button for a resource, see these sections:
Figure 3-25 illustrates the audio connections options in the Settings tab.
Figure 3-25 Settings Tab—Audio Connections Options
Example
Consider a Cisco IPICS Dispatch Console system that is set up as follows:
•
–
–
–
•
–
–
–
To enable audio to play in this way, you could make the following configurations in the Cisco IPICS Dispatch Console:
•
–
–
–
•
•
•
Settings Tab—Network Settings Options
The network settings options in the Settings tab lets you choose the NIC on which the Cisco IPICS Dispatch Console sends and receives audio, if your client PC has more than one NIC.
If you change the network card on this tab, the change takes effect when you restart the Cisco IPICS Dispatch Console. The change affects all users who use the Cisco IPICS Dispatch Console on this PC.
If you are using a VPN, choose the VPN device from the list. If you do not, you will not receive audio in the Cisco IPICS Dispatch Console.
Figure 3-27 illustrates the network settings options in the Settings tab.
Figure 3-26 Settings Tab—Network Settings Options
Settings Tab—Key Assignments Options
The key assignments options in the Settings tab lets you configure hot keys for any resource PTT function and for the All Talk button in your Cisco IPICS Dispatch Console. You can configure hot keys on a keyboard or on another input device such as a game controller, foot pedal, or joystick.
Hot keys that you configure in this tab work any time the Cisco IPICS Dispatch Console is running on your client PC, even if another window or application is in focus.
Before you can configure key assignment options, the Allow Complex Key Settings option must be enabled for you in the Cisco IPICS Management Console.
Figure 3-27 illustrates the key assignments options in the Settings tab.
Figure 3-27 Settings Tab—Key Assignments Options
Example
Assume that you want to configure your Cisco IPICS Dispatch Console so that pressing Left Shift + A operates the PTT function for a channel called Police, and pressing L operates the PTT function for a channel called Fire. To do so, on the Key Assignments tab, take these actions:
•
•
Now, pressing Left Shift + A is equivalent to clicking in the PTT area for the Police channel, and pressing L is equivalent to clicking in the PTT area for the fire channel.
Settings Tab—Dialer-Channel Audio Options
The dialer-channel audio options in the Settings tab lets you control the behavior of audio from a resource or from an active IDC dialer line when your are connected to a telephone call via the IDC dialer.
Figure 3-28 illustrates the dialer-channel audio options in the Settings tab.
Figure 3-28 Settings Tab—Dialer-Channel Audio Options
Separation mode radio buttons. The following options designate how the system handles audio when you are on a call via the IDC dialer. When the call disconnects, audio returns to its normal setting.
•
•
•
Volume attenuation level controls. Slide the Left and Right volume attenuation sliders up and down to designate the volume of audio from a resource or from an IDC dialer line. The system uses this volume if you choose to attenuate channel volume or dialer volume (see row 1 in this table). The slider values can be set independently or synchronized, depending on the slider lock setting.
The slider lock control appears as the padlock icon between the attenuation sliders. Click this icon to toggle the volume attenuation sliders between locked and unlocked mode. A locked icon
indicates locked mode, in which the volume attenuation sliders are synchronized and moving either slider moves the other one in the same way. An unlocked icon
indicates unlocked mode, you can move the left and right sliders independently.
If you move the sliders than click the unlocked icon to change to locked mode, the sliders synchronize to the highest value that was last saved in the current Cisco IPICS Dispatch Console session.
Set button—Click to configure left and right volume attenuation to the values that are designated by the current volume attenuation slider settings.
Reset button—Click to move the volume attenuation sliders to the settings that were last saved in the current Cisco IPICS Dispatch Console session, or to their original settings if you have not set changes in the current session.
Settings Tab—Miscellaneous Options
The dialer-channel audio options in the Settings tab lets you configure various system items.
Figure 3-29 illustrates the miscellaneous options in the Settings tab.
Figure 3-29 Settings Tab—Miscellaneous Options
Show Rx Times check box—Check this check box to include the Audio Received time stamp in the display of a powered-on resource in the Regions list. (For more information, see the "Regions List" section.)
Keep on Top check box—Check this check box to cause the Cisco IPICS Dispatch Console to always appear as the top window on a client PC. To see another window when this option is enabled, minimize the Cisco IPICS Dispatch Console.
Do not Show License Message check box—Check this check box to prevent the Warning dialog box from appearing when you log in to the Cisco IPICS Dispatch Console with Silver license privileges. (For information about the Warning dialog box, see Step 7 in the "Starting the Cisco IPICS Dispatch Console" section.
Records per Page field—Enter the maximum number of VTGs, incidents, or policies that appear on each page in the tabs in the Details List. Valid values are 1 through 25. The default value is 25.
Server Address field—(Display only) Displays the IP address of the Cisco IPICS server that the Cisco IPICS Dispatch Console is connected to, if the Cisco IPICS Dispatch Console is in on-line mode.
The icon to the right of this field appears green when the Cisco IPICS Dispatch Console is in on-line mode. It appears red when the Cisco IPICS Dispatch Console is in off-line mode.
Adding a Resource to an Incident or VTG
When you click the Add button after filtering incident resources in the Incident Details tab or VTG Details tab, a pop-up window appears. Use these pop-up windows to add resources to an incident or VTG.
The following section describe how to add resources to an incident or VTG:
Adding a Channel
Figure 3-30 illustrates the Add a Channel pop-up window, which appears when you choose to add a channel to an incident or a VTG.
Figure 3-30 Add a Channel Pop-Up Window
Adding a User
Figure 3-31 illustrates the Add a User pop-up window, which appears when you choose to add a user to an incident or a VTG.
Figure 3-31 Add a User Pop-Up Window
Adding a VTG
Figure 3-32 illustrates the Add a VTG pop-up window, which appears when you choose to add a VTG to an incident or to another VTG.
Figure 3-32 Add a VTG Pop-Up Window
Adding a Radio
Figure 3-33 illustrates the Add a Radio pop-up window, which appears when you choose to add a radio to an incident or a VTG.
Figure 3-33 Add a Radio Pop-Up Window
Adding an Image
Figure 3-34 illustrates the Add Image pop-up window, which appears when you choose to add an image to an incident. This window lets you add an image that you or another user has already uploaded to the Cisco IPICS server and that is associated with your Cisco IPICS ops view.
For information about uploading an image to the Cisco IPICS server, see the "Uploading Images" section.
For information about viewing an image, see the "Viewing an Image or Video in an Incident" section.
Figure 3-34 Add Image Pop-up Window
Locate Image area—To display specific images, enter the image name or the first few characters of the name in the Name field, then click Find. The image or images that match the information that you enter appear in the Images area.
Display control buttons—If the Images area does not have enough room to display all available images, use the following buttons to navigate through the image display pages:
•
—Click to display the first page of images
•
—Click to display the previous page of images
•
—Click to display the next page of images
•
—Click to display the last page of images
Image area—By default, displays the name, description, and URI of all images that are configured in the Cisco IPICS Administration Console and that are associated with your Cisco IPICS ops view. If you specify information and click the Find button in the Locate Images area, this list displays only images that match the find criteria. A checked check box appears next to an image that is already added to the incident.
You can resize any column by dragging a border next to its name
To add one or more images to an incident, choose each image that you want by checking its check box, then click OK. To quickly add all images that are displayed to an incident, click the Select All check box that appears at the left of the column headings row.
Cancel button—Click to exit the Add an Image pop-up window without adding an image to the incident.
OK button—Click to add the selected images to the incident.
Upload button—Click to display the Upload an Image pop-up window, which allows you to upload an image to the Cisco IPICS server. For detailed information about the upload function, see the "Uploading Images" section.
Adding Video
Figure 3-35 illustrates the Add Video pop-up window, which appears when you choose to add video to an incident. This window lets you add a video that you or another user has already uploaded to the Cisco IPICS server and that is associated with your Cisco IPICS ops view.
A video can be a file that includes a video clip, the URL of a video clip, or the URL of live streaming video.
For information about uploading a video to the Cisco IPICS server, see the "Uploading Video" section.
For information about viewing an image, see the "Viewing an Image or Video in an Incident" section.
Figure 3-35 Add Video Pop-up Window
Locate Video area—To display specific videos, enter the video name or the first few characters of the name in the Name field, then click Find. The video or videos that match the information that you enter appear in the Videos area.
Display control buttons—If the Videos area does not have enough room to display all available videos, use the following buttons to navigate through the video display pages:
•
—Click to display the first page of videos
•
—Click to display the previous page of videos
•
—Click to display the next page of videos
•
—Click to display the last page of videos
Video area—By default, displays the name, description, and URI of all videos that are configured in the Cisco IPICS Administration Console and that are associated with your Cisco IPICS ops view. If you specify information and click the Find button in the Locate Videos area, this list displays only videos that match the find criteria. A checked check box appears next to a video that is already added to the incident.
To add one or more videos to an incident, choose each video that you want by checking its check box, then click OK. To quickly add all videos that are displayed to an incident, click the Select All check box that appears at the left of the column headings row.
Cancel button—Click to exit the Add an Video pop-up window without adding a video to the incident.
OK button—Click to add the selected videos to the incident.
Upload button—Click to display the Upload a Video pop-up window, which allows you to upload a video to the Cisco IPICS server. For detailed information about the upload function, see the "Uploading Video" section.
Uploading Images
The Upload Image pop-up window appears when you choose to upload an image to the Cisco IPICS server, as described in the "Adding an Image" section. This window lets you upload either an image file or the URL of an image.
The system supports these image file types:
•
•
•
•
•
By default, an image file can be up to 4 MB in size. You can change this maximum size to a size of 1 through 2048 MB by updating the Maximum Video Size option in the Cisco IPICS Administration Console Administration > Options > Client window.
After you upload an image, it becomes available to other incident participants that have the Cisco IPICS ops view that you do.
Figure 3-36 illustrates the Upload Image pop-up window.
Figure 3-36 Upload Image Pop-Up Window
Uploading Video
The Upload Video pop-up window appears when you choose to upload a video to the Cisco IPICS server, as described in the "Adding Video" section. This window lets you upload a video clip that resides on your client PC or an accessible network PC, or the URL of a video stream.
The Cisco IPICS Dispatch Console supports these video clip file types:
•
•
•
•
•
•
•
When you upload a video clip file that is in avi or wmv format, the Cisco IPICS Dispatch Console attempts to convert it to an mp4 format file. If the content allows this conversion, the mp4 file is uploaded. Otherwise, the file is uploaded in its original format. If a conversion occurs, the Upload Video pup-up window displays the status of the conversion as it proceeds.
By default, a video clip file can be up to 4 MB in size. You can change this maximum size to a size of 1 through 2048 MB by updating the Cisco IPICS Administration Console Administration > Options > Client window. (Be aware that uploading several large video clips can affect the performance of your system.)
After you upload a video, it becomes available to other incident participants that have the Cisco IPICS ops view that you do.
Figure 3-37 illustrates the Upload Video pop-up window.
Figure 3-37 Upload Video Pop-Up Window
Title field—Enter a brief name for the video (up to 30 characters). Users see this title in the list of resources for an incident.
Description field—Enter a brief description of the video. Users see this description in the list of resources for an incident.
Browse button—Click to display a pop-up window that you can use to locate the path and file name of an video to upload.
Upload button—Click to upload the video clip or URL to the Cisco IPICS server.
In the pop-up window that confirms a successful upload, click OK.
Close button—Click to exit the Upload an Image pop-up window.
Media location field—Enter the location of the video. Use one of the following formats, based on the option that you choose from the Video Clip drop-down list (see row 8 in this table):
•
•
•
•
For information about supported video types, see Cisco IPICS Compatibility Matrix. For detailed information about URLs for VSM video, see your VSM documentation.
File drop-down list—This list is available only if you choose Video Clip from Type drop-down list. Choose File to upload a video file that resides on your client PC or an accessible network PC, or choose Link to upload the URL of a video file.
Video Clip drop-down list—Choose the type of video that you are downloading:
•
•
•
•
Obtaining a Source URL for a YouTube Video
To upload a YouTube video to the Cisco IPICS server, you must enter the source URL for the video, which is the actual path to the video. The source URL is different than the URL that appears in the Address field of your browser when you view the video from the YouTube web page.
To obtain the source URL for a YouTube video, follow these steps:
Procedure
Step 1
Step 2
Step 3
Step 4
For example, in the following data that was copied from the Embed field for a YouTube video, the src tag is highlighted in bold type:
<object width="480" height="385"><param name="movie"
value="http://www.youtube.com/v/a_movie"></param><param
name="allowFullScreen" value="true"></param><param
name="allowscriptaccess" value="always"></param><embed
src="http://www.youtube.com/v/a_movie"
type="application/x-shockwave-flash" allowscriptaccess="always"
allowfullscreen="true" width="480" height="385"></embed></object>
The source URL appears within quotes in the source tag. In this example, the source URL that should be used in Location field in the Upload a Video pop-up window is:
http://www.youtube.com/v/a_movie
Viewing an Image or Video in an Incident
To view an image or video, double-click its name or icon in the Incident Details tab. The Media Viewer pop-up window appears. Figure 3-38 illustrates this window.
This figure shows the video playback buttons that appear for video files that are in 3gp, m4v, mov, mp4, or mpg format. For video files that are in avi or wmv format, and for image files, the Windows Media Player playback controls appear instead. For YouTube videos, the YouTube playback controls appear.
Figure 3-38 Media Viewer Pop-Up Window
Name of the incident with which the image or video is associated.
Open in Browser link—Appears only for live video or a video clip. Click to view the video in a web browser.
View area—Displays the image or video that you select.
Volume slider—Available for videos in 3gp, m4v, mov, mp4, or mpg format. Controls the audio of a video. Drag the slider to the right to increase the volume. Drag it to the left to decrease the volume.
Mute button—Available for videos in 3gp, m4v, mov, mp4, or mpg format. Click to mute the audio of a video. The button changes to the Unmute button. Click the Unmute button to turn off muting.
Stop button—Stops displaying the image or video that you selected. When you click this button, the View area appears blank.
Play/Pause/Resume toggle button—Click the Play button to display the image or video that is selected in the Media list (see row 9 in this table).
When you are viewing a video, the Pause/Resume toggle options become available for this button. Use the Pause button or the Resume button to pause the video or restart it.
Event log message area—Displays log messages that are related to the action that you are performing in this window. The icon indicates the severity of the message and can appear as
(indicates a warning message),
(indicates an error message), or
(indicates an informational message). The number to the right of the icon indicates how many unread messages that relate to this window are in the event log. Click the icon or message to see the event log. For related information, see the "Event Log Window" section.
Image or video select buttons—Use these buttons to choose an image in the Media list (see row 9 in this table):
•
—Click to choose the first image or video in the list
•
—Click to choose the previous image or video in the list
•
—Click to choose the next image or video in the list
•
—Click to choose the last image or video in the list
Media list—Lists the images and videos that you can view, and the type of the image or video.
To view an image or video, double-click its name in this list. When you choose an image or a video, it appears in the View area. When you choose a YouTube video, you can click the URL that appears above the video display to play the video in a new browser window.
A highlight bar indicates the selected image or video.
Items Tabs Area
The Items Tabs area appears at the top right of the Cisco IPICS Dispatch Console Main Window (see Figure 3-1). It provides tabs that list VTGs, incidents, and policies, and that provide quick access to detailed information about any of these items. It also provides options for creating VTGs and incidents, and for activating policies.
The tabs and information that you can access in the Items Tabs area depend on your Cisco IPICS role:
•
•
•
•
The Items Tabs area appears by default when you start the Cisco IPICS Dispatch Console, but you can hide it by clicking the Hide button
, which appears to the right of the Items Tabs area. The button changes to the Show button
. Click the Show button to display the Items Tabs area when it is hidden. (These buttons also affect the Dial Pad and Channel Patch area, if it is displayed.)
The following sections describe the tabs that are in the Items Tabs area:
VTGs Tab
The VTGs tab lists the VTGs that are configured in the Cisco IPICS Administration Console. It also lets you create a VTG. Figure 3-39 illustrates the VTGs tab.
Note
Figure 3-39 VTGs Tab
Display control information buttons—The page display
indicates how many pages of VTGs the list includes and which page you are viewing. If the VTGs list more than one page, use the following buttons to navigate through the list pages:
•
—Click to display the first page of VTGs
•
—Click to display the previous page of VTGs
•
—Click to display the next page of VTGs
•
—Click to display the last page of VTGs
Note
Each VTG also includes an icon that designates its state:
•
—Green icon, indicates that the VTG is activated
•
—Red icon, Indicates that the VTG is deactivated
VTGs list—Displays the VTGs that are configured in Cisco IPICS. Double click any VTG in the list to display its VTG Details tab in the View area (see the "VTG Details Tab" section).
Add button—To create a VTG, click this button. In the window that pops up, enter a title and description for the VTG, then click OK.
Details button—Click to display the VTG Details tab in the View area (see the "VTG Details Tab" section). The VTG Details tab contains information for the VTG that is highlighted in the list of VTGs.
Incidents Tab
The Incidents tab lists the incidents that are configured in the Cisco IPICS Administration Console. It also lets you create an incident. Figure 3-40 illustrates the Incidents tab.
If an incident has been deactivated in the Cisco IPICS Administration console, a pop-up window with the following message appears when you access the Incidents tab for that incident:
"Warning: Incident has been deactivated and functionalities are disabled."
In this case, you can view information about the incident, but you cannot make changes to it (add or remove resources), and you cannot activate its incident VTG.
Note
Figure 3-40 Incidents Tab
Display control information buttons—The page display
indicates how many pages of incidents the list includes and which page you are viewing. If the incidents list includes more than one page, use the following buttons to navigate through the list pages:
•
—Click to display the first page of incidents
•
—Click to display the previous page of incidents
•
—Click to display the next page of incidents
•
—Click to display the last page of incidents
Note
Each incident also includes an icon that designates the state of its incident VTG:
•
—Green icon, indicates that the incident VTG is activated
•
—Red icon, indicates that the incident is VTG deactivated
Incidents list—Displays the incidents that are active in the Cisco IPICS Administration Console. Double click any incident in the list to display its Incident Details tab in the View area (see the "Incident Details Tab" section).
The system automatically adds the number in parentheses that appears after an incident name, and increments it by one for each new VTG.
Add button—To create an incident, click this button. In the window that pops up, enter a title and description for the incident, then click OK.
When you create an incident, it immediately becomes active in the Cisco Administration Console and you are added as a participant. Incident participants cannot communicate with each other until the incident VTG is activated for the incident.
Details button—Click to display the Incident Details tab in the View area (see the "Incident Details Tab" section). The Incident Details tab contains information for the incident that is highlighted in the list of incidents.
Policies Tab
For a user with the Cisco IPICS Dispatcher role or All role, the Policies tab lists all policies that are configured in Cisco IPICS. For other users, this tab lists the policies with which they are associated. The Policies tab also lets you activate any policy that it displays, which causes the policy to execute the actions that are configured for it. Figure 3-41 illustrates the Policies tab.
For detailed information about policies, see the "Using the Cisco IPICS Policy Engine" chapter in Cisco IPICS Server Administration Guide.
Figure 3-41 Policies Tab
Display control information buttons—The page display
indicates how many pages of policies the list includes and which page you are viewing. If the policies list includes more than one page, use the following buttons to navigate through the list pages:
•
—Click to display the first page of policies
•
—Click to display the previous page of policies
•
—Click to display the next page of policies
•
—Click to display the last page of policies
Note
Policy list—For user with the Cisco IPICS Dispatcher role or All role, displays all policies. For other user types, displays the policies with which they are associated.
To activate a policy, check the check box next to the policy, then click the Activate button
Note
Activate button—Click to activate selected policies. When activated, a policy begins to execute the actions that are configured for it.
Dial Pad and Channel Patch Area
The Dial Pad and Channel Patch area provides access to the IDC dialer feature, which lets you place up to ten telephone calls and optionally patch each call to up to three selected resources. Patching establishes audio communication between each end device on the call and the audio devices in the resource.
This area is hidden by default when you start the Cisco IPICS Dispatch Console. To display it, click the Show button
next to Dial Pad & Channel Patch, which appears under the Items Tabs area.
Note
next to the right of the View area to see the Dial Pad and Channel Patch area and the Items Tabs area.
•
The IDC dialer feature requires the following configuration in the Cisco IPICS Administration Console and that the Cisco IPICS Dispatch Console be registered with Cisco Unified Communications Manager or Cisco Unified Communications Manager Express:
•
•
Figure 3-42 illustrates the Dial Pad and Channel Patch area.
Figure 3-42 Dial Pad and Channel Patch Area
Show/Hide control—To hide the Dial Pad and Channel Patch area, click the Hide button
. The Show/Hide control remains and the button changes to the Show button
. Click the Show button to redisplay the Dial Pad and Channel Patch area.
Dialed number—Shows the number that you are dialing.
Status line—The following icons provide information about activity in the Dial Pad and Channel Patch area:
•
when there is no call activity on a line. Appears red and animates
when there is call activity on a line
•
indicates an active call on a line.
•
when you put a call on hold. Appears red
when a call is put on hold from an end device.
•
—Indicates an outbound call on a line.
•
—Indicates an inbound call on a line.
•
when a line is not receiving voice traffic. Appears white with waves
when a line is receiving voice traffic.
•
when a line is not sending voice traffic. Appears white with waves
when a line is sending voice traffic.
•
when a call is not patched to other resources. Appears in color with a number
when a call is patched to other resources. The number indicates how many resources the call is patched to.
Message line—If this Cisco IPICS Dispatch Console is registered with Cisco Unified Communications Manager or Cisco Unified Communications Manager Express, this area shows:
•
•
•
This area shows "Unregistered" if the Cisco IPICS Dispatch Console is not configured to use the IDC dialer or if the Cisco IPICS Dispatch Console cannot register with a SIP proxy, such as Cisco Unified Communications Manager or Cisco Unified Communications Manager Express.
Line buttons—Click a line to activate it for dialing.
Status designations for each line include the following:
•
•
indicates that a call is incoming on the line. To address an incoming call, click the line that shows the animated phone icon, then click the Answer button or Reject button to answer or reject the call.
•
indicates that a call is on hold on the line.
If you click an available line button to place call when a call is active on another line, the Cisco IPICS Dispatch Console automatically puts the active call on hold.
Patch button—Click to display the Dialer Patch Manager pop-up window, which you use to patch the selected call to the resource that you choose from the Resource list.
For more detailed information, see the "Dialer Patch Manager Pop-Up Window" section.
Dial pad—Includes these buttons:
•
•
—Click to delete the character to the left of the cursor in the Dialed Number area.
•
•
•
–
–
•
–
–
–
Dialer Patch Manager Pop-Up Window
The Dialer Patch Manager pop-up window lets you patch an active call to up to three powered-on resources that are associated with your Cisco IPICS Dispatch Console.
Figure 3-43 illustrates this window.
Figure 3-43 Dialer Patch Manager Pop-Up Window
Establishing and Patching a Call from the Dial Pad and Channel Patch Area
To use the Dial Pad and Channel Patch area to establish and optionally patch a call to a channel, follow these steps:
Procedure
Step 1
Step 2
If you need to correct an entry, click the backspace
button or the Clear button in the dial pad.
Step 3
Step 4
a.
b.
c.
Step 5
System Information Area
The System Information area appears at the lower right of the Cisco IPICS Dispatch Console Main window. This area displays the system time, your Cisco IPICS user name, and the location to which the Cisco IPICS Dispatch Console is connected.
To hide the System Information area, the Master Audio Controls area, and the All Talk and Patch Controls area, click the Hide button
at the bottom of the Cisco IPICS Dispatch Console Main window, directly under the Cisco logo. The button changes to the Show button
. Click the Show button to redisplay these areas.
Figure 3-44 illustrates the System Information area.
Figure 3-44 System Information Area
P25 Supplementary Services Area
The P25 Supplementary Services area appears to the left of the System Information area in Cisco IPICS Dispatch Console Main window. This area provides access to several services for P25 channels.
To hide the P25 Supplementary Services area, the Master Audio Controls area, and the All Talk and Patch Controls area, click the Hide button
at the bottom of the Cisco IPICS Dispatch Console Main window, directly under the Cisco logo. The button changes to the Show button
. Click the Show button to redisplay these areas.
Figure 3-45 illustrates the P25 Supplementary Services area. To access any service, click its button in this area.
Figure 3-45 P25 Supplementary Services Area
Supplementary services include the following:
•
•
•
•
•
•
•
•
P25 Call Alert Pop-Up Window
The P25 Call Alert pop-up window lets you sends an alert to a the Cisco IPICS Dispatch Console or radio that is registered with the designated P25 subscriber ID.
To display the P25 Call Alert pop-up window, click the ALRT button in the P25 Supplementary Services area. Figure 3-46 illustrates this window.
Figure 3-46 P25 Call Alert Pop-Up Window
P25 Radio Check Pop-Up Window
The P25 Radio Check pop-up window lets you check whether the Cisco IPICS Dispatch Console or radio that is registered with the designated P25 subscriber ID is active. The result of the check appears in a System Message pop-up window on your Cisco IPICS Dispatch Console.
To display the P25 Radio Check pop-up window, click the CHEK button in the P25 Supplementary Services area. Figure 3-47 illustrates this window.
Figure 3-47 P25 Radio Check Pop-Up Window
P25 Radio Detach Pop-Up Window
The P25 Radio Detach pop-up window unregisters the Cisco IPICS Dispatch Console or radio that is registered with the designated P25 subscriber ID.
To display the P25 Radio Detach pop-up window, click the DTCH button in the P25 Supplementary Services area. Figure 3-48 illustrates this window.
Figure 3-48 P25 Radio Detach Pop-Up Window
P25 Radio Inhibit Pop-Up Window
The P25 Radio Inhibit pop-up window disables the radio that is registered with the designated P25 subscriber ID.
To display the P25 Radio Inhibit pop-up window, click the INHB button in the P25 Supplementary Services area. Figure 3-49 illustrates this window.
Figure 3-49 P25 Radio Inhibit Pop-Up Window
P25 Short Message Pop-Up Window
The P25 Short Message pop-up window lets you send a predefined message to the Cisco IPICS Dispatch Console or radio that is registered with the designated P25 subscriber ID.
Messages that you can send are predefined in the <StatusMessages> element in the Cisco ISSI Gateway descriptor file. (For information about descriptor files, see the "Managing Radios and Radio Descriptors" chapter in Cisco IPICS Server Administration Guide.)
A message that you send appears on a radio display or in a System Message pop-up window on the Cisco IPICS Dispatch Console of the recipient.
To display the P25 Short Message pop-up window, click the MSSG button in the P25 Supplementary Services area. Figure 3-50 illustrates this window.
Figure 3-50 P25 Short Message Pop-Up Window
P25 Status Query Pop-Up Window
The P25 Status Query pop-up window lets you send a query to and obtain the status of the radio that is registered with the designated P25 subscriber ID. The status that you obtain appears in a System Message pop-up window on your Cisco IPICS Dispatch Console.
The status updates that you can receive from the radio are predefined in the <StatusUpdates> element in the Cisco ISSI Gateway descriptor file. (For information about descriptor files, see the "Managing Radios and Radio Descriptors" chapter in Cisco IPICS Server Administration Guide.)
To display the P25 Status Query pop-up window, click the QERY button in the P25 Supplementary Services area. Figure 3-51 illustrates this window.
Figure 3-51 P25 Status Query Pop-Up Window
P25 Radio Unit Monitor Pop-Up Window
The P25 Radio Unit Monitor pop-up window lets you monitor the radio that is registered with the designated P25 subscriber ID. Audio from the radio plays on your Cisco IPICS Dispatch Console client PC.
When you use this feature, the target radio sends audio for a period that is configured in the radio. After that time, monitoring stops automatically.
To display the P25 Radio Unit Monitor pop-up window, click the RMON button in the P25 Supplementary Services area. Figure 3-52 illustrates this window.
Figure 3-52 P25 Radio Unit Monitor Pop-Up Window
P25 Radio Uninhibit Pop-Up Window
The P25 Radio Uninhibit pop-up window reenables a radio that has been inhibited.
To display the P25 Radio Uninhibit pop-up window, click the UNHB button in the P25 Supplementary Services area. Figure 3-53 illustrates this window.
Figure 3-53 P25 Radio Uninhibit Pop-Up Window
Master Audio Controls Area
The Master Audio Controls area appears at the bottom of the Cisco IPICS Dispatch Console Main window. This area provides controls for muting and controlling the volume of the audio that is received from all activated resources.
To hide the Master Audio Controls area, the System Information area, and the All Talk and Patch Controls area, click the Hide button
at the bottom of the Cisco IPICS Dispatch Console Main window, directly under the Cisco logo. The button changes to the Show button
. Click the Show button to redisplay these areas.
Figure 3-54 illustrates the Master Audio Controls area.
Figure 3-54 Master Audio Controls Area
All Mute button—Click to globally mute (silence) the audio traffic that is received from all activated resources and the IDC dialer. The button changes to the All Unmute button
. Click the All Unmute button to turn off global muting.
Microphone status icon—A gray microphone icon
with a number indicates that at least one microphone is assigned to the SELECTED group for this Cisco IPICS Dispatch Console (see the Settings Tab—Audio Connections Options). The number shows how many microphones are assigned to the SELECTED group.
A red microphone icon
indicates that no microphones are assigned to the SELECTED group.
Master Volume slider—Controls the audio that is received from all activated resources. Drag the slider up to increase the volume. Drag it down to decrease the volume.
All Talk and Patch Controls Area
The All Talk and Patch Controls area appears at the lower left of the Cisco IPICS Dispatch Console Main window. This area provides controls for communicating with several resources simultaneously. You can talk to selected resources, patch selected resources together to create an audio conference, or send alert tones to selected resources.
This area is available only if Advanced IDC Permissions are configured for you in the Cisco IPICS Administration Console.
To select a resource to be included when you use the PTT, Patch, DTMF, or alert tones feature in the All Talk and Patch Controls area, check the Select check box for that resource. For information about the Select check box for a resource, see these sections:
Note
To hide the All Talk and Patch Controls area, the System Information area, and the Master Audio Controls area, click the Hide button
at the bottom of the Cisco IPICS Dispatch Console Main window, directly under the Cisco logo. The button changes to the Show button
. Click the Show button to redisplay these areas.
Figure 3-55 illustrates All Talk and Patch Controls area.
Figure 3-55 All Talk and Patch Controls Area
Select all check box—Click to select all activated resources. These resources are then affected by a PTT, Patch, or alert operation.When this box is checked, check it to unselect all selected resources.
Note
PTT button—Click and hold to talk (transmit audio) to all selected resources. Release when you are not talking.
You select resources as described in row 1 in this table.
Alerts—If alerts are configure in the Cisco Administration Console, they appear here. Click an alert to send it to the selected resources.
You select resources as described in row 1 in this table.
Patch button—Click to patch (connect) selected resources to each other. The button changes to Unpatch. Click the Unpatch button to remove the patch that is in effect between channels.
You select resources as described in row 1 in this table.
DTMF button—Click to enter dual-tone multi-frequency (DTMF) mode. The button turns green. Click it again to exit DTMF mode.
In DTMF mode, the Cisco IPICS Dispatch Console sends DTMF information to the selected tone control radio when you press a character 0 through 9, A through D, #, or * on your client PC keyboard.
Regions List
The Regions list appears at the upper left of the Cisco IPICS Dispatch Console Main window. This list shows the regions that are configured in the Cisco IPICS Administration Console and provides controls for the resources in each region.
The Regions list appears by default when you start the Cisco IPICS Dispatch Console, but you can hide it by clicking the Hide button
, which appears to the right of the Items Tabs area. The button changes to the Show button
. Click the Show button to display the Regions list when it is hidden.
An alert icon
indicates that a resource is experiencing connectivity issues or that the resource is disabled in the Cisco IPICS Administration Console.
Figure 3-56 illustrates Regions list.
Figure 3-56 Regions List
Hide Region View button—Click to collapse an expanded region view.
Expanded region view—Displays each resource that is in the region.
You can change the position of a resource within a region view by dragging and dropping. To do so, click and hold its resource handle, then drag and drop the resource to a new location. Figure 3-57 illustrates a resource handle.
You also can move a resource to another region by dragging and dropping. To do so, click and hold its resource handle, then drag and drop the resource to the desired region (and position, in an expanded region view).
If an expanded region view appears with a red border, the Cisco IPICS Dispatch Console is in emergency mode. For more information, see the "Emergency Mode" section.
Collapsed region view.
If a collapsed region view flashes red, the Cisco IPICS Dispatch Console is in emergency mode. For more information, see the "Emergency Mode" section.
Hide Regions List button—Click to hide the Regions list. The button changes to the Show button
. Click the Show button to display the Regions list when it is hidden.
Show Region View button—Click to expand a collapsed region view.
Powered off resource. To power on a resource that is powered off, click the Power button
.
This button can appear in the following states:
•
•
•
•
Note
Powered on resource. For detailed information about controls for a powered-on resource, see the "Powered-On Resource Controls" section.
Powered-On Resource Controls
A powered-on resource appears in the Regions list as described in Figure 3-56. The Regions list provides controls and information for powered-on resources. Figure 3-57 describes these items.
Note
Figure 3-57 Powered Resource Controls in the Regions List
Resource handle. Used to drag and drop the resource to another location within the region view or to another region in the Region tab.
The patch icon
appears in this area if this resource is patched to another resource.
Incoming traffic indicator—Turns green when the channel receives audio traffic.
Event Log Message icon—Indicates that the event log contains one or more messages that relates to this resource. The icon indicates the severity of the message and can appear as
(indicates a warning message),
(indicates an error message), or
(indicates an informational message). The number to the left of the icon indicates how many unread messages that relate to this resource are in the event log. Click the icon to see the event log. For related information, see the "Event Log Window" section.
Select check box (appears only if Advanced IDC Permissions are configured for you in the Cisco IPICS Administration Console)—Check to include this resource when you use the PTT, Patch, DTMF, or alert tones features. For information about these features, see the "All Talk and Patch Controls Area" section.
Power button—Click to power off the resource.
This button can appear in the following states:
•
•
•
•
Resource Type icon:
•
—Channel icon
•
—P25 channel icon
•
—Direct dial channel icon
•
—Radio icon
•
—VTG icon
•
—Incident icon
PTT button—Click and hold to talk (transmit audio) to others who are using this resource. Release when you are not talking.
If this button changes to yellow when you click it or when it is latched, you have engaged the push to talk (PTT) feature. If this area flashes when you click it or when you engage latch for a P25 channel, you do not have the floor.
When you engage the PTT feature, a green bar appears at the bottom of this button when the resource is ready to transmit audio. To ensure that your audio is fully transmitted, wait until the green bar completely displays before you start talking.
If this area appears gray with a red bar at the bottom when you click it, the resource cannot transmit audio. This situation can occur in a variety of cases, such as if no microphone is selected for this Cisco IPICS Dispatch Console (see the Settings Tab—Audio Connections Options).
This area displays diagonal lines if this resource is configured as listen-only or if your Cisco IPICS user account is configured as listen only.
This button shows the name of the resource as it is configured in the Cisco IPICS Administration Console. In addition, when audio is received, this area may show the talker ID. For a P25 channel, talker ID is either the P25 subscriber ID of the IPICS user you are communicating or the radio ID of the device you are communicating with. For other resources, talker ID is either the Cisco IPICS user ID or the radio unit ID. Talker ID is not displayed if you are logged in using the Remote location and Cisco IPICS is using an RMS, or if your network or system cannot obtain this information.
Latch button—Appears if the latch functionality is enabled for you and this resource as follows:
•
•
•
Click the Latch button to latch the PTT feature. Click it again to unlatch. When you latch the PTT feature, this button becomes green and the PTT area becomes yellow.
Mute button—Click to locally mute (silence) incoming audio traffic from the channel. The button changes to the Unmute button
. Click the Unmute button to unmute.
Audio Selection button—Choose the device group to which audio that the resource receives is sent. Options are SEL, U1, U2, and U3, which correspond to the device groups SELECTED, UNSELECTED1, UNSELECTED2, and UNSELECTED3, respectively.
For information about configuring device groups, see the "Settings Tab—Audio Connections Options" section.
Audio Received time stamp—Displays the time that the resource last received an audio transmission. You can click this time stamp to display the expanded audio controls for the resource (see the "Audio Replay Controls for Resources" section.)
For last call transmit functionality, locate the most current time stamp then PTT on that resource.
Note
Secure channel indicator—Yellow and black stripes
appear if a channel, P25 channel, or radio is configured as a secure resource in the Cisco IPICS Administration Console.
Patch icon—Appears if this channel is patched to one or more other resources.
For more information, see the "All Talk and Patch Controls Area" section.
Transmit indicator—Turns red when you transmit audio on the channel.
Event Log Window
An Event Log window displays a Cisco IPICS Dispatch Console event log, which contains information about various system events that occurred during your current Cisco IPICS Dispatch Console session. The system creates event logs automatically as you operate the Cisco IPICS Dispatch Console.
An event log can contain up to 200 messages. When a log reaches this limit, the system begins to overwrite messages, starting with the first message received. In addition, the system clears the event logs when you exit the Cisco IPICS Dispatch Console.
The Cisco IPICS Dispatch Console also logs other information as described in the "Cisco IPICS Dispatch Console Logs" section.
You can display an Event Log window in these ways:
•
•
The Event Log window displays error, warning, and informational log messages. By default, the window displays each log message on one line. Messages appear in the order that associated events occurred. The most recently received message appears first.
Figure 3-58 illustrates the Event Log window.
Figure 3-58 Event Log Window
Message summary—The following icons indicate the type of log message, and the number that appears to the immediate right of an icon indicates how many messages of that type are displayed in the Messages area:
•
—All messages
•
—Error messages
•
—Warning messages
•
—Informational messages
Click the Star icon to enter filter mode. Then you can click any other icon to display only messages the type that the icon identifies.
Messages area—Displays each log message.
Unread messages flash. To mark a message as read, click it. To simultaneously mark all messages as read, click the Mark all as read button (see row 3 in this table).
An icon to the left of the text of a message indicates the severity of the message:
•
—Error message
•
—Warning message
•
—Informational message
Some messages include an expand icon
that you can click to see more detailed information about an event. Click a collapse icon
to see less information about an event.
To display detailed information that is related to a message, click the message for the event. The detailed information appears in the Additional Information area (see row 6 in this table).
Mark all as read button—Click to indicate that all log messages in the Event Log window have been read. Clicking this button stops all messages from flashing.
Resize handle— Click and drag to resize the Event Log window.
Close button—Click to exit the Event Log window.
Additional Information area—Displays the type of message and the date and time that the associated event occurred. Also provides information that Cisco can use to assist you with troubleshooting, if needed.
Emergency Mode
The Cisco IPICS Dispatch Console goes into emergency mode in the following situations:
•
•
Emergency Mode Indications
When the Cisco IPICS Dispatch Console goes into emergency mode, you are notified in the following ways.
Note
•
•
•
•
Figure 3-59 Regions List Expanded Region View when Cisco IPICS Dispatch Console is in Emergency Mode
•
–
–
–
Responding to Emergency Mode in the Cisco IPICS Dispatch Console
When the Cisco IPICS Dispatch Console is in emergency mode, follow these steps to respond to the emergency:
Procedure
Step 1
The Details tab appears when you click the Details button
for the resource in the View area.
Step 2
Alerts appear on the Channel Details for P25 Channels tab by default.
Step 3
•
•
Responding to Emergency Mode in the SRCI
When the SRCI indicates that emergency mode is in effect, click the Emergency button in the SRCI to see the following information from the radio that triggered emergency mode:
•
•
•
Note
for a powered-on Nextel radio in the View area. If your Cisco IPICS Dispatch Console is communicating via an RMS component and you either specify the Remote location when you log in to the Cisco IPICS Dispatch Console or the radio for which you are viewing the Radio Details for Nextel Radios tab is in a location other than the location that you logged in to, the SRCI appears. For detailed information about the SRCI, see the "Managing Radios and Radio Descriptors" chapter in Cisco IPICS Server Administration Guide.
System Messages
A system message provides information that relates to the operation of the Cisco IPICS Dispatch Console. A message can indicate a situation with Cisco IPICS Dispatch Console the that requires immediate attention or that you should be aware of. It also can display information that you request, such as the status of a radio, or a message that is sent to you by another user.
Each system message is displayed in a System Message pop-up window, which appears by default in the lower right corner of your client PC monitor. After you view a system message, you can close the window. The Cisco IPICS Dispatch Console does not save system messages after you close a System Message pop-up window.
Figure 3-60 shows an example of a system message.
Figure 3-60 System Message Pop-Up Window
Message type icon:
•
—Error message
•
—Warning message
•
—Informational message
System message.
Alert Messages
If you are configured as the recipient of an alert action in a Cisco IPICS multipurpose policy, your Cisco IPICS Dispatch Console displays an alert message when the policy executes. The alert message appears in the Alert pop-up window, as shown in Figure 3-61, and includes the date and time that the policy executed, and the text of the alert.
Figure 3-61 Alert Pop-Up Window