Key Products
Back to topWorldwide utilization of general-use Cisco TelePresence units remains just under 50 percent based on a ten-hour day. Many Cisco TelePresence units are booked at or over 100 percent capacity based on a ten-hour day. Further utilization is constrained by room availability or because of differences in time zone between meeting endpoints. The table below illustrates our rollout of Cisco TelePresence across the company since September 2006, which was the first quarter of FY07. We have installed various Cisco TelePresence models at many locations to accommodate the different requirements of each site. This includes models that accommodate anywhere from one or two users in a private office setting to larger group meetings of up to 18 people. By having a range of Cisco TelePresence units available, more types of interactions can be virtualized, avoiding more physical travel and reducing travel expenses and GHG emissions.
| Cumulative, as of end of fiscal year |
Total number of Cisco TelePresence rooms | Total number of cities | Total number of countries |
|---|---|---|---|
| FY07 (general use units) | 72 | 50 | 20 |
| FY08 (general use units) | 179 | 109 | 37 |
| FY09 (general use units) | 369 | 156 | 44 |
| FY10 (general use units) | 534 | 214 | 59 |
| FY07 (private or EBC units)* | 26 | 6 | 3 |
| FY08 (private or EBC units) | 53 | 12 | 7 |
| FY09 (private or EBC units) | 179 | 47 | 21 |
| FY10 (private or EBC units) | 334 | 73 | 26 |
*EBC stands for Executive Briefing Centers, regional meeting facilities that Cisco uses for presentations to customers.
Cisco WebEx and Cisco MeetingPlace products are also part of the suite of solutions used by Cisco employees to avoid physical travel by using remote collaboration within Cisco and with our customers, partners, and other stakeholders. As shown in the following table, our use of Cisco MeetingPlace and Cisco WebEx has doubled each of the last two years, mirroring a similar growth in Cisco TelePresence use. A "people-hour" is one person attending a remote meeting for one hour, either by teleconference or via the web and a personal computer. Five people attending a two-hour meeting would equal ten people-hours. Use of web conferencing is pervasive at Cisco because of the global nature of our collaborative business processes and management practices.
| Year | Total web-conferencing (millions of people-hours) |
|---|---|
| FY07 | 4.7 |
| FY08 | 7.6 |
| FY09 | 13.3 |
| FY10 | 19.3 |
* Previous year metrics have been changed to reflect revised or corrected prior-year data.
As shown in the following table, employees have rapidly adopted Cisco Virtual Office technologies, which include an integrated services router and IP phone, to effectively work remotely. Although telecommuting or working in a flexible office space does not directly reduce air travel, it does afford opportunities to become more proficient in using collaborative technologies. This proficiency can be applied directly to business activities where remote collaboration does reduce air travel.
| Calendar Year | Total users |
|---|---|
| 2005 | 1467 |
| 2006 | 5006 |
| 2007 | 8234 |
| 2008 | 15,305 |
| 2009 | 17,488 |
| 2010 (through July) | 19,195 |
* Previous year metrics have been changed to reflect revised or corrected prior-year data.
People
Back to topCisco employs more than 70,700 people in 93 countries and over 420 locations worldwide. Approximately one-quarter (24%) of our employees work at the headquarters site in San Jose, California. Our workforce has a wide variety of skill sets, but it can be divided broadly into engineering, sales, and other business functions.
| Workforce | Percentage |
|---|---|
| Engineering | 33.8% |
| Sales | 25.5% |
| Other Business Functions | 40.7% |
The tables below characterize the employees we have hired over the past five years in terms of gender and ethnicity. The ethnicity figures in the second table are given for employees in the United States only.
| FY06 | FY07 | FY08 | FY09 | FY10 | |
|---|---|---|---|---|---|
| Total Number of Hires | 3120 | 4982 | 4517 | 2536 | 4970 |
| Number of Female Hires | 694 | 1029 | 1018 | 484 | 912 |
| Percent of Female Hires | 22% | 21% | 23% | 19% | 18% |
| FY06 | FY07 | FY08 | FY09 | FY10 | |
|---|---|---|---|---|---|
| Total Number of Hires | 3562 | 5821 | 5441 | 4208 | 3837 |
| Number of Female Hires | 1014 | 1712 | 1643 | 1034 | 835 |
| Percent of Female Hires | 28% | 29% | 30% | 25% | 22% |
| Number of Non-Caucasian Hires | 1642 | 3108 | 2838 | 2191 | 1591 |
| Percent of Non-Caucasian Hires | 46% | 53% | 52% | 52% | 42% |
| Total Number of Female Caucasian Hires, and Male and Female Non-Caucasian Hires | 2111 | 3858 | 3533 | 1249 | 2035 |
| Total Percent of Female Caucasian Hires and Male and Female Non-Caucasian Hires | 59% | 66% | 65% | 57% | 53% |
Cisco employees by world market region
Cisco is a global organization with a widely dispersed workforce. The table below indicates the number of Cisco employees working in various regions of the world.
| FY06 | FY07 | FY08 | FY09 | FY10* | |
|---|---|---|---|---|---|
| Asia Pacific | 4411 | 7528 | 9276 | 10,169 | 11,938 |
| Emerging Markets | 1549 | 2406 | 2921 | 7860 | 8550 |
| Europe | 5778 | 6907 | 7604 | 8082 | 8814 |
| Japan | 1015 | 1158 | 1253 | 1278 | 1290 |
| United States and Canada | 28,659 | 33,494 | 35,832 | 38,156 | 39,173 |
*The FY10 numbers do not include a small number of employees from a recent acquisition.
Cisco employee benefits- Adoption Assistance
- Autism Benefit (Global)
- Children's Scholarship Fund (Global)
- Death Benefits for Family (Global)
- Education Benefits: Employee Tuition Assistance (Global)
- Education Benefits: Family Services
- Family Crisis Assistance (Global)
- Elder Care Program (Global)
- Employee Assistance Program (Global)
- Employee Bonus Program (Global)
- Employee Discount Program (U.S. and UK)
- Financial Education (U.S.)
- Flexible Work Practices (Global)
- Health & Wellness Programs (Multi-country)
- Health Insurance: Medical, disability and life benefits; dental and vision where prevalent (Global)
- Insurance: Healthcare Domestic Partner eligibility (Global)
- On-site Cafeterias
- On-site Child Care Centers (two centers in San Jose, CA, one in Bangalore, India, opening November 2010)
- On-site Fitness Center (Multiple Locations)
- On-site Health Centers (San Jose, CA, Bangalore, India, HealthPresence in RTP)
- On-site Pharmacy, Vision Center (San Jose, CA)
- Relocation Assistance (Global)
- Tax-Advantage Long-Term Savings with company contribution (ex. Retirement: 401(k))
- Off/On Ramp Program (Up to two years off work, first year with medical benefits)
- Employee Stock Purchase Plan
Cisco provides culturally relevant leave of absence and time off programs for employees globally. Examples of these programs in the U.S. include:
- Adoption Leave: Paid
- Bereavement Time Off: Paid
- Educational Leave: Unpaid
- Jury Duty Time Off: Paid
- Pregnancy Disability Leave/Maternity Leave: Paid
- Family Medical Leave and Long-Term Medical Leave: Paid (STD, LTD, SDI/VDI income replacement)
- Military Leave: Differential Paid
- Paid Time Off: Paid
- Paternity Leave: Unpaid
- Personal Leave: Unpaid
| Type | Amount |
|---|---|
| Total spent on employee training and development | $90 million |
| Percent of employees participating in at least one course | 82% |
| Total hours spent in learning and development courses | 1.5 million |
Environment
Back to topPurchasing Renewable Energy
Cisco purchases renewable power where it is available in the local power market. Cisco plans to support non-carbon energy sources in other regions of the world as they become available in the marketplace.
Renewable electricity purchases| FY06 | FY07 | FY08 | FY09 | FY10 | |
|---|---|---|---|---|---|
| Electricity from renewable sources (GWh) | 2 | 110 | 342 | 469 | 351 |
| Electricity from renewable sources (%) | <1% | 10% | 28% | 37% | 27% |
| GHG emissions avoided (metric tonne CO2e) | 773 | 65,736 | 243,450 | 355,235 | 257,616 |
| Region | Percent of FY10 electricity from renewable sources |
|---|---|
| Global | 27% |
| United States | 29% |
| Europe | 65% |
1 Cisco buys Renewable Energy Certificates (RECs) and has entered into green power contracts with various electricity suppliers in the United States. Purchased RECs are certified by Green-e, an independent auditor of renewable energy products, and are generated from hydropower, wind power, and biomass projects throughout the United States. Cisco also purchases renewable energy through various European green power suppliers. We follow the guidelines from the United Kingdom's Department for Environmental and Rural Affairs (DEFRA) and use a grid average rate when calculating emissions associated with this power. Cisco is ranked seventh in the U.S EPA's Green Power Partnership.
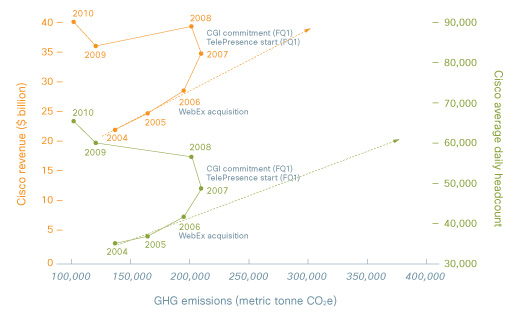
Avoided CO2 emissions from use of Collaboration Technologies
It is difficult to project with certainty what might have happened to Cisco air travel emissions without widespread use of these collaborative technologies. However, in response to stakeholder inquiries, Cisco has compared changes to our actual air travel emissions against changes to revenue and headcount. Revenue and headcount are the two factors believed to be the primary drivers of air travel. In the following figure, actual emissions are plotted against headcount (right axis) and revenue (left axis).
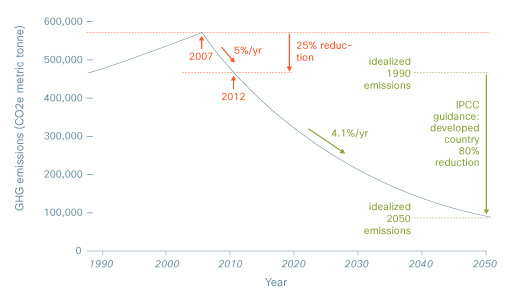
Idealized Greenhouse Gas emissions reduction model
Stakeholders have requested reduction goals beyond 2012. We believe our focus on executing existing commitments is best practice given the five-year horizon (2007 to 2012) of existing goals and the substantial existing challenge to the business. However, we have reviewed global reduction goals and Cisco's potential role in meeting the global challenge of climate change. The following figure places our 25 percent reduction goal in the context of the 80 percent goal for developed countries highlighted by the Intergovernmental Panel on Climate Change (IPCC). More discussion will be needed to better understand how developed and emerging country emissions allocation will affect future Cisco reduction goals.
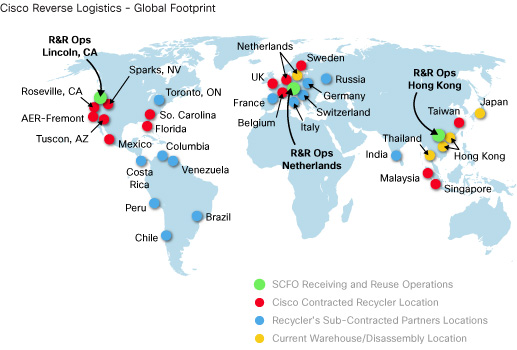
Cisco product reclamation, recycling and reuse operations
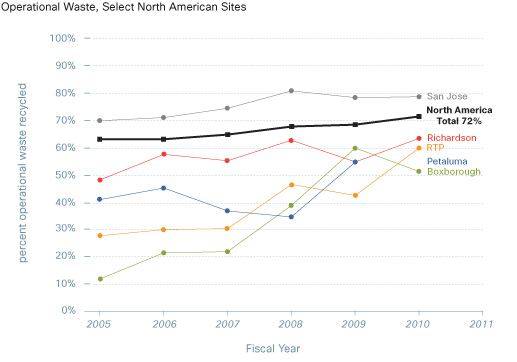
Operational waste
Cisco's Waste Reduction and Recycling Program is a key component of Cisco ISO 14001 certification and our global environmental policy. We routinely collect and recycle batteries, CDs and diskettes, beverage containers, trash, wood and pallets, cardboard, mixed paper, confidential waste, packaging materials, toner cartridges, compost, polyurethane foam, landscape waste, mobile phones, food waste, and construction waste.
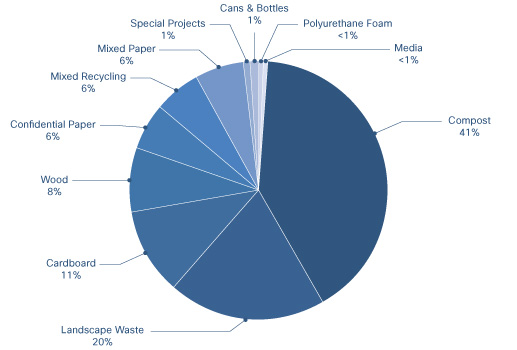
Breakdown of waste stream from Cisco's San Jose site
Society
Back to top| Year (as of July 31) | Number of sites |
|---|---|
| 1997 | 7 |
| 1998 | 27 |
| 1999 | 71 |
| 2000 | 128 |
| 2001 | 142 |
| 2002 | 149 |
| 2003 | 155 |
| 2004 | 163 |
| 2005 | 164 |
| 2006 | 164 |
| 2007 | 164 |
| 2008 | 166 |
| 2009 | 168 |
| 2010 | 165 |
*For administrative purposes, we have defined some geographical areas as countries that are not autonomous states or are not recognized as countries by international bodies such as the United Nations. Examples of these include American Samoa, Hong Kong, and Puerto Rico.
| Education Level | Percentage |
|---|---|
| Upper secondary/high schools* | 14% |
| Community colleges (two and three year) | 34% |
| Four-year colleges/universities** | 46% |
| Others*** | 6% |
*Includes grades 6 through 12.
**Includes post-graduate.
***Includes community and nonacademic sites; also includes postgraduate outside four-year institutions.
Networking Academy student profile
View a table![]() that gives a profile of Networking Academy students according to Cisco's major market regions and subregions.
that gives a profile of Networking Academy students according to Cisco's major market regions and subregions.
| Type | FY06 | FY07 | FY08 | FY09 | FY10 |
|---|---|---|---|---|---|
| Foundation total (corporatewide) | $9.3 | $8.8 | $10.7 | $10.1 | $10.5 |
| In-kind total (corporatewide product and people) | $39.4 | $49.0 | $37.9 | $83.7 | $96.7 |
| Cash total (Foundation cash and corporatewide cash) | $76.1 | $67.7 | $54.1 | $44.9 | $42.0 |
| Corporatewide giving total | $88.7 | $93.6 | $92.0 | $128.6 | $138.7 |
| Funds from Cisco to Cisco Foundation | 26.8 | 23.2 | 0 | 0 | 0 |
| Contributions as a percentage of earnings before income, tax (EBIT) from previous year | 1.4% | 1.5% | 0.97% | 1.25% | 1.47% |
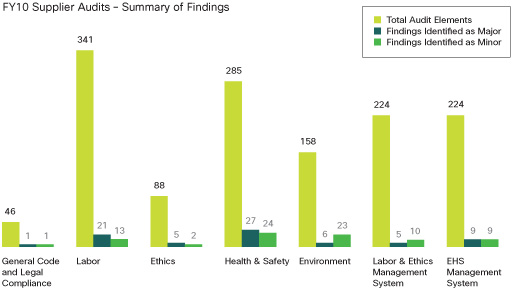
Value Chain
Back to topThe following chart summarizes the findings from our FY10 supplier audits, which reviewed supplier performance across all four pillars of value chain sustainability. Cisco undertook 1366 unique areas of investigation in our audits. Those audits revealed that the suppliers reviewed, on average, were fully compliant to 94 percent of those 1366 areas of investigation. Cisco and our suppliers ensured that each major and minor finding identified was fully addressed within the fiscal year.