The Cisco® Global Cloud Index is an ongoing effort to forecast the growth of global data center and cloud-based IP traffic. The study also includes a "Cloud Readiness" analysis that investigates the ability of each global region (Asia Pacific, Central and Eastern Europe, Latin America, Middle East and Africa, North America, and Western Europe) to support a sample set of basic, intermediate, and advanced business and consumer cloud applications. Each region's cloud readiness is assessed in relationship to the sample services based on download and upload fixed and mobile network speeds as well as associated network latencies (segmented by business and consumer connections). This supplement provides additional country-level details that collectively represent the basis for each region's network performance averages (speeds and latencies). Please see the Cisco Global Cloud Index: Forecast and Methodology, 2012-2017 for complete research findings and projections.
Country-Level Details of Regional Cloud Readiness
The Cloud Readiness portion of the Cisco Global Cloud Index includes over 90 million records from Ookla1, the Cisco GIST application, Ovum, Informa, Telecoms and Media, Point Topic, International Telecommunication Union (ITU) and the United Nations (UN). The network performance data gathered represents nearly 150 countries around the world, covering a span of two years. The regional averages presented in the Cisco Global Cloud Index: Forecast and Methodology, 2012-2017 are based on the detailed analysis of these speed tests.
Individual countries may have slightly or significantly higher or lower averages compared to their regional averages for download speed, upload speed, and network latency. In some cases, individual countries did not have enough test results to warrant inclusion in a particular network metric category (e.g., fixed or mobile download or upload speed). The same applies to segmentation categories, as well. If a country has a statistically significant number of results with consumer speeds but an inadequate sample size for the business speeds, the consumer speeds are the only segment results shared in the study. Hence, some countries are included in some categories but excluded from others. For normalization and to prevent skewing of the data, we have applied the fifth to ninety-fifth percentile methodology to our study (the top 5 percent and bottom 5 percent of results in fixed and mobile performance categories by country are excluded).
For the purposes of this study, participating countries are classified into two general categories: Cloud Prepared and Cloud Emerging. These categorizations are based on a combination of the country's network download (DL), upload (UL), and latency characteristics. Download speeds in kilobits per second (kbps), upload speeds in kilobits per second (kbps), and latency in milliseconds (ms) were given equal weights in calibrating each country's network performance. The study has traditionally focused on average or mean download (Avg DL), upload (Avg UL), and latency (Avg Latency) characteristics. However, to better understand the distribution of speeds within a country, the median download speed in kbps (Median DL), median upload speed in kbps (Median UL), and the median latency in milliseconds (Median Latency) are being introduced to the study. In most countries, median speeds are lower than mean and average speeds. This is due to the higher occurrence of lower speeds in the lower fiftieth percentile, compared to the longer tail of distribution of the higher speeds. The median of a set of numbers is the midpoint, where half the numbers are lower and half the numbers are higher. The average of a set of numbers is the total of those numbers divided by the number of items in that set. Please see the download speed distribution curves for six countries within six regions in Appendix A. Countries that are classified as Cloud Prepared have network performance characteristics that are superior to countries that are classified as Cloud Emerging.
The following sections in the supplement present country-level cloud readiness results within each region and category. Countries are listed in alphabetical order. For a discussion about the relationship of application requirements to network capabilities, please refer to the Global Cloud Readiness section of the Cisco Global Cloud Index: Forecast and Methodology, 2012-2017.
Cloud Prepared: Fixed
Tables 1 through 3 provide details on individual countries that are Cloud Prepared. Table 1 lists countries that are cloud prepared based on their overall (consumer and business) fixed network characteristics, Table 2 lists countries that are cloud prepared based on their consumer fixed network characteristics, and Table 3 lists countries based on their business fixed network characteristics.
Table 1. Cloud-Prepared Countries: Overall (Consumer and Business) Fixed Networks
Table 3. Cloud-Prepared Countries: Business Fixed Network
Region
Country
Avg. DL (kbps)
Median DL (kbps)
Avg. UL (kbps)
Median UL (kbps)
Avg. Latency (ms)
Median Latency (ms)
Asia Pacific
Korea
29,533
23,627
24,263
19,410
85
68
New Zealand
11,256
9,005
4,167
3,334
78
62
Thailand
12,112
9,690
3,763
3,010
87
69
Vietnam
18,355
14,684
9,710
7,768
20
16
Central and Eastern Europe
Bulgaria
24,375
19,500
13,958
11,167
44
35
Estonia
16,276
13,020
6,047
4,838
63
50
Georgia
11,593
9,275
9,936
7,949
66
53
Hungary
17,409
13,927
5,127
4,101
51
41
Romania
26,891
21,513
15,381
12,305
55
44
Slovakia
14,798
11,839
5,729
4,583
55
44
Slovenia
12,216
9,773
5,598
4,479
58
46
Latvia
24,408
19,526
15,741
12,593
59
47
Macedonia
9,089
7,271
4,282
3,426
62
49
Moldova
22,615
18,092
10,544
8,435
66
52
Ukraine
15,620
12,496
10,537
8,429
83
66
Latin America
Aruba
10,140
8,112
1,722
1,377
53
43
Middle East and Africa
Kazakhstan
10,934
8,747
8,377
6,701
92
73
North America
Canada
19,033
15,226
12,754
10,203
60
48
United States
13,205
8,961
8,691
6,952
122
98
Western Europe
Belgium
21,232
16,985
3,220
2,576
47
38
Germany
31,173
24,939
19,881
15,905
67
54
Iceland
25,341
20,273
16,668
13,334
52
41
Portugal
22,667
18,133
4,403
3,523
49
39
Luxembourg
28,128
22,502
13,640
10,912
64
51
Malta
16,917
13,533
2,028
1,623
48
39
United Kingdom
14,314
11,451
10,193
8,154
90
72
Cloud Emerging: Fixed
Tables 4 through 6 provide details on individual countries that are considered to be emerging, from a cloud preparedness perspective. Countries are listed within each region alphabetically. Table 4 lists countries that are cloud emerging based on their overall (consumer and business) fixed network characteristics, Table 5 is based on consumer fixed network characteristics, and Table 6 is based on business fixed network characteristics.
Table 4. Cloud-Emerging Countries: Overall (Consumer and Business) Fixed Networks
Table 6. Cloud-Emerging Countries: Business Fixed Network
Region
Country
Avg. DL (kbps)
Median DL (kbps)
Avg. UL (kbps)
Median UL (kbps)
Avg. Latency (ms)
Median Latency (ms)
Asia Pacific
Bangladesh
1,470
1,176
1,816
1,453
173
138
Brunei Darussalam
3,857
3,085
2,140
1,712
129
103
Cambodia
3,516
2,813
3,944
3,156
89
71
Fiji
3,238
2,591
1,063
851
122
97
Guam
6,067
4,853
1,673
1,339
98
78
India
5,917
4,733
4,944
3,955
139
111
Indonesia
2,509
2,007
1,220
976
145
116
Sri Lanka
2,970
2,376
872
698
161
129
Maldives
3,989
3,191
2,016
1,613
132
106
Mongolia
8,642
6,914
6,551
5,241
109
87
Myanmar
2,737
2,190
2,012
1,609
244
195
Nepal
1,792
1,434
2,491
1,993
124
99
New Caledonia
5,770
4,616
917
734
90
72
Central and Eastern Europe
Albania
4,512
3,610
1,911
1,529
105
84
Armenia
6,270
5,016
4,526
3,621
89
71
Azerbaijan
3,628
2,902
1,398
1,118
98
78
Bosnia and Herzegovina
4,216
3,373
1,023
819
78
62
Russian Federation
5,445
4,356
4,833
3,866
59
47
Serbia
6,001
4,801
1,435
1,148
61
49
Montenegro
4,955
3,964
1,035
828
105
84
Turkey
8,074
6,459
2,936
2,349
65
52
Uzbekistan
960
768
888
710
200
160
Latin America
Antigua and Barbuda
2,382
1,905
1,155
924
162
129
Argentina
3,943
3,154
1,038
830
104
83
Belize
2,683
2,146
1,476
1,181
99
79
Bermuda
5,782
4,625
2,296
1,837
63
50
Bolivia
1,294
1,035
574
459
275
220
Cayman Islands
5,530
4,424
3,320
2,656
108
86
Costa Rica
2,769
2,215
1,042
834
141
113
Dominican Republic
3,220
2,576
1,514
1,211
105
84
Ecuador
3,764
3,011
3,229
2,583
108
86
El Salvador
2,938
2,350
1,608
1,286
150
120
Guyana
2,197
1,758
1,243
994
191
153
Haiti
1,817
1,454
1,206
965
169
135
Nicaragua
2,553
2,042
2,183
1,747
126
101
Panama
3,891
3,113
1,596
1,277
168
134
Paraguay
3,439
2,752
2,179
1,743
117
94
Peru
2,830
2,264
698
558
104
83
Suriname
1,748
1,399
654
523
85
68
Trinidad and Tobago
7,266
5,813
1,456
1,165
124
99
U.S. Virgin Islands
3,837
3,070
1,949
1,559
117
94
Uruguay
9,361
7,489
2,244
1,795
86
69
Middle East and Africa
Afghanistan
1,350
1,080
870
696
261
209
Algeria
1,649
1,320
636
509
149
120
Angola
3,217
2,574
1,794
1,435
227
182
Bahrain
3,450
2,760
1,343
1,074
125
100
Cameroon
1,478
1,183
527
421
265
212
Cote D'Ivoire
2,079
1,663
1,222
977
134
107
Egypt
2,557
2,046
1,015
812
112
89
Ethiopia
4,172
3,338
4,099
3,279
176
141
Ghana
5,282
4,225
2,774
2,219
140
112
Iran
1,911
1,529
1,067
854
126
101
Iraq
2,876
2,301
2,930
2,344
110
88
Israel
11,973
9,579
1,450
1,160
74
59
Jordan
2,738
2,190
964
771
154
124
Kenya
4,183
3,346
2,971
2,377
154
123
Nigeria
2,403
1,922
1,693
1,354
274
220
Oman
4,363
3,491
1,486
1,189
128
102
Qatar
7,310
5,848
2,497
1,998
109
87
Rwanda
6,534
5,227
4,246
3,397
151
121
Saudi Arabia
1,239
991
892
714
515
412
Sudan
1,785
1,428
732
586
309
247
Syrian Arab Republic
1,411
1,129
587
469
251
201
Tanzania
2,318
1,854
1,696
1,357
179
143
Kuwait
7,303
5,842
3,628
2,902
117
94
Libyan Arab Jamahiriya
1,683
1,346
1,185
948
215
172
Madagascar
5,016
4,013
1,796
1,437
225
180
Mauritius
1,518
1,214
434
347
137
110
Morocco
3,942
3,154
485
388
124
100
Mozambique
2,246
1,797
1,126
901
169
135
Namibia
6,829
5,463
3,627
2,902
140
112
Tunisia
3,030
2,424
1,058
847
138
111
Uganda
3,733
2,986
2,660
2,128
186
149
Yemen
1,184
947
469
375
236
189
Zambia
2,292
1,834
2,006
1,605
272
218
Zimbabwe
3,778
3,022
3,293
2,635
171
137
Western Europe
Cyprus
7,204
5,763
1,337
1,070
71
57
Greece
7,299
5,839
1,145
916
73
58
Sweden
8,986
7,189
3,990
3,192
85
68
Cloud Prepared: Mobile
Tables 7 through 9 provide details on individual countries that are Cloud Prepared, from a mobile network perspective.
Table 7. Cloud-Prepared Countries: Overall (Consumer and Business) Mobile Networks
Region
Country
Avg. DL (kbps)
Median DL (kbps)
Avg. UL (kbps)
Median UL (kbps)
Avg. Latency (ms)
Median Latency (ms)
Asia Pacific
Hong Kong
12,947
8,107
10,987
4,702
90
32
Japan
10,019
6,202
8,027
2,149
139
100
Korea
10,764
8,081
10,477
6,260
206
151
New Zealand
11,763
7,259
4,997
986
86
45
Singapore
14,556
11,678
10,662
3,263
91
31
Solomon Islands
10,830
6,220
4,500
1,093
89
45
Central and Eastern Europe
Bulgaria
12,251
9,604
9,707
4,382
70
26
Georgia
10,698
6,010
9,652
4,396
79
22
Hungary
11,482
8,317
4,940
1,604
65
36
Latvia
11,230
6,669
9,145
2,557
80
31
Lithuania
12,190
8,216
11,384
6,026
76
24
Moldova
12,277
8,410
8,404
3,994
71
30
Romania
13,099
9,190
9,541
3,864
74
35
Ukraine
9,887
5,212
8,953
2,570
131
41
Middle East and Africa
United Arab Emirates
12,385
8,168
5,844
1,264
95
33
North America
Canada
11,849
8,948
3,974
1,558
102
49
Western Europe
Belgium
13,888
11,382
3,156
2,043
72
35
Denmark
16,681
10,493
7,953
2,571
64
38
Iceland
13,692
9,924
11,179
6,171
70
25
Luxembourg
12,845
8,270
7,004
1,187
68
40
Malta
11,171
8,951
1,717
1,028
61
30
Netherlands
16,412
13,774
6,307
3,909
56
28
Norway
12,514
8,731
8,198
3,557
94
44
Portugal
12,931
9,431
5,522
2,249
72
35
Sweden
11,665
7,803
7,164
2,343
95
53
Switzerland
13,863
10,469
4,151
2,239
75
41
Table 8. Cloud-Prepared Countries: Consumer Mobile Networks
Region
Country
Avg. DL (kbps)
Median DL (kbps)
Avg. UL (kbps)
Median UL (kbps)
Avg. Latency (ms)
Median Latency (ms)
Asia Pacific
Hong Kong
11,626
8,107
10,491
4,702
73
32
Japan
10,091
6,202
8,033
2,149
146
100
Korea
10,080
8,081
11,270
6,260
189
151
Mongolia
7,012
3,041
6,641
1,997
59
19
Singapore
13,440
11,678
10,299
3,263
75
31
Central and Eastern Europe
Bulgaria
11,300
9,604
9,247
4,382
57
26
Georgia
9,425
6,010
9,069
4,396
56
22
Hungary
10,388
8,317
4,463
1,604
55
36
Latvia
9,918
6,669
8,586
2,557
63
31
Lithuania
11,496
8,216
11,592
6,026
56
24
Moldova
11,307
8,410
7,975
3,994
57
30
Romania
11,662
9,190
8,943
3,864
62
35
Middle East and Africa
United Arab Emirates
11,371
8,168
5,452
1,264
67
33
Western Europe
Belgium
12,850
11,382
2,883
2,043
59
35
Denmark
11,852
10,493
6,471
2,571
70
38
Iceland
12,671
9,924
10,822
6,171
50
25
Luxembourg
11,538
8,270
6,337
1,187
57
40
Malta
10,319
8,951
1,546
1,028
51
30
Netherlands
15,576
13,774
6,103
3,909
45
28
Norway
11,284
8,731
7,787
3,557
79
44
Portugal
11,865
9,431
5,163
2,249
62
35
Sweden
10,199
7,803
6,584
2,343
87
53
Switzerland
12,510
10,469
3,951
2,239
62
41
Table 9. Cloud-Prepared Countries: Business Mobile Networks
Region
Country
Avg. DL (kbps)
Median DL (kbps)
Avg. UL (kbps)
Median UL (kbps)
Avg. Latency (ms)
Median Latency (ms)
Central and Eastern Europe
Bulgaria
12,251
9,717
9,707
4,467
70
26
Georgia
10,698
5,881
9,652
4,349
79
23
Latvia
11,230
6,663
9,145
2,616
80
31
Lithuania
12,190
7,718
11,384
4,143
76
27
Moldova
12,277
8,381
8,404
4,042
71
29
Middle East and Africa
Saudi Arabia
10,666
8,207
5,079
2,179
66
39
Western Europe
Denmark
16,698
17,915
9,758
8,640
35
27
Iceland
13,692
9,660
11,179
5,979
70
28
Cloud Emerging: Mobile
Tables 10 through 12 provide details on individual countries that are Cloud Emerging, from a mobile network perspective.
Table 10. Cloud-Emerging Countries: Overall (Consumer and Business) Mobile Networks
Region
Country
Avg. DL (kbps)
Median DL (kbps)
Avg. UL (kbps)
Median UL (kbps)
Avg. Latency (ms)
Median Latency (ms)
Asia Pacific
Australia
9,513
5,474
2,959
832
103
48
Bangladesh
812
488
1,041
178
337
222
Brunei Darussalam
2,321
998
1,389
487
173
67
Cambodia
2,438
1,561
2,502
886
376
89
China
4,548
2,589
2,368
691
179
77
Fiji
3,076
1,693
876
620
217
120
Guam
4,310
2,633
1,985
878
158
57
India
1,731
587
1,191
356
270
129
Indonesia
1,677
881
1,038
338
252
125
Malaysia
3,063
1,511
2,352
511
179
91
Maldives
1,884
986
1,147
440
331
127
Mongolia
6,992
3,041
6,169
1,997
117
19
Myanmar
663
240
743
241
306
115
Nepal
1,441
381
1,178
280
188
58
Philippines
2,388
988
1,288
412
279
152
Sri Lanka
2,339
1,380
829
441
292
172
Taiwan
9,664
6,241
3,675
975
91
48
Thailand
5,477
3,539
1,614
522
117
57
Vietnam
2,382
634
1,503
276
209
113
Australia
9,513
5,474
2,959
832
103
48
Bangladesh
812
488
1,041
178
337
222
Central and Eastern Europe
Albania
3,796
1,966
1,505
751
153
91
Armenia
6,347
2,949
4,363
1,249
131
64
Azerbaijan
3,673
2,738
1,891
829
151
79
Belarus
3,674
1,906
2,804
698
161
101
Bosnia and Herzegovina
4,233
2,950
995
495
107
63
Croatia
5,626
4,018
1,911
632
116
55
Czech Republic
9,069
6,349
5,340
2,203
76
34
Estonia
6,718
3,550
3,588
1,042
103
58
Macedonia
5,916
3,922
3,387
799
112
56
Montenegro
4,347
2,198
1,193
448
148
110
Poland
7,150
4,239
2,435
997
107
58
Russian Federation
8,761
4,561
8,474
2,295
135
51
Serbia
4,830
3,375
1,500
851
101
42
Slovakia
8,270
4,815
3,813
1,174
92
48
Slovenia
8,169
4,933
5,211
1,252
92
43
Tajikistan
3,611
2,175
1,964
632
133
79
Turkey
5,817
3,964
2,265
813
107
47
Uzbekistan
1,059
540
940
398
302
190
Latin America
Antigua and Barbuda
2,096
1,197
1,178
467
232
190
Argentina
3,014
1,488
949
488
231
96
Aruba
4,020
3,033
948
389
104
62
Bahamas
3,108
1,801
1,660
661
150
52
Barbados
3,310
2,350
1,149
672
122
41
Belize
2,057
1,070
814
637
113
59
Bermuda
4,379
2,906
2,494
1,724
164
121
Bolivia
885
501
486
187
482
392
Brazil
4,348
1,883
1,248
576
188
77
Cayman Islands
4,173
2,617
1,796
635
196
96
Chile
4,876
1,979
1,643
491
240
101
Colombia
2,861
1,950
1,316
636
173
78
Costa Rica
1,323
858
700
422
237
151
Dominican Republic
2,363
1,298
1,054
520
212
110
Ecuador
2,780
1,689
2,183
572
197
85
El Salvador
2,338
1,290
1,087
517
291
193
Guatemala
1,908
1,052
1,044
419
306
229
Haiti
2,025
1,149
1,097
404
240
146
Honduras
2,094
1,048
1,341
527
171
99
Jamaica
5,584
2,636
1,924
666
210
138
Mexico
5,613
3,148
4,510
704
124
67
Nicaragua
1,676
1,057
1,422
839
225
107
Panama
2,503
1,728
1,155
558
290
206
Paraguay
2,995
1,446
1,496
604
177
87
Peru
2,660
1,802
1,003
413
176
59
Puerto Rico
4,447
2,767
1,940
873
142
106
Suriname
1,346
975
715
414
113
30
Trinidad and Tobago
4,225
2,342
1,304
922
198
179
U.S. Virgin Islands
2,169
1,006
1,199
575
263
157
Uruguay
6,295
2,525
2,055
653
132
45
Venezuela
1,742
931
824
412
273
183
Middle East and Africa
Afghanistan
980
440
967
285
412
161
Algeria
769
510
521
219
268
120
Angola
2,661
1,010
1,865
435
231
80
Bahrain
3,073
1,564
1,072
493
154
77
Congo
656
416
450
311
684
790
Cote D'Ivoire
2,247
1,254
767
488
187
79
Egypt
1,328
784
627
272
186
87
Ghana
3,031
1,607
934
473
213
78
Iran
1,012
614
765
345
251
98
Iraq
2,771
912
2,369
674
144
42
Israel
5,673
3,052
1,338
831
119
82
Jordan
2,246
1,388
743
404
188
95
Kazakhstan
8,200
4,526
6,757
1,248
136
52
Kenya
3,009
1,111
1,737
500
299
161
Kuwait
9,065
5,009
3,272
1,822
103
38
Lebanon
1,467
688
540
273
161
61
Libyan Arab Jamahiriya
1,125
841
2,089
885
397
907
Madagascar
2,865
1,937
876
617
400
124
Mauritius
1,484
995
516
301
227
64
Morocco
2,859
1,808
520
286
172
91
Namibia
4,003
1,513
3,144
612
282
136
Nigeria
1,638
940
1,152
336
413
263
Oman
2,889
1,550
1,163
491
218
81
Pakistan
1,459
939
855
462
278
128
Qatar
6,656
2,111
2,847
879
165
67
Saudi Arabia
5,496
2,722
2,027
624
170
86
South Africa
3,671
1,819
1,621
521
145
56
Sudan
1,086
491
580
351
514
358
Syrian Arab Republic
899
451
410
242
281
123
Tanzania
1,510
679
1,113
360
417
317
Tunisia
2,553
1,700
1,050
734
219
151
Yemen
928
1,242
922
316
352
166
Zimbabwe
1,940
640
1,521
318
354
122
North America
United States
9,952
8,272
4,245
2,077
115
58
Western Europe
Austria
8,302
5,161
2,539
1,592
100
59
Cyprus
6,345
4,103
2,155
783
124
64
Finland
9,619
6,554
4,786
1,793
131
68
France
6,953
4,155
2,120
861
133
72
Germany
9,992
6,769
2,860
1,275
103
56
Greece
6,972
5,033
1,670
764
94
48
Ireland
8,098
4,060
2,433
963
125
64
Isle of Man
7,691
6,039
1,811
689
95
67
Italy
6,698
3,898
1,682
678
120
76
Spain
7,842
4,710
2,511
817
124
72
United Kingdom
11,341
6,815
3,662
1,297
87
48
Table 11. Cloud-Emerging Countries: Consumer Mobile Network
Region
Country
Avg. DL (kbps)
Median DL (kbps)
Avg. UL (kbps)
Median UL (kbps)
Avg. Latency (ms)
Median Latency (ms)
Asia Pacific
Australia
8,049
5,474
2,307
832
80
48
Bangladesh
589
488
857
178
312
222
Brunei Darussalam
1,633
998
856
487
141
67
Cambodia
2,060
1,561
2,295
886
178
89
China
3,846
2,589
2,166
691
148
77
Fiji
2,724
1,693
769
620
203
120
Guam
3,760
2,633
1,592
878
115
57
India
1,257
587
802
356
235
129
Indonesia
1,285
881
771
338
218
125
Malaysia
2,520
1,511
1,900
511
161
91
Maldives
1,430
986
705
440
318
127
Myanmar
496
240
607
241
266
115
Nepal
802
381
679
280
148
58
New Zealand
9,618
7,259
3,831
986
74
45
Philippines
1,643
988
803
412
263
152
Solomon Islands
9,407
6,220
3,936
1,093
82
45
Sri Lanka
1,978
1,380
738
441
279
172
Taiwan
9,364
6,241
3,748
975
72
48
Thailand
4,515
3,539
1,122
522
103
57
Vietnam
1,529
634
600
276
172
113
Central and Eastern Europe
Albania
3,144
1,966
1,226
751
133
91
Armenia
5,564
2,949
3,938
1,249
111
64
Azerbaijan
3,020
2,738
1,297
829
131
79
Belarus
2,666
1,906
1,601
698
143
101
Bosnia and Herzegovina
3,596
2,950
855
495
96
63
Croatia
4,523
4,018
1,219
632
99
55
Czech Republic
7,917
6,349
4,791
2,203
65
34
Estonia
5,609
3,550
3,118
1,042
85
58
Macedonia
5,056
3,922
2,412
799
100
56
Montenegro
3,257
2,198
1,032
448
143
110
Poland
6,028
4,239
2,107
997
92
58
Russian Federation
7,805
4,561
8,016
2,295
114
51
Serbia
4,258
3,375
1,291
851
87
42
Slovakia
6,988
4,815
3,400
1,174
80
48
Slovenia
6,944
4,933
4,330
1,252
74
43
Tajikistan
3,030
2,175
1,483
632
107
79
Turkey
4,939
3,964
1,820
813
96
47
Ukraine
8,516
5,212
8,042
2,570
108
41
Uzbekistan
833
540
760
398
285
190
Latin America
Antigua and Barbuda
1,507
1,197
770
467
217
190
Argentina
2,337
1,488
807
488
211
96
Aruba
3,600
3,033
660
389
98
62
Bahamas
2,468
1,801
1,149
661
133
52
Barbados
3,127
2,350
896
672
92
41
Belize
1,760
1,070
707
637
99
59
Bermuda
4,379
2,906
2,494
1,724
164
121
Bolivia
686
501
332
187
454
392
Brazil
3,678
1,883
993
576
159
77
Cayman Islands
3,617
2,617
1,548
635
166
96
Chile
3,939
1,979
1,252
491
207
101
Colombia
2,425
1,950
988
636
146
78
Costa Rica
1,082
858
568
422
225
151
Dominican Republic
1,918
1,298
876
520
193
110
Ecuador
2,214
1,689
1,950
572
167
85
El Salvador
1,686
1,290
902
517
266
193
Guatemala
1,560
1,052
849
419
286
229
Haiti
1,732
1,149
887
404
224
146
Honduras
1,714
1,048
902
527
152
99
Jamaica
3,473
2,636
1,195
666
209
138
Mexico
4,662
3,148
1,744
704
110
67
Nicaragua
1,288
1,057
1,097
839
202
107
Panama
1,951
1,728
900
558
282
206
Paraguay
2,311
1,446
1,125
604
162
87
Peru
2,267
1,802
767
413
137
59
Puerto Rico
3,622
2,767
1,717
873
135
106
Suriname
1,173
975
588
414
81
30
Trinidad and Tobago
3,586
2,342
1,173
922
186
179
U.S. Virgin Islands
1,739
1,006
868
575
237
157
Uruguay
5,333
2,525
1,878
653
105
45
Venezuela
1,221
931
760
412
256
183
Middle East and Africa
Afghanistan
749
440
786
285
330
161
Algeria
570
510
351
219
203
120
Angola
1,930
1,010
1,246
435
193
80
Bahrain
2,106
1,564
757
493
129
77
Egypt
1,029
784
449
272
174
87
Ghana
2,639
1,607
820
473
177
78
Iran
889
614
579
345
208
98
Iraq
1,887
912
2,064
674
129
42
Israel
4,150
3,052
1,144
831
115
82
Jordan
1,863
1,388
638
404
163
95
Kazakhstan
7,187
4,526
5,927
1,248
117
52
Kenya
2,386
1,111
1,347
500
277
161
Kuwait
8,129
5,009
3,185
1,822
78
38
Lebanon
1,066
688
486
273
146
61
Mauritius
1,319
995
451
301
152
64
Morocco
2,496
1,808
500
286
149
91
Namibia
3,083
1,513
2,424
612
229
136
Nigeria
1,299
940
853
336
378
263
Oman
2,220
1,550
790
491
185
81
Pakistan
1,251
939
700
462
228
128
Qatar
5,214
2,111
2,351
879
128
67
Saudi Arabia
4,147
2,722
1,438
624
156
86
South Africa
2,921
1,819
1,275
521
123
56
Sudan
879
491
584
351
484
358
Syrian Arab Republic
676
451
355
242
259
123
Tanzania
1,003
679
816
360
388
317
Tunisia
2,209
1,700
980
734
209
151
North America
Canada
10,777
8,948
3,500
1,558
91
49
United States
9,942
8,272
4,250
2,077
97
58
Western Europe
Austria
6,925
5,161
2,239
1,592
88
59
Cyprus
5,379
4,103
1,575
783
109
64
Finland
9,630
6,554
4,917
1,793
94
68
France
5,584
4,155
1,585
861
123
72
Germany
8,848
6,769
2,663
1,275
85
56
Greece
5,896
5,033
1,135
764
81
48
Ireland
6,858
4,060
2,190
963
106
64
Italy
4,643
3,898
1,265
678
108
76
Spain
6,469
4,710
1,976
817
112
72
United Kingdom
10,228
6,815
3,358
1,297
75
48
Table 12. Cloud-Emerging Countries: Business Mobile Network
Region
Country
Avg. DL (kbps)
Median DL (kbps)
Avg. UL (kbps)
Median UL (kbps)
Avg. Latency (ms)
Median Latency (ms)
Asia Pacific
Brunei Darussalam
2,321
994
1,389
489
173
70
Cambodia
2,438
1,474
2,502
878
376
93
Fiji
3,076
1,684
876
652
217
123
Japan
6,005
4,915
3,482
2,027
118
80
Nepal
1,441
375
1,178
288
188
61
Sri Lanka
2,339
1,380
829
448
292
183
Taiwan
4,110
3,781
640
601
110
75
Central and Eastern Europe
Albania
3,796
1,967
1,505
730
153
90
Armenia
6,347
2,952
4,363
1,297
131
65
Bosnia and Herzegovina
4,233
2,948
995
502
107
63
Estonia
6,718
3,566
3,588
1,052
103
57
Macedonia
5,916
3,922
3,387
800
112
57
Montenegro
4,347
2,197
1,193
454
148
109
Serbia
4,830
3,378
1,500
847
101
42
Tajikistan
3,611
2,034
1,964
653
133
82
Uzbekistan
1,059
563
940
424
302
187
Latin America
Antigua and Barbuda
2,096
1,269
1,178
474
232
190
Aruba
4,020
2,973
948
391
104
63
Bahamas
3,108
1,811
1,660
668
150
56
Bermuda
4,379
2,906
2,494
1,724
164
121
Bolivia
885
499
486
208
482
395
El Salvador
2,338
1,292
1,087
517
291
192
Haiti
2,025
1,187
1,097
430
240
144
Jamaica
5,584
3,050
1,924
815
210
110
Nicaragua
1,676
1,092
1,422
838
225
113
Panama
2,503
1,742
1,155
578
290
200
Paraguay
2,995
1,434
1,496
608
177
88
Peru
2,660
1,742
1,003
415
176
63
Trinidad and Tobago
4,225
2,335
1,304
939
198
175
U.S. Virgin Islands
2,169
1,008
1,199
585
263
170
Uruguay
6,295
2,513
2,055
659
132
46
Venezuela
1,121
842
267
256
386
348
Middle East and Africa
Afghanistan
980
429
967
294
412
194
Algeria
769
499
521
220
268
137
Angola
2,661
969
1,865
447
231
80
Congo
656
404
450
308
684
790
Cote D'Ivoire
2,247
1,260
767
488
187
85
Ghana
3,031
1,550
934
444
213
98
Iran
405
306
247
188
399
269
Kazakhstan
8,200
4,352
6,757
1,285
136
58
Kenya
3,009
1,049
1,737
513
299
187
Kuwait
1,959
1,716
563
439
175
77
Madagascar
2,865
1,113
876
478
400
145
Mauritius
1,484
955
516
305
227
72
Namibia
4,003
1,492
3,144
619
282
139
Nigeria
1,638
922
1,152
345
413
265
Syrian Arab Republic
899
459
410
253
281
120
Tanzania
1,510
679
1,113
375
417
326
Zimbabwe
1,940
609
1,521
318
354
137
North America
United States
4,538
2,844
2,494
1,074
228
161
Western Europe
Finland
8,246
5,563
2,714
1,691
121
95
Germany
4,549
4,773
1,518
1,351
129
88
Isle of Man
7,691
6,030
1,811
689
95
67
Sweden
5,029
4,258
963
1,066
123
89
United Kingdom
2,381
1,576
1,313
622
324
209
Top Performers
Tables 13 and 14 highlight the countries with the top fixed and mobile network performance in 2013. Seven out of ten countries are in both the fixed and mobile network top-performer categories.
Table 13. Countries with Leading Fixed Network Performance (Top 10) in 2013 (Listed in Alphabetical Order)
Country
Download (kbps)
Upload (kbps)
Latency (ms)
Bulgaria
21,050
13,070
34
Hong Kong
33,340
24,009
38
Iceland
23,348
15,838
34
Japan
26,494
14,731
64
Korea
28,840
24,347
52
Lithuania
27,377
21,355
46
Netherlands
25,333
8,000
33
Romania
24,335
14,320
42
Singapore
27,765
16,565
38
Switzerland
29,160
4,607
33
Table 14. Countries with Leading Mobile Network Performance (Top 10) in 2013 (Listed in Alphabetical Order)
Country
Download (kbps)
Upload (kbps)
Latency (ms)
Bulgaria
12,251
9,707
70
Denmark
16,681
7,953
64
Hong Kong
12,947
10,987
90
Iceland
13,692
11,179
70
Lithuania
12,190
11,384
76
Luxembourg
12,845
7,004
68
Moldova
12,277
8,404
71
Netherlands
16,412
6,307
56
Romania
13,099
9,541
74
Singapore
14,556
10,662
91
Most Improved
Tables 15 and 16 provide details about the countries with the most improved fixed and mobile network performance from 2012 to 2013.
Table 15. Countries with the Most Improved Fixed Network Performance from 2012 to 2013
Country
Improvement (Y/Y)
Bangladesh
58%
Brunei Darussalam
50%
Cambodia
48%
China
69%
Denmark
45%
Georgia
123%
Iran
63%
Iraq
56%
Kazakhstan
123%
Kuwait
121%
Lebanon
96%
Luxembourg
51%
Mexico
48%
Mongolia
107%
Morocco
53%
Nepal
92%
Paraguay
117%
Switzerland
64%
Tunisia
54%
Uruguay
143%
Table 16. Countries with the Most Improved Mobile Network Performance from 2012 to 2013
Country
Improvement Y/Y
Brazil
290%
China
233%
Denmark
401%
Hong Kong
479%
Japan
495%
Korea
458%
Kuwait
253%
Mexico
280%
Netherlands
582%
Norway
419%
Portugal
262%
Romania
342%
Russian Federation
528%
Singapore
496%
Switzerland
387%
Taiwan
523%
Ukraine
618%
United Arab Emirates
248%
United Kingdom
288%
United States
252%
Conclusion
In general, fixed networks offer better upload and download speeds and latencies than mobile networks. However, the gap in performance between fixed and mobile networks is rapidly narrowing. Given the growing global adoption of advanced mobile technologies, such as third- and fourth-generation (3G and 4G) Long Term Evolution (LTE), and the worldwide demand for wireless support of next-generation devices such as tablets, e-readers, and smartphones, we expect the performance gap between fixed and mobile networks to continue to narrow over the next few years.
From an individual country perspective, several countries have average network performance characteristics that are significantly higher than that of their region. Although an increasing number of countries are currently able to support advanced cloud services, these countries will promote significantly greater cloud traffic growth rates due to the high-bandwidth services than can be offered over their networks (for example, high-definition video streaming).
From a business cloud services perspective, many networks are currently capable of supporting intermediate business applications (such as enterprise resource planning, customer resource management, and basic videoconferencing) and some are currently capable of supporting advanced business applications (such as high-definition video and audio conferencing). With the necessary infrastructure in place, businesses and enterprises of all sizes can effectively implement these productivity-enhancing applications and communications services.
Appendix A: Individual Country Speed Test Analysis
Six countries from six regions were used to display the variation of download speeds within a country. No specific criteria were used in the selection of a country. Selection was random. More frequent occurrences of lower speeds experienced by the end user result in issues with being able to use the basket of applications available to them. Alternatively, users may choose to use a basic or smaller set of applications. The mean speeds represent the overall average of the speed tests within each country. The median represents the midpoint of the speed tests. Large variations between the mean and the median represent a skew in the distribution of speeds. Some countries also display various peaks in download speeds.
North America Speed Test Distribution Country Spotlight: United States
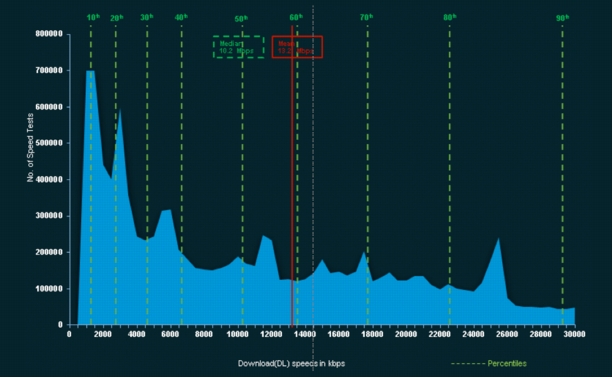
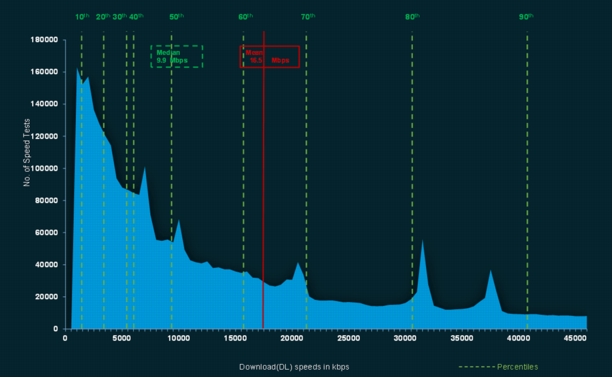
Figure 1 depicts the distribution of download speed tests around the mean/average or median. There are more frequent occurrences of lower download speeds of 1.3 Mbps to 4.3 Mbps, which are between the tenth through thirtieth percentile. This is offset by a wider distribution of faster download speeds beyond the mean with the ninetieth percentile representing 29 Mbps. The difference between the mean (the average) and the median speeds is 3 Mbps.
Figure 1. Download Speed Distribution Curve: United States
Source: Cisco Global Cloud Index, 2013
Latin America Speed Test Distribution Country Spotlight: Mexico
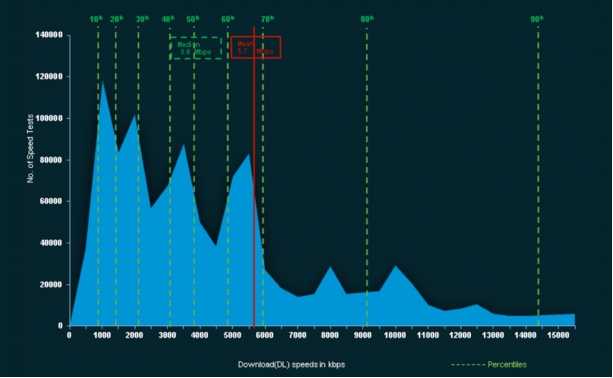
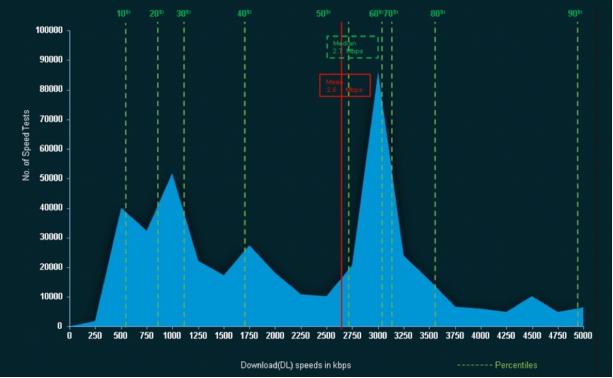
Figure 2 depicts the distribution of download speed tests around the mean/average and the median in Mexico. The majority of the speeds are between 868 kbps to 2.1 Mbps (tenth and thirtieth percentile), and there are fewer speed test records around the eightieth to ninetieth percentile range, which is 9.2 Mbps and 14.3 Mbps. There is a wider distribution of higher speeds beyond the sixtieth percentile. The difference between the mean (average) and the median speeds is 2 Mbps.
Figure 2. Download Speed Distribution Curve: Mexico
Source: Cisco Global Cloud Index, 2013
Asia-Pacific Speed Test Distribution Country Spotlight: China
Figure 3 depicts the distribution of download speeds around the mean/average and median in China. The most frequent occurrences of speeds are between 1.3 Mbps and 2.9 Mbps (tenth through the thirtieth percentile), and there are fewer speed test records around the eightieth to ninetieth percentile range (11.4 Mbps to17.3 Mbps). The distribution has a long tail of high speeds beyond the sixtieth percentile. The difference between the mean (average) and the median speeds is nearly 2.5 Mbps.
Figure 3. Download Speed Distribution Curve: China
Source: Cisco Global Cloud Index, 2013
Central and Eastern Europe Speed Test Distribution Country Spotlight: Russia
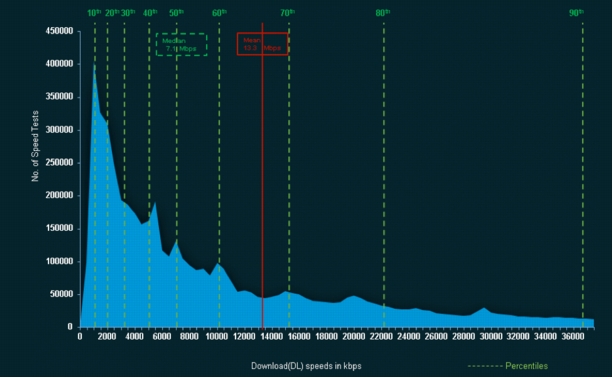
Figure 4 depicts the distribution of download speeds around the mean/average and median in Russia. The largest occurrences of speeds are between 1.1 Mbps and 3.3 Mbps which are the tenth to thirtieth percentiles, and there are fewer speed test records around the 22.4 and 36.6 Mbps (eightieth to ninetieth percentile) range. The distribution has long tail of higher speeds beyond the sixtieth percentile. The difference between the mean (average) and the median speeds is nearly 6.5 Mbps.
Figure 4. Download Speed Distribution Curve: Russia
Source: Cisco Global Cloud Index, 2013
Western Europe Speed Test Distribution Country Spotlight: United Kingdom
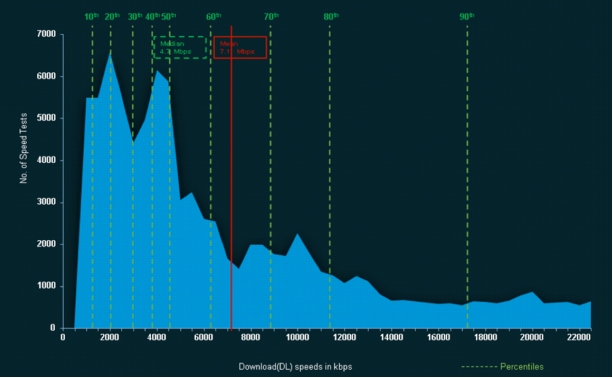
Figure 5 depicts the distribution of download speed tests around the mean/average and median in the United Kingdom. The largest occurrences of speeds are between 1.7 Mbps and 4.8 Mbps (tenth to thirtieth percentiles), and there are fewer speed test records between 30.7 Mbps to 41.8 Mbps (eightieth to ninetieth percentile). There is a longer distribution of higher speeds beyond the sixtieth percentile. The difference between the mean or average speeds and the median is nearly 7 Mbps, the largest difference in the samples represented in Appendix A.
Figure 5. Download Speed Distribution Curve: United Kingdom
Source: Cisco Global Cloud Index, 2013
Middle East and Africa Speed Test Distribution Country Spotlight: South Africa
Figure 6 depicts the distribution of download speed tests around the mean/average and median in South Africa. Unlike the prior graphs, where the largest occurrences of speeds were between the tenth to thirtieth percentiles, the majority of the download speeds occur here between 2.3 Mbps to 4.5 Mbps (fiftieth to the eightieth percentiles). The mean (average) download speed is almost at par with the median.
Figure 6. Download Speed Distribution Curve: South Africa
Source: Cisco Global Cloud Index, 2013
1Measured by Speedtest.net, small binary files are downloaded and uploaded between the web server and the client to estimate the connection speed in kbps.