Performance monitor is a Cisco IOS® Software feature that, measures user traffic performance, generates alerts based on thresholds, and reports through multiple management interfaces.
Mediatrace is a Cisco IOS Software feature that discovers the routers and switches along the path of an IP flow. Mediatrace can dynamically configure and retrieve general node information as well as flow-specific metrics leveraging the performance monitor feature.
This document is a guide for quickly getting started with the Cisco IOS Software performance monitor and mediatrace video monitoring features for Medianet1. This document can be utilized in two different ways. It can be read without attempting any configuration, sample configurations and output have been included so that you may gain understanding of the feature set. The document also assumes that you may want to run a proof of concept or for learning purposes in a lab environment before deployment in a production environment and equipment requirements have been included as a starting point for such endeavors.
Lab Exercises-Equipment Requirements
Table 1 lists the minimum requirements for equipment, topology, and management systems. Implementors can freely add network nodes and end systems to align with their environments and needs.
Table 1. Basic Equipment Requirements
Item
Quantity
Notes
Cisco IOS Software router or switch with performance monitor and mediatrace software
2
Currently, these features are available on the Cisco® routers and switches. To learn the exact platforms and requirements that support these features, please check the medianet datasheet.
Traffic impairment device
1
A general x86 PC can be used with a free Cisco WAN-Bridge Live-CD1. For more complex and custom impairments, refer to Linux netem network emulation documentation2.
Real-Time Transport Protocol (RTP) and TCP traffic generator and sink
• 1 generator
• 1 sink
The generator and sink are used to generate and receive traffic for both mediatrace and performance monitor to monitor.
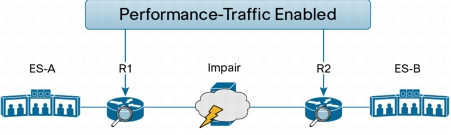
Figure 1 shows the most basic topology that will be needed for a quick start implementation. In the topology, note that, the two monitoring points (R1 and R2) are on either side of the impairment device. This arrangement allows the monitoring points to provide before and after impairment perspectives. The management devices (syslog, SNMP, etc.) and infrastructure items such as the Cisco Unified Communications Manager and the authentication, authorization, and accounting (AAA) server are not shown in the topology because their exact location is not important, and only IP connectivity is required.
Figure 1. Basic Topology
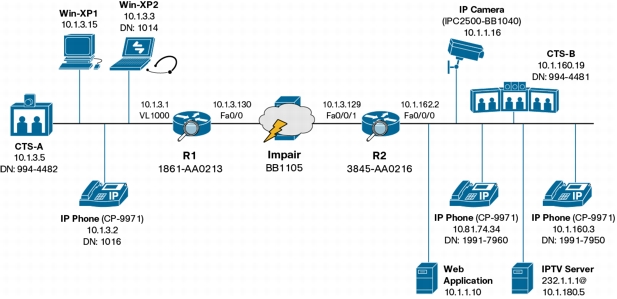
For the purpose of providing a variety of tangible examples, the basic topology has been augmented with multiple end systems, as shown in Figure 2. The IP addressing and dial numbers shown in the figure match the examples used in this document. The basic configurations for the routers can be found in Appendix A.
Figure 2. Test Topology
Performance Monitor
The performance monitor performs measurements on a specified set of traffic that is traversing a single router. The measurement point can be in a particular direction (ingress or egress) and on specific interfaces. By comparing the results of multiple measurement points, it is possible to create a storyline of the flow's progress within the network. In Figure 1, with R1 reporting 0 percent loss for the Cisco TelePresence System flow, and R2 reporting 10 percent loss for the same flow, the operator could conclude that there is a problem in between R1 and R2. Alternatively, had both R1 and R2 reported no loss, the network operator would have verified that there is no packet loss in the span between R1 and R2.
A performance monitor deployment should consider the following elements:
• What traffic: Which applications and traffic should be monitored and shown within the network?
• What information: What information should be gathered about the traffic flows?
• Where to monitor: Which routers and switches will have measurement points? On a router, which interface and in which direction will the measurement occur?
• Service targets: Does traffic need to be measured against any specific service-level agreements (SLAs)?
• Where to send information: How will the flow metrics be made available to network management software?
IOS Netflow and NBAR for high level traffic monitoring
The performance monitor configuration model allows sets of traffic to be matched with specific measurements and alerting actions. The network operator should work in collaboration with the application owners to choose traffic selection criteria, decide what items to monitor, and specify alarm conditions. A cycle of application discovery may be needed to choose traffic selection criteria, or even to discover which applications have a network footprint and whether their performance is important to measure.
Here, we illustrate a combination of Cisco IOS NetFlow and Software Network-Based Application Recognition (NBAR) is used to initially discover the traffic flows in the topology represented in Figure 2 to aid in the traffic selection configuration. Flexible NetFlow has been configured with the NBAR option on R1 as shown in Figure 3.
Netflow has been used to obtain general statistics that identify what types of traffic exist on the network. In the next section performance monitor is used to gather more detailed statistics for media sessions.
Figure 3. Traffic Discovery with Flexible NetFlow Configuration
flow record discovery
match ipv4 dscp
match ipv4 protocol
match ipv4 source address
match ipv4 destination address
match transport source-port
match transport destination-port
match interface input
collect ipv4 source mask
collect ipv4 destination mask
collect transport tcp flags
collect interface output
collect counter bytes
collect counter packets
collect timestamp sys-uptime first
collect timestamp sys-uptime last collect application name
!
flow monitor discovery
record discovery
cache timeout active 60
!
interface Vlan1000
ip flow monitor discovery input
!
interface FastEthernet0/0
ip flow monitor discovery input
!
After applying this configuration, you can see the traffic that is traversing R1 and various identifying parameters such as differentiated services code point (DSCP) values, IP protocol type (TCP or UDP), and port ranges (Figure 4). Identifying markers that allow you to name applications is an important part of application profiling. For example, you can see that the Cisco TelePresence traffic is marked as DSCP 0x20 (CS4), and the video phone traffic is marked as 0x22 (AF41).
Figure 4. Output of Flexible NetFlow Cache (Truncated for Readability)
1861-AA0213#show flow monitor discovery cache format table
IPV4 SRC ADDR IPV4 DST ADDR TRNS SRC PORT TRNS DST PORT INTF INPUT IP DSCP IP PROT intf output app name
To create monitoring criteria, the interesting traffic needs to be described to the performance monitor. The description can be in many forms, including application names using Cisco IOS Network Based Application Recognition (NBAR, access-control lists (ACLs) composed of IP addresses and Layer 4 port numbers, and Differentiated Services Code Point (DSCP) values.
Performance monitor-Inline Configuration Method
Performance monitor allows two major methods of configuration; these follow the same model but provide different balances between flexibility and simplified configuration. The configuration in Figure 5 uses the inline method, employing a default metric collection profile.
Figure 5. Inline Configuration Example
interface FastEthernet0/0
service-policy type performance-monitor inline input
match dscp cs5 cs4 af41 ef
flow monitor inline
record default-rtp
react 1 transport-packets-lost-rate
threshold value gt 10.00
alarm severity error
action syslog
Even this simple configuration can be divided into the five deployment elements mentioned earlier, as shown in Table 2.
Table 2. Details of Inline Configuration Example
Deployment Element
Configuration
Note
What traffic?
match dscp cs5 cs4 ef af41
All traffic that is marked with DSCP EF or AF41 will be subject to measurement.
What information?
flow monitor inline
record default-rtp
The default-rtp record defines best practice metrics for collecting RTP traffic. In this example, EF (voice over IP [VoIP]), CS5 (IP video camera), CS4 (Cisco TelePresence), and AF41 (video conferencing) traffic are using RTP packet formatting.
The flow record is the only mandatory configuration in the inline configuration model. All other items have defaults.
Where to measure?
Interface FastEthernet0/0
service-policy type performance-traffic inline input
The policy is applied in the input direction on FastE0/0, and it is from this perspective that the matching and measurements will occur.
What service targets?
react 1 rtp-lost-fraction
threshold value gt 10.00
alarm severity error
action syslog
[Optional]
One of the metrics collected by default-rtp is the rtp-lost-fraction value. The react code creates a threshold that will declare a severity-level error alarm and generate a syslog if the RTP loss is greater than 10%.
Where to send information?
action syslog
A NetFlow exporter may have been configured under the monitor stanza. However, no periodic export method is configured in this example.
If a syslog server is configured, then the alert will be sent when the alarm is triggered as well as when it is cleared (for example, here the alarm is triggered when the rtp-lost-fraction value exceeds 10%, and the alarm is cleared when it falls below 10% again).
Additionally, a MIB is available for polling flow statistics and alerts.
Two prepackaged flow records are shipped with the performance monitor: default-rtp and default-tcp. The default-rtp record is shown in Figure 6.
Figure 6. Detail of Prepackaged default-rtp Flow Record
1861-AA0213#show flow record type performance-monitor default-rtp
Load for five secs: 43%/39%; one minute: 39%; five minutes: 35%
Time source is NTP, 21:59:41.106 EST Tue Mar 1 2011
flow record type performance-monitor default-rtp:
Description: VM default RTP record
No. of users: 6
Total field space: 98 bytes
Fields:
match ipv4 protocol
match ipv4 source address
match ipv4 destination address
match transport source-port
match transport destination-port
match transport rtp ssrc
collect routing forwarding-status
collect ipv4 dscp
collect ipv4 ttl
collect transport packets expected counter
collect transport packets lost counter
collect transport packets lost rate
collect transport event packet-loss counter
collect transport rtp jitter mean
collect transport rtp jitter minimum
collect transport rtp jitter maximum
collect interface input
collect interface output
collect counter bytes
collect counter packets
collect counter bytes rate
collect counter packets dropped
collect timestamp interval
collect application media bytes counter
collect application media bytes rate
collect application media packets counter
collect application media packets rate
collect application media event
collect monitor event
Basic Observation of Traffic
In the test network for CS4, CS5, EF, and AF41, the set of RTP video traffic listed in Table 3 is traversing R1.
Table 3. Comparison of RTP Statistics Between R2 and R1
DSCP
Traffic
EF
Voice-only traffic
CS4
Cisco TelePresence audio and video
CS5
IPTV (not RTP based), video surveillance RTP stream, and video surveillance TCP stream.
AF41
Video telephony and conferencing
Performance traffic can now discover and measure the performance of the voice and video flows coming into R1 on FastE0/0. Note that in the case of DSCP CS5 traffic, some traffic flows do not use the RTP format.
The operator can display the results of the traffic analysis in a variety of ways using different sets of filters. To see traffic analysis of the set of traffic from the CP-7985 to the soft phone, the operator can query the system based on the IP addresses.
Figure 7. Measurements for Traffic Coming from Video Phone
1861-AA0213#show performance monitor status ip 10.1.160.3/32 any
Load for five secs: 39%/37%; one minute: 42%; five minutes: 40%
Time source is NTP, 22:11:49.715 EST Tue Mar 1 2011
*application media bytes rate per flow (Bps) : 8989
*application media bytes rate per flow min (Bps) : 8850
*application media bytes rate per flow max (Bps) : 9006
application media packets rate (pps) : 49
application media event : Normal
*transport rtp flow count : 10
transport rtp jitter mean (usec) : 955
transport rtp jitter minimum (usec) : 0
transport rtp jitter maximum (usec) : 5225
*transport rtp payload type : 0
transport event packet-loss counter : 0
*transport event packet-loss counter min : 0
*transport event packet-loss counter max : 0
transport packets expected counter : 14982
transport packets lost counter : 0
*transport packets lost counter minimum : 0
*transport packets lost counter maximum : 0
transport packets lost rate ( % ) : 0.00
*transport packets lost rate min ( % ) : 0.00
*transport packets lost rate max ( % ) : 0.00
...
In the show performance monitor status output, the statistics are organized into sections according to the measurement layer. Because the IP phone is sending voice and video, you see two RTP flows,SSRC=11600626 and SSRC=12649152. The phone is sending audio over a well-known payload type,(PT=0 is PCMU2, so you can identify which flow is audio and which flow is video (PT=97 is video in this case). RTP statistics are being collected and the traffic happens to be RTP, packet loss and jitter are collected. Specifically, you can see that the video flow has incurred several packet losses, and the audio flow has none.
To see the traffic matching statistics and applied policies, use the show policy-map type performance-monitor command structure. Note the match statements and match rate for the inline policy (Figure 8).
Figure 8. The show policy-map type performance-monitor Traffic for Inline Configuration Example
1861-AA0213#show policy-map type performance-monitor interface fastEthernet 0/0
Load for five secs: 39%/37%; one minute: 39%; five minutes: 41%
Time source is NTP, 22:28:39.349 EST Tue Mar 1 2011
FastEthernet0/0
Service-policy performance-monitor input: inline
Class-map: inline (match-any)
2221087 packets, 2170027639 bytes
30 second offered rate 10970000 bps, drop rate 0 bps
Match: dscp cs4 (32) af41 (34) cs5 (40) ef (46)
2221087 packets, 2170027639 bytes
30 second rate 10970000 bps
media-monitoring:
flow monitor inline
record default-rtp
monitor parameters
interval duration 30
timeout 10
history 10
flows 8000
monitor metric rtp
min-sequential 5
max-dropout 5
max-reorder 5
clock-rate default 90000
ssrc maximum 5
react 1 transport-packets-lost-rate
threshold value gt 10.00
alarm type discrete
alarm severity error
action syslog
Class-map: class-default (match-any)
18200 packets, 1770469 bytes
30 second offered rate 4000 bps, drop rate 0 bps
Match: any
Measurement Intervals
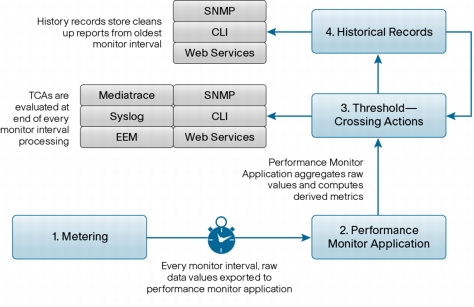
The performance monitor posts measurements in regularly spaced monitor intervals. The default monitor interval is 30 seconds, but the interval can be changed on a per-class basis. As shown in Figure 9, at the end of each monitor interval, the measurements can be aggregated and then evaluated against configured thresholds. If NetFlow export is configured, the information is then sent to the NetFlow collector. Finally, the information is added to the historical interval database. Up to 60 monitor intervals can be stored on the router. The number of monitor intervals is also configurable, with the default being 10 intervals. Information about the monitor intervals is available through the command-line interface (CLI), Cisco IOS Web Services Management Agent (WSMA)3, and a MIB4.
Figure 9. Performance Monitor Information Flow
The historical data can be accessed using the show performance monitor history command structure as shown in Figure 10. By default, this command gives information from the latest historical interval. With the interval option, all stored intervals can be displayed.
Figure 10. The show Output for Historical Intervals for a Specific RTP Flow
1861-AA0213#show performance monitor history interval all ssrc 7078506
Load for five secs: 53%/50%; one minute: 44%; five minutes: 42%
Time source is NTP, 22:38:49.582 EST Tue Mar 1 2011
Codes: * - field is not configurable under flow record
NA - field is not applicable for configured parameters
*transport packets lost counter maximum : 0 0 3 0 0 0
transport packets lost rate ( % ) : 0.00 0.00 0.33 0.00 0.00 0.00
*transport packets lost rate min ( % ) : 0.00 0.00 0.33 0.00 0.00 0.00
*transport packets lost rate max ( % ) : 0.00 0.00 0.33 0.00 0.00 0.00
Lab evaluation-Impairment
In these examples the lab setup utilized NETEM for injecting errors into the path to better illustrate how performance monitoring functions. This section documents the specific NETEM configuration used for these examples and is optional. The policy shown in Figure 3 is also applied to R1, and the impairment device (netem) is configured to delay packets by 100 milliseconds (ms) and introduce a jitter of 50 ms and a loss of 15 percent (Figure 11).
Figure 11. The netem Command on a Linux PC to Impair Traffic Exiting eth1.3514
If we compare the metrics side by side, it is obvious that there is problem in between R2 and R1, as shown in Table 4, with the results shown in Figure 15.
Table 4. Comparison of RTP Statistics Between R2 and R1
R2
R1
transport packets lost rate ( % ) : 14.38
transport packets lost rate ( % ) : 0.00
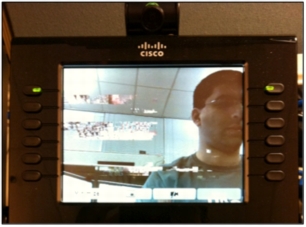
Figure 15. Effects of Packet Drops on Video Conferencing Unit behind R1
Thresholds and Alarms
The policy (Figure 3) applied in the network included a threshold set to trigger an alarm and report it through syslog if the loss exceeded 10 percent. With the impairment, this threshold has certainly been crossed (see the transport packets lost rate values in), and syslog messages are generated as shown in Figure 16. The TCA RAISE keyword in the message indicates the creation of a threshold-crossing alarm (TCA).
Figure 16. Alarm Declared on the Basis of Loss Percentage
Mar 2 00:04:15.932: %PERF_TRAFFIC_REACT-3-ERRSET: TCA RAISE.
Detailed info: Threshold value crossed - current value 15.14%
Flow info: src ip 10.81.74.34, dst ip 10.1.3.2
src port 20310, dst port 30308
ssrc 723756496
Policy info: Policy-map inline, Class inline, Interface FastEthernet0/0, Direction input
React info: id 1, criteria transport-packets-lost-rate, severity error, alarm type discrete, threshold range (10.00%, 100.00%]
When the impairment is removed, as shown in Figure 17, the alarm is cleared as well. The TCA CLEAR keyword indicates the clearing of an existing alarm (Figure 18). A history of the measurements is available in the historical intervals records, and the record of the alarm is available through syslog.
Figure 17. The netem Command on a Linux PC to Fix Impairment of Traffic Exiting eth1.3514
tc qdisc add dev eth1.3514 root netem delay 0ms 0ms distribution normal loss 0% limit 30000
Figure 18. Alarm Cleared by Removing the Impairment
Mar 2 00:05:45.984: %PERF_TRAFFIC_REACT-3-ERRCLEAR: TCA CLEAR.
Detailed info: Threshold value crossed - current value 0.00%
Flow info: src ip 10.81.74.34, dst ip 10.1.3.2
src port 20310, dst port 30308
ssrc 723756496
Policy info: Policy-map inline, Class inline, Interface FastEthernet0/0, Direction input
React info: id 1, criteria transport-packets-lost-rate, severity error, alarm type discrete, threshold range (10.00%, 100.00%]
Flexible Traffic Selection and Policies
Performance monitor can take measurements based on very specific classes of traffic. The Cisco Common Classification Policy Language5 (C3PL) is used for configuring performance monitoring policy, and the class-map6 structure is used describe which traffic to monitor. This infrastructure allows the operator to select traffic based on combinations of Layer 3 and Layer 4 fields, DSCP values, deep packet inspection values, and many other criteria. Figure 19 shows several examples of class maps that use different methods to match various types of traffic. Class maps are also used to describe traffic for quality-of-service (QoS) policies. The class maps created for QoS can be reused by the performance monitor.
Figure 19. Class-Map Examples
class-map match-all voip
match protocol rtp audio
!
class-map match-all DSCP-CS5
match dscp cs5
!
class-map match-all DSCP-EF
match dscp ef
!
class-map match-all voip-dpi
match protocol rtp audio
!
class-map match-all telepresence-dpi
match protocol telepresence-media
!
class-map match-all IPVS-traffic
match ip dscp cs5
match access-group name fromIPVScamera
!
ip access-list extended fromIPVScamera
permit ip host 10.1.160.28 any
The class maps determine what traffic is monitored, but the measurements themselves are determined by the flow records. The performance monitor flow record is an extension of the flow records available through the Flexible NetFlow (FNF) feature7. The flow records allow specific metrics to be collected and data aggregation policies to be configured. This same record definition is used to organize the information into NetFlow exports for the NetFlow collector.
There are two built-in performance monitor flow records. However, operators may want to create their own records, mixing, adding, and deleting metrics as necessary. Figure 20 shows the two default flow records, and Figure 21 shows the configuration of a completely new performance monitor flow record.
Figure 20. Configuration of a Custom Performance Monitor Flow Record
3845-AA0216#show flow record type performance-monitor default-tcp
flow record type performance-monitor default-tcp:
Description: VM default TCP record
No. of users: 2
Total field space: 66 bytes
Fields:
match ipv4 protocol
match ipv4 source address
match ipv4 destination address
match transport source-port
match transport destination-port
collect routing forwarding-status
collect ipv4 dscp
collect ipv4 ttl
collect transport round-trip-time
collect transport event packet-loss counter
collect interface input
collect interface output
collect counter bytes
collect counter packets
collect counter bytes rate
collect counter packets dropped
collect timestamp interval
collect application media bytes counter
collect application media packets rate
collect application media event
collect monitor event
3845-AA0216#show flow record type performance-monitor default-rtp
flow record type performance-monitor default-rtp:
Description: VM default RTP record
No. of users: 5
Total field space: 98 bytes
Fields:
match ipv4 protocol
match ipv4 source address
match ipv4 destination address
match transport source-port
match transport destination-port
match transport rtp ssrc
collect routing forwarding-status
collect ipv4 dscp
collect ipv4 ttl
collect transport packets expected counter
collect transport packets lost counter
collect transport packets lost rate
collect transport event packet-loss counter
collect transport rtp jitter mean
collect transport rtp jitter minimum
collect transport rtp jitter maximum
collect interface input
collect interface output
collect counter bytes
collect counter packets
collect counter bytes rate
collect counter packets dropped
collect timestamp interval
collect application media bytes counter
collect application media bytes rate
collect application media packets counter
collect application media packets rate
collect application media event
collect monitor event
Figure 21. Configuration of a Custom Performance Monitor Flow Record
1861-AA0213(config)#flow record type performance-mon enhan-tcp-rtp
1861-AA0213(config-flow-record)#flow record type performance-monitor enhan-tcp-rtp
1861-AA0213(config-flow-record)#description basic RTP and TCP stats
1861-AA0213(config-flow-record)#collect ipv4 ttl maximum
1861-AA0213(config-flow-record)#collect transport packets lost counter
1861-AA0213(config-flow-record)#collect transport packets lost rate
1861-AA0213(config-flow-record)#collect transport round-trip-time
1861-AA0213(config-flow-record)#collect transport event packet-loss counter
1861-AA0213(config-flow-record)#collect transport event packet-loss counter
1861-AA0213(config-flow-record)#collect transport packets lost counter
1861-AA0213(config-flow-record)#collect transport packets lost rate
1861-AA0213(config-flow-record)#collect transport round-trip-time
1861-AA0213(config-flow-record)#collect transport event packet-loss coun
1861-AA0213(config-flow-record)#collect transport event packet-loss counter
1861-AA0213(config-flow-record)#end
The flow records are placed in a flow monitor similar to Flexible Netflow. The flow monitor allows the association of the flow record with a flow exporter if the data needs to be exported to a NetFlow collector. The flow monitor can be configured in a global configuration mode if it is to be used across different sets of traffic, or it can be configured inline in a policy map as explained here.
The flow monitor, of which the flow record is a part, and the class maps are brought together with threshold configuration in the performance monitor policy map. The policy map can be configured inline as shown in Figure 3, or for more complex configurations, or configurations applied to multiple points, a global performance monitor policy map may be more appropriate.
In Figure 2, the test topology was shown with video surveillance and video-based telephony applications being run over the network. In the case of video surveillance, the video traffic may be RTP based or HTTP based depending on the type of client. Additionally, for RTP-based video surveillance, the Cisco Video Surveillance 2500 IP Camera uses a dynamic RTP payload type (PT = 96) and a nonstandard video encoding rate (30 kHz). For the jitter calculation to be accurate, you need to inform the performance monitor feature of this change. Because video surveillance and IP-based video telephony serve different business needs and have different sensitivities, the thresholds will be different. The configuration in Figure 22 accommodates these unique requirements.
Be sure to remove the input inline policy map from Fast0/0 before applying the new input performance monitor policy.
flow record type performance-monitor enhan-tcp-rtp
description basic rtp only stats
match ipv4 source address
match ipv4 destination address
match transport source-port
match transport destination-port
match transport rtp ssrc
collect routing forwarding-status
collect ipv4 ttl minimum
collect ipv4 ttl maximum
collect transport packets lost counter
collect transport packets lost rate
collect transport round-trip-time
collect transport event packet-loss counter
collect transport rtp jitter mean
collect transport rtp jitter minimum
collect transport rtp jitter maximum
collect interface input
collect counter packets
collect timestamp interval
collect application media packets counter
collect monitor event
!
policy-map type performance-monitor voice-vc-ipvs-1
class voice-EF
flow monitor inline
record default-rtp
react 1 rtp-jitter-average
threshold value gt 50000
alarm severity alert
action syslog
react 2 transport-packets-lost-rate
threshold value gt 10.00
alarm severity alert
action syslog
class IPVS-traffic
flow monitor inline
record enhan-tcp-rtp
monitor parameters
interval duration 10
monitor metric rtp
clock-rate 96 30000
react 1 transport-packets-lost-rate
threshold value gt 2.00
alarm severity alert
action syslog
class video-conf-AF41
flow monitor inline
record default-rtp
react 1 transport-packets-lost-rate
threshold value gt 2.00
alarm severity alert
action syslog
react 2 rtp-jitter-average
threshold value gt 50000
alarm severity alert
action syslog
!
interface FastEthernet0/0
service-policy type performance-monitor input voice-vc-ipvs-1
service-policy type performance-monitor output voice-vc-ipvs-1
Mediatrace
With mediatrace, a network node or endpoint discovers the network path that a particular existing flow is taking or the path that a new flow would take at this moment. As mediatrace discovers the nodes it also collects statistics from them.
Three possible levels of data collection are available:
• Hops: Mediatrace requests will collect only the network hops and interfaces for that path.
• System: Adds collection of health information for the network nodes on top of hops information.
• Perf-mon: The highest level. Adds collection hop by hop of flow specific information collected by the performance monitoring feature discussed earlier (loss, jitter and latency). After the information is collected, the data is composed into a single report at the requesting node. In the topology in Figure 1, the operator can make a request on R1 for the loss information regarding the Cisco TelePresence System flow.
There are also two methods to invoke a mediatrace:
• Command line-executed by a user it runs a one time path discovery and collection of data and reports the data at the CLI.
• Configured-created in configuration mode and allows for periodic collection of statistics with an interval and a duration. Collected data is stored in a history buffer on the router for later display using the CLI.
By way of example the following three sections show sample output for the three levels of information collection run from the command line.
Mediatrace Poll-Hops Information
As mentioned earlier, mediatrace can follow a particular flow's path and gather various layers of information.
The example in Figure 23 shows a mediatrace hops request that performs only path discovery. The mediatrace is initiated on router VXR-AA0310 upstream of R2, and you can see that R2 and R1 are in the media path, and also that the ingress and egress interfaces are on the mediatrace enabled routers.
A network node does require minimum code levels and mediatrace capability to be enabled. When there are nodes in the media path that are not medianet capable or enabled the mediatrace does pass transparently through those nodes. In the example three mediatrace hops are reported, but analysis of the time-to-live (TTL) field of those hopsshows that between hop zero and hop one the TTL incremented by five. The conclusion is that there where four additional router hops that did not report mediatrace data. This illustrates how end-to-end support for mediatrace is handled.
The mediatrace command requires a path-specifier that identifies the source and destination IP addresses of the mediatrace packet. These addresses can be identical to those of a media stream of interest, can be fictional, or can be addresses of routers. The addresses specified must be from the two subnets between which media traffic is being verified for, and must be routable to and from the device where the mediatrace is run. In most instances the trace would be run on a router or switch which is the first hop from the media endpoint and the addresses of the actual endpoints would be utilized.
In the following example since only hop information is desired, it is not necessary to specify the port information as no stream specific information is collected.
Figure 23. Mediatrace poll CLI command and output for hops information
Request Timestamp: 01:20:51.109 EST Wed Mar 2 2011
Request Status: Completed
Number of hops responded (includes success/error/no-record): 3
Number of hops with valid data report: 3
Number of hops with error report: 0
Number of hops with no data record: 0
Detailed Report of collected data:
Number of Mediatrace hops in the path: 3
Mediatrace Hop Number: 0 (host=VXR-AA0310, ttl=255)
Reachability Address: 10.10.3.10
Ingress Interface: None
Egress Interface: Gi0/3
Mediatrace Hop Number: 1 (host=3845-AA0216, ttl=250)
Reachability Address: 10.1.162.2
Ingress Interface: Fa0/0/0
Egress Interface: Fa0/0/1
Mediatrace Hop Number: 2 (host=1861-AA0213, ttl=249)
Reachability Address: 10.1.3.130
Ingress Interface: Fa0/0
Egress Interface: Vl1000
Mediatrace Poll-System Information
Figure 24 provides an example in which a system poll is run. In a system poll, in addition to performing node and interface discovery, statistics from the interfaces are collected. Mediatrace uses SNMP internally to collect this information from the router, and the snmp community configuration command needs to be applied. In this example, you can see that 1861-AA0213 on Fa0/0 has reported some errors.
Figure 24. Mediatrace System Poll
VXR-AA0310#mediatrace poll path-specifier source 10.1.160.3 destination 10.1.3.3 system
Started the data fetch operation.
Waiting for data from hops.
This may take several seconds to complete...
Data received for hop 0
Data received for hop 1
Data received for hop 2
Data fetch complete.
Results:
Data Collection Summary:
Request Timestamp: 01:26:36.107 EST Wed Mar 2 2011
Request Status: Completed
Number of hops responded (includes success/error/no-record): 3
Number of hops with valid data report: 3
Number of hops with error report: 0
Number of hops with no data record: 0
Detailed Report of collected data:
Number of Mediatrace hops in the path: 3
Mediatrace Hop Number: 0 (host=VXR-AA0310, ttl=255)
Metrics Collection Status: Success
Reachability Address: 10.10.3.10
Ingress Interface: None
Egress Interface: Gi0/3
Metrics Collected:
Collection timestamp: 01:26:36.106 EST Wed Mar 2 2011
Octet input at Ingress (Bytes): NOT COLLECTED
Octet output at Egress (MB): 1971.980163
Pkts rcvd with err at Ingress (pkts): NOT COLLECTED
Pkts errored at Egress (pkts): 0
Pkts discarded at Ingress (pkts): NOT COLLECTED
Pkts discarded at Egress (pkts): 0
Ingress i/f speed (bps): NOT COLLECTED
Egress i/f speed (mbps): 1000.000000
Mediatrace Hop Number: 1 (host=3845-AA0216, ttl=250)
Metrics Collection Status: Success
Reachability Address: 10.1.162.2
Ingress Interface: Fa0/0/0
Egress Interface: Fa0/0/1
Metrics Collected:
Collection timestamp: 01:26:36.114 EST Wed Mar 2 2011
Octet input at Ingress (MB): 2725.193495
Octet output at Egress (MB): 2330.624295
Pkts rcvd with err at Ingress (pkts): 0
Pkts errored at Egress (pkts): 0
Pkts discarded at Ingress (pkts): 0
Pkts discarded at Egress (pkts): 0
Ingress i/f speed (kbps): 100000.000
Egress i/f speed (kbps): 100000.000
Mediatrace Hop Number: 2 (host=1861-AA0213, ttl=249)
Metrics Collection Status: Success
Reachability Address: 10.1.3.130
Ingress Interface: Fa0/0
Egress Interface: Vl1000
Metrics Collected:
Collection timestamp: 01:26:36.230 EST Wed Mar 2 2011
Octet input at Ingress (MB): 3712.318950
Octet output at Egress (MB): 3619.292806
Pkts rcvd with err at Ingress (pkts): 1407
Pkts errored at Egress (pkts): 0
Pkts discarded at Ingress (pkts): 0
Pkts discarded at Egress (pkts): 0
Ingress i/f speed (kbps): 100000.000
Egress i/f speed (kbps): 100000.000
Mediatrace Poll-Performance Monitor Information
Mediatrace can collect additional data along the discovered path by invoking performance monitor to gather flow specific statistics.
The granularity of the mediatrace poll determines the performance monitor data collected. For instance if the IP protocol and the layer four ports are specified, the query will be specific to a single media flow. Alternatively a less specific query can match multiple flowsThen the statistics for all matching flows are aggregated into the report for that nodeDepending on the IP protocol specified, mediatrace alters the query, For TCP flows, it requests information about round-trip time, for UDPRTP jitter, delay and latency are included. In the example in Figure 25, mediatrace utilizes a default profile that collects RTP metrics from the nodes along the path. Mediatrace presents a combined reports for all nodes of a path onto a single screen. Analyzing the output, you can see that no drops occurred through the entire path, and that jitter steadily increases along the path but overall is negligible.
Figure 25. Mediatrace Performance Monitor Poll Using Default RTP Profile
Number of hops responded (includes success/error/no-record): 3
Number of hops with valid data report: 3
Number of hops with error report: 0
Number of hops with no data record: 0
Detailed Report of collected data:
Number of Mediatrace hops in the path: 3
Mediatrace Hop Number: 0 (host=VXR-AA0310, ttl=255)
Metrics Collection Status: Success
Reachability Address: 10.10.3.10
Ingress Interface: None
Egress Interface: Gi0/3
Metrics Collected:
Flow Sampling Start Timestamp: 01:30:42
Loss of measurement confidence: FALSE
Media Stop Event Occurred: FALSE
IP Packet Drop Count (pkts): 0
IP Byte Count (Bytes): 207684
IP Packet Count (pkts): 899
IP Byte Rate (Bps): 6922
Packet Drop Reason: 0
IP DSCP: 34
IP TTL: 62
IP Protocol: 17
Media Byte Rate Average (Bps): 6323
Media Byte Count (Bytes): 189704
Media Packet Count (pkts): 899
RTP Interarrival Jitter Average (usec): 6531
RTP Packets Lost (pkts): 0
RTP Packets Expected (pkts): 894
RTP Packet Lost Event Count: 0
RTP Loss Percent (%): 0.00
Mediatrace Hop Number: 1 (host=3845-AA0216, ttl=250)
Metrics Collection Status: Success
Reachability Address: 10.1.162.2
Ingress Interface: Fa0/0/0
Egress Interface: Fa0/0/1
Metrics Collected:
Flow Sampling Start Timestamp: 01:30:42
Loss of measurement confidence: FALSE
Media Stop Event Occurred: FALSE
IP Packet Drop Count (pkts): 0
IP Byte Count (Bytes): 207398
IP Packet Count (pkts): 898
IP Byte Rate (Bps): 6913
Packet Drop Reason: 0
IP DSCP: 34
IP TTL: 57
IP Protocol: 17
Media Byte Rate Average (Bps): 6314
Media Byte Count (Bytes): 189438
Media Packet Count (pkts): 898
RTP Interarrival Jitter Average (usec): 6677
RTP Packets Lost (pkts): 0
RTP Packets Expected (pkts): 893
RTP Packet Lost Event Count: 0
RTP Loss Percent (%): 0.00
Mediatrace Hop Number: 2 (host=1861-AA0213, ttl=249)
Metrics Collection Status: Success
Reachability Address: 10.1.3.130
Ingress Interface: Fa0/0
Egress Interface: Vl1000
Metrics Collected:
Flow Sampling Start Timestamp: 01:30:42
Loss of measurement confidence: FALSE
Media Stop Event Occurred: FALSE
IP Packet Drop Count (pkts): 0
IP Byte Count (Bytes): 203840
IP Packet Count (pkts): 883
IP Byte Rate (Bps): 6794
Packet Drop Reason: 0
IP DSCP: 34
IP TTL: 56
IP Protocol: 17
Media Byte Rate Average (Bps): 6206
Media Byte Count (Bytes): 186180
Media Packet Count (pkts): 883
RTP Interarrival Jitter Average (usec): 6782
RTP Packets Lost (pkts): 0
RTP Packets Expected (pkts): 876
RTP Packet Lost Event Count: 0
RTP Loss Percent (%): 0.00
The mediatrace poll exec command provides a quick way to process a one-time request. There is some flexibilty for the operator to select which major type of data is being requested: path discovery, interface level, or the preconfigured performance monitor records. However, in some cases, more control may be needed.
The mediatrace poll exec command is a macro that dynamically creates a one-time mediatrace session that is discarded after the results are displayed. In the background, the poll command makes use of mediatrace profiles, session parameters, and path specifiers, although sometimes not directly.
Mediatrace-Configuration Based
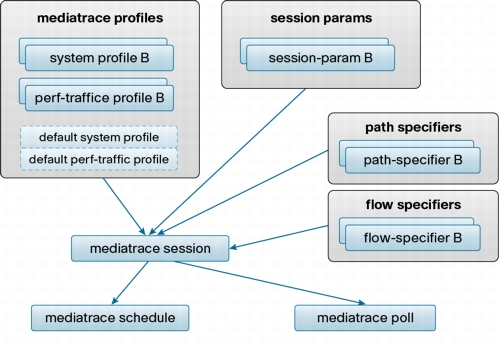
Mediatrace can also be executed via a preconfigured set of parameters specified in configuration mode. The configuration is hierarchical and modular and Figure 26 is a graphical representation of that modular command structure. Once the parameters for a mediatrace are defined through profiles, session parameters and path specifiers, they are combined into a mediatrace session.
The defined mediatrace session can then either be run by scheduling it in configuration mode, or can be used by a mediatrace poll at the CLI interface.
Figure 26. Mediatrace Configuration and Execution Model
The path specifier configures source and destination IP addresses that determine the path a mediatrace packet will follow and therefore the path that is discovered. Specification of layer four ports is necessary for path congruity with a specific flow when redundant exit paths exist at some nodes in the network; the ports are used in a multipath selection algorithm8 to determine which path a particular target flow follows.
Mediatrace flow specifiers define what flows along the discovered path to include in the statistic collection. Like the filters in the performance monitor class maps, the flow specifier can be very specific (for example, a 5-tuple) or more generic (such as a DSCP classification). Because the path specifier is expressed as a flow description, by default the path specifier is also the flow specifier.
Figure 27 provides examples of path and flow specifiers.
Figure 27. Mediatrace Path and Flow Specifiers
mediatrace path-specifier 160.3to3.15 destination ip 10.1.3.3
source ip 10.1.160.3
!
mediatrace flow-specifier IPcamera.2.XP1
source-ip 10.1.1.16 source-port 5004
dest-ip 10.1.3.15 dest-port 2660
Mediatrace profiles define what information to measure and collect from the path. Mediatrace uses two types of profiles: system profiles and performance monitor profiles.
System profiles collect information that is not flow specific. Examples of system profile data options include CPU, memory, and interface metrics. The mediatrace system poll command by default gathers interface statistics, as shown earlier in Figure 24.
The performance monitor profile interacts with the performance monitor module in the nodes along the path. Mediatrace can dynamically configure a performance monitor policy to collect flow-specific statistics. Performance monitor profiles can describe groups of statistics based on TCP or RTP metrics. Additionally, performance monitor mediatrace profiles can configure the way the measurement is performed by allowing configuration of the monitor interval and RTP clock rate. Figure 28 shows an example of a mediatrace profile.
Figure 28. Mediatrace Profile
mediatrace profile perf-monitor test
metric-list rtp
clock-rate 96 30000
admin-params
sampling-interval 10
The mediatrace session-params container describes information about the mediatrace session itself. Configuration parameters here are related to the number of historical buckets of data to keep in memory, the response timeout value, etc. Figure 29 shows an example of a mediatrace session-params configuration.
Figure 29. A mediatrace session-params Configuration.
mediatrace session-params cam2xp1
response-timeout 3
history data-sets-kept 10
The path-specifier, session-params, and profile specifications are brought together in a mediatrace session configuration. These individual elements can also be invoked with the mediatrace poll command. However, if you need to run mediatrace operations in succession and keep a historical record, the mediatrace session is the best mechanism. Figure 30 shows an example of a mediatrace session. All that you need to do after running this command is to schedule the session (in configuration mode), by configuring the start time, recurrence, and lifetime (Figure 31).
profile perf-traffic test flow-specifier IPcamera.2.XP1
Figure 31. Mediatrace Session Scheduling
mediatrace schedule 1 start-time now
After the mediatrace session is scheduled and the data starts arriving, the reports are available through the showmediatrace session data command structure. An example is shown in Figure 32. The format is the same as that for a mediatrace poll. Note that the first mediatrace run could not collect the performance monitor statistics because the monitor interval on the nodes had not completed and so the monitor was not available. The next run (bucket index 2) was able to collect the statistics from the nodes that are path congruent with the IP camera flow. The first node (VXR-AA0310) is not on the same path as the IP camera flow (originating at 10.1.1.16).
Figure 32. Observation on R2 (3845-AA0216) Before Impairment
VXR-AA0310#show mediatrace session data 1
Load for five secs: 5%/4%; one minute: 5%; five minutes: 5%
Session Index: 1
Global Session Id: 50827569
Session Operation State: Active
Bucket index: 1
Data Collection Summary:
Request Timestamp: 02:13:16.404 EST Wed Mar 2 2011
Request Status: Completed
Number of hops responded (includes success/error/no-record): 3
Number of hops with valid data report: 0
Number of hops with error report: 0
Number of hops with no data record: 3
Detailed Report of collected data:
Last Route Change Timestamp:
Route Index: 0
Number of Mediatrace hops in the path: 3
Mediatrace Hop Number: 0 (host=VXR-AA0310, ttl=255)
Metrics Collection Status: Fail (19, No statistic data available for reporting)
Reachability Address: 10.10.3.10
Ingress Interface: None
Egress Interface: Gi0/3
Metrics Collected:
Mediatrace Hop Number: 1 (host=3845-AA0216, ttl=250)
Metrics Collection Status: Fail (19, No statistic data available for reporting)
Reachability Address: 10.1.162.2
Ingress Interface: Fa0/0/0
Egress Interface: Fa0/0/1
Metrics Collected:
Mediatrace Hop Number: 2 (host=1861-AA0213, ttl=249)
Metrics Collection Status: Fail (19, No statistic data available for reporting)
Reachability Address: 10.1.3.130
Ingress Interface: Fa0/0
Egress Interface: Vl1000
Metrics Collected:
Bucket index: 2
Data Collection Summary:
Request Timestamp: 02:15:16.404 EST Wed Mar 2 2011
Request Status: Completed
Number of hops responded (includes success/error/no-record): 3
Number of hops with valid data report: 2
Number of hops with error report: 0
Number of hops with no data record: 1
Detailed Report of collected data:
Last Route Change Timestamp:
Route Index: 0
Number of Mediatrace hops in the path: 3
Mediatrace Hop Number: 0 (host=VXR-AA0310, ttl=255)
Metrics Collection Status: Fail (19, No statistic data available for reporting)
Reachability Address: 10.10.3.10
Ingress Interface: None
Egress Interface: Gi0/3
Metrics Collected:
Mediatrace Hop Number: 1 (host=3845-AA0216, ttl=250)
Metrics Collection Status: Success
Reachability Address: 10.1.162.2
Ingress Interface: Fa0/0/0
Egress Interface: Fa0/0/1
Metrics Collected:
Flow Sampling Start Timestamp: 02:14:56
Loss of measurement confidence: FALSE
Media Stop Event Occurred: FALSE
IP Packet Drop Count (pkts): 0
IP Byte Count (Bytes): 46089
IP Packet Count (pkts): 261
IP Byte Rate (Bps): 4608
Packet Drop Reason: 0
IP DSCP: 40
IP TTL: 61
IP Protocol: 17
Media Byte Rate Average (Bps): 4086
Media Byte Count (Bytes): 40869
Media Packet Count (pkts): 261
RTP Interarrival Jitter Average (usec): 16639
RTP Packets Lost (pkts): 0
RTP Packets Expected (pkts): 261
RTP Packet Lost Event Count: 0
RTP Loss Percent (%): 0.00
Mediatrace Hop Number: 2 (host=1861-AA0213, ttl=249)
Metrics Collection Status: Success
Reachability Address: 10.1.3.130
Ingress Interface: Fa0/0
Egress Interface: Vl1000
Metrics Collected:
Flow Sampling Start Timestamp: 02:14:56
Loss of measurement confidence: FALSE
Media Stop Event Occurred: FALSE
IP Packet Drop Count (pkts): 0
IP Byte Count (Bytes): 46089
IP Packet Count (pkts): 261
IP Byte Rate (Bps): 4608
Packet Drop Reason: 0
IP DSCP: 40
IP TTL: 60
IP Protocol: 17
Media Byte Rate Average (Bps): 4086
Media Byte Count (Bytes): 40869
Media Packet Count (pkts): 261
RTP Interarrival Jitter Average (usec): 16577
RTP Packets Lost (pkts): 0
RTP Packets Expected (pkts): 261
RTP Packet Lost Event Count: 0
RTP Loss Percent (%): 0.00
Conclusion
The medianet media monitoring solution is composed of the performance monitor, mediatrace, and Cisco IOS IPSLA-VO features.
The performance monitor can inspect user audio, video, and data traffic and provide validation and the generation of performance baselines if no problems are detected. In the event of network or application problems, the performance monitor can gauge the performance of the network and raise application-specific alerts as necessary; it can also provide fault isolation for accelerated problem assignment and resolution. Mediatrace is a diagnostic tool that can follow the path of a flow and present a single unified report of the experience of the flow as it traverses the network.
Mediatrace traces the path instead of requiring the network operator to move from router to router.
Cisco IOS IPSLA-VO (not detailed in this document) allows stress testing of the network through the injection and measurement of simulated application traffic. This type of testing can be helpful in pre deployment scenarios, and it can also help troubleshoot after an application has been deployed.
These features provide enhanced confidence to the application and network operator in deploying and accelerating interactive media applications.
For More Information
For more information about medianet and enterprise medianet solutions, please visit: