Medianet is the Cisco recommended architecture for video and collaboration deployments. When the usage of Voice over IP (VoIP) was growing, Cisco AVVID (Architecture for Voice, Video and Integrated Data) provided a framework to transition to voice. Now, the Cisco Medianet architecture serves as a strong foundation to support the transition to video. Cisco Medianet provides a framework that helps with deployment, management, troubleshooting, and improving the quality of experience for video and collaboration deployments.
Cisco Medianet tightly integrates rich-media applications and intelligent network services providing visibility, dynamic troubleshooting, improved Quality of Experience and the ability to protect business critical traffic.
The idea behind this approach comes from the realization that the endpoints or applications are the place in the architecture where there is the most information about the applications. The endpoints can communicate with the network, making the network media-aware and armed with important information that can be used to make intelligent decisions. The endpoints also become network aware and can request intelligent network services for example, for troubleshooting. This can be accomplished with the Media Services Interface (MSI), which is embedded in Cisco endpoints and collaboration applications. MSI provides a set of APIs enabling applications to use Cisco Medianet network services as well as send valuable information about the media flows to the network.
Cisco Medianet features are described in Table 1 below.
Table 1. Cisco Medianet Features
Feature
Description
Performance Monitor
Performance Monitor passively measures TCP and Real-Time Protocol (RTP) performance metrics for live network traffic flowing through a network device.
Performance Monitor statistics can be packaged into Flexible NetFlow records and Simple Network Management Protocol (SNMP) MIBs, and sent to a NetFlow collector or Network Management System (NMS).
Mediatrace
Mediatrace is a diagnostic tool similar to traceroute. It allows the operator to retrieve the following data points from both Layer 3 and Layer 2 network nodes:
• Performance statistics (packet loss, jitter, and round-trip time [RTT]) of a media flow
• Quality of service (QoS) values
• Differentiated Services Code Point (DSCP)
• System health information for network nodes in the data path (CPU and memory use, etc.)
Mediatrace follows the same path as the real media flow and reports the data points to the mediatrace initiator.
IP Service-Level Agreement (SLA) Video Operation (VO)
IP SLA VO generates synthetic video flows with the same characteristics as real flows (packet rate, packet size, and RTP header). IP SLAs generate a unidirectional flow from the source to the IP SLA responder. The responder calculates performance statistics such as delay and packet loss and sends the results back to the IP SLA sender. IP SLA VO includes three predefined video profiles:
• TelePresence 1080p
• IP Television (IPTV)
• IP Video Surveillance Camera (IPVSC)
You can also add new custom traffic profiles.
Autoconfiguration
Service discovery and autoregistration are part of the autoconfiguration capabilities. Autoconfiguration is a plug-and-play solution that eases the addition, movement, and changing of media endpoints. Service discovery allows a video endpoint, such as a Cisco Digital Media Player (DMP), to learn the network address of a media server. Using autoregistration, it can then register to that media server.
Flow Metadata
Allows an application to explicitly signal attributes about itself and the media flows to the network from node to node. This allows appropriate policies to be applied to its flows at each hop, end to end.
Provides the ability to differentiate business-critical applications and to determine the importance of a session based on its business value, so that the network can consistently provide service assurance and optimal user experience.
Media Services Proxy (MSP)
Uses lightweight deep packet inspection techniques to snoop standard based signaling protocols to identify applications and their media flows. Based on this identification, MSP produces flow metadata attributes that can be shared among network nodes.
Media Services Interface (MSI)
A software package that provides Cisco rich-media endpoints and applications with a set of Application Programming Interfaces (APIs) to enable them to take advantage of the medianet services in the network infrastructure.
• Allows a media application to identify itself and its media flows to the network.
• Based on the knowledge of the application and its media flows, the network can provision better service for the approved application.
• Allows network management to have better visibility of the application and its media flows
For a list of the products and versions that support each of these features, please make sure you check the Cisco Medianet datasheet that can be found in the medianet knowledge base (www.cisco.com/go/medianetkb).
The purpose of this document is to guide network operators when deploying Cisco Medianet1 features. The document is organized in three sections.
The "Fundamental Cisco Medianet Use Cases and Configuration" section discusses the most common medianet use cases and provides implementation details based on a sample topology:
The "Handling Specific Scenarios" section discusses the most common deployment situations and guides the user on how to use the Cisco Medianet features in those situations:
The "Design Guidelines and Best Practices" section discusses best practices and design guidelines that users can utilize when planning a Cisco Medianet deployment.
Fundamental Cisco Medianet Use Cases and Configuration
Reference Topology
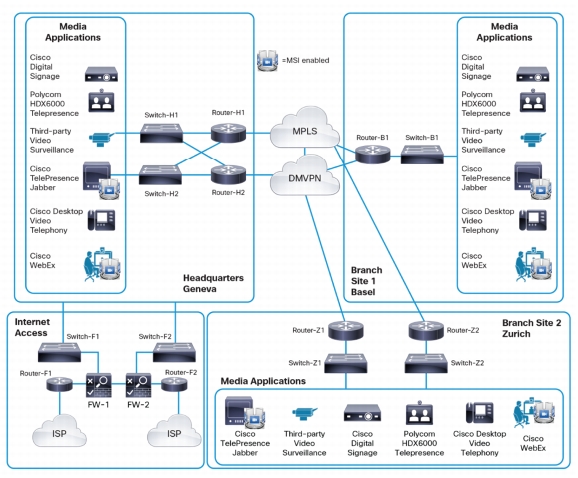
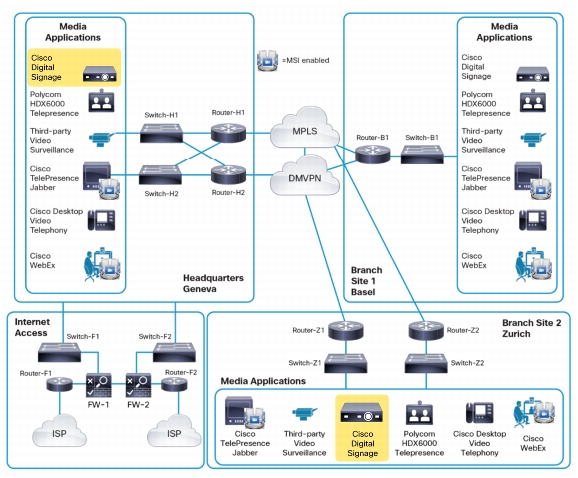
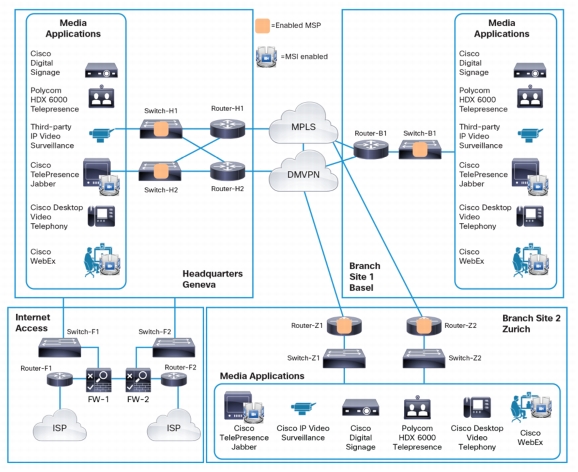
In this document, a sample network will be used to illustrate a Cisco Medianet deployment. The network depicted in Figure 1 belongs to a fictitious company called SuperWatchMaker, a manufacturer of high-quality watches. SuperWatchMaker has its corporate headquarters in Geneva, Switzerland, and production facilities in Basel and Zurich.
The deployment guide offers a complete configuration for Cisco Medianet features that users can copy/paste to a network device running IOS. IOS output for `show' commands are also provided for verification of deployed features. To assist readability and highlight important text, the following convention is used:
Text in bold denotes a IOS show command
Text in italics denotes something interesting to observe
This is IOS output
Traffic Baselining
Network operators need to understand how their networks manage media applications. They want to gain insight into traffic patterns and collect performance metrics for media flows traversing their networks. The network operator of the fictitious company SupeWatchmaker is specifically interested in the following data points:
• Bandwidth use per (media) application
• Times of application use
• Loss and jitter for media flows
• Response time of transaction-based applications
Network operators traditionally use NetFlow and Flexible NetFlow, Network-Based Application Recognition (NBAR), interface counters, and Class-based QoS (CBQoS) to gain insight into traffic patterns. Performance Monitor complements these methods by adding performance metrics for media and flows associated with applications.
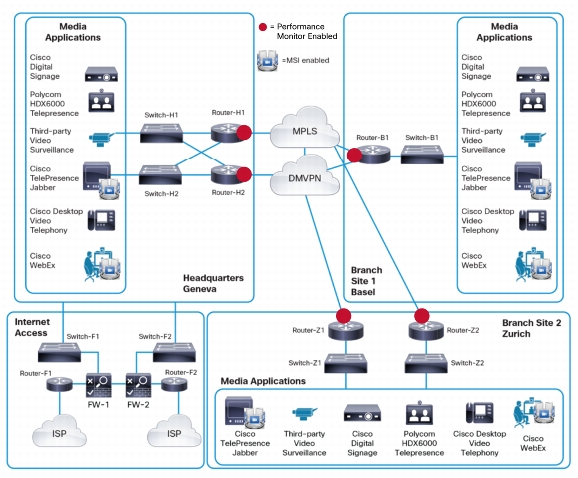
The network operator of SuperWatchMaker wants to collect performance data for the media flows for the most important applications traversing the WAN. With this data, the operator can get information about how the network affects critical applications. Performance Monitor is deployed on the headquarters routers' WAN interfaces in input directions (to gather performance data for flows coming across the WAN into the headquarters) and on the branch-site routers' WAN interfaces in input directions (to gather performance data for flows coming across the WAN into the branch site). This data will give the network operator a baseline on RTT, jitter, and loss at those specific points in the network (see Figure 2). To locate the exact point at which loss is introduced, Performance Monitor statistics on additional network nodes may need to be retrieved. This procedure is discussed in the "Troubleshooting and Fault Isolation" section later in this document.
Figure 2. Preparing the Network for Performance Baselining
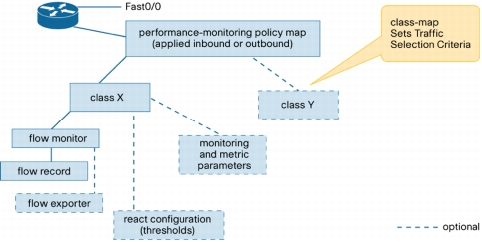
For a network operator familiar with the use of class and policy maps for QoS configurations, the configuration of Performance Monitor is a simple task. Figure 3 (below) shows how Performance Monitor is configured. Optional components are shown with dotted lines; the only configuration elements that do not have defaults are the flow record, the flow monitor, and the class.
Figure 3. Performance Monitor Configuration
Deployment Configuration Example: Baselining Enterprise Media Applications
Performance Monitor uses class maps to define what traffic to monitor. In the example network, a baseline for all the media applications should be created so that each media application can be assigned to a class. Because media applications are usually classified when implementing QoS, the same class maps that you use for QoS can be reused. Table 2 (below) shows the configuration.
Table 2. Configuration Example: Baselining Enterprise Media Applications
Configuration
Description
flow exporter NMS
destination NetFlow1.superwatchmaker.com
transport udp 2055
Performance management systems can get Cisco IOS® Performance Monitor statistics through SNMP or Flexible NetFlow.
In this example, you are sending the statistics to a NetFlow collector that is receiving Flexible NetFlow records over User Datagram Protocol (UDP) port 2055.
flow monitor type performance-monitor all-tcp
record default-tcp
exporter NMS
flow monitor type performance-monitor all-
rtp
record default-rtp
exporter NMS
The flow monitor defines the Flexible NetFlow record that is used to collect data and where that data is sent.
In this example, you are using the default flow records for TCP and RTP. You can use the show flow record type performance-monitor default-rtp command or the show flow record type performance-monitor default-tcp command to see what flow records are collected.
class-map match-any STREAMING
match ip dscp af31
policy-map type performance-monitor baseline
class STREAMING flow monitor all-tcp
This class contains digital signage systems. In the example network, the Cisco Digital Media Manager (DMM) located in the headquarters pushes media files to the Cisco DMPs at the branch sites. This traffic is based on TCP, and RTT and packet loss information is being collected for these transactions.
class-map match-any BROADCAST-VIDEO
match ip dscp cs5
policy-map type performance-monitor baseline
class BROADCAST-VIDEO
flow monitor all-rtp
monitor metric rtp
clock-rate 96 35000
This class covers Cisco IP Video Surveillance traffic. In the SuperWatchMaker network, the surveillance cameras send RTP streams to the Cisco Video Surveillance Operation Manager (VSOM) located in the headquarters. Cisco IP Video Surveillance video uses an RTP payload type of 96 and a clock rate of 35 kHz.
class-map match-any REALTIME-INTERACTIVE
match protocol telepresence-media
policy-map type performance-monitor baseline
class REALTIME-INTERACTIVE
flow monitor all-rtp
monitor metric rtp
clock-rate 96 48000
clock-rate 101 8000
This class covers Cisco TelePresence® calls. Classification is performed with NBAR.
In this example, Cisco TelePresence System is using an RTP payload type of 112 for video. For audio, it uses 96 for advanced audio codec (AAC; at 48 kHz) and 101 for dual-tone multifrequency (DTMF; at 8 kHz).
ip access-list extended Movi
permit udp any range 14040 14240 any
class-map match-any VIDEO-CONF
match ip dscp af41
match access-group name Movi
policy-map type performance-monitor baseline
class VIDEO-CONF
flow monitor all-rtp
This class covers desktop video conferencing.
The video phones in this network deployment are the Cisco Unified IP Phone 9971, and they use a payload type of 96 for video and 9 (G.722) for audio. In the same class are Cisco TelePresence Movi clients that are classified by a UDP source port range.
class-map match-any TRANSACTIONAL
match ip dscp af21
policy-map type performance-monitor baseline
class TRANSACTIONAL
flow monitor all-tcp
monitor parameters
flows 100
This class covers transactional TCP-based applications such as SAP applications.
In this example, the Cisco WebEx® solution also goes into this class. Because many TCP applications may end up here, limit the number of flows to 100. As NetFlow records are exported to the NetFlow collector, check there to see which applications are using which ports and IP addresses to revise the classification. For example, after knowing the addresses of the Cisco WebEx servers, the subnets of the Cisco WebEx servers explicitly in an access control list (ACL) may want to be called out.
class-map match-any SIGNALING
match ip dscp cs3
policy-map type performance-monitor baseline
class SIGNALING
flow monitor all-tcp
This class covers signaling traffic such as Session Initiation Protocol (SIP) and Skinny Client Control Protocol (SCCP). Because this class is often based on TCP, assign the default TCP monitor.
class-map match-any VOIP
match ip dscp ef
policy-map type performance-monitor baseline
class VOIP
flow monitor all-rtp
This class meters audio-only calls. Cisco IP Phones that use Cisco Unified Call Manager mainly use the audio codecs G.729, G.711, and G.722. Performance Monitor detects those audio types.
In this example, only on-network intersite calls are being monitored. If interested in RTP statistics for intrasite calls, deploy Performance Monitor on the LAN switches. Furthermore, be aware that Cisco Unified Call Manager keeps some call statistics in the Call Detail Records (CDRs).
interface tunnel 1
description DMVPN
service-policy type performance-monitor
input baseline
inter gig 0/1
description L3 MPLS VPN
service-policy type performance-monitor
input baseline
Apply the Performance Monitor service policy to the WAN interfaces. When using IP Security (IPsec) encryption, make sure that the Performance Monitor policy to the tunnel interface is applied. If it is attached to the physical interface, Performance Monitor will not be able to compute statistics because it receives encrypted data. Also note that GETVPN interfaces do not support monitoring, because interfaces enabled for GETVPN process encryption before monitoring.
After the configuration described in Table 2 is applied, Performance Monitor sends Flexible NetFlow records containing performance metrics to the NetFlow collectors. Different hardware platforms have different monitoring capacities (see Table 3 below). For example, when 800 RTP flows were monitored on a Cisco 3945 Integrated Services Router (ISR), CPU utilization increased 11 percent. Therefore, you should deploy Performance Monitor gradually; for example, map classes to the Performance Monitor policy incrementally, while carefully watching CPU and memory utilization.
Table 3. Performance Monitor Scale Values
Platform
Number of Monitored Flows
Monitored Throughput (All Flows)
Increase in CPU Utilization
Cisco Catalyst 3K
100 at 100 Kbps
10 Mbps
17%
Cisco Catalyst 3K
160 at 100 Kpbs
16 Mbps
27%
Cisco 3945 ISR
400 at 100 Kpbs
40 Mbps
6%
Cisco 3945 ISR
800 at 100 Kpbs
80 Mbps
11%
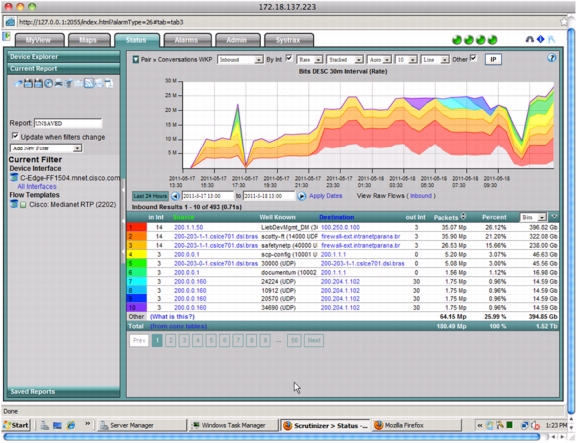
Figure 4 (below) shows Performance Monitor data on a Plixer Scrutinizer. Several other vendors also support Cisco Media Monitoring metrics. For information, see http://developer.cisco.com/web/mnets/partners.
Figure 4. Default RTP 24-Hour Report from Plixer Scrutinizer
Performance management applications supporting media monitoring allow the data to be displayed in various ways. Figure 5 (below) shows RTP packet loss and jitter summarized by subnet.
Figure 5. RTP Loss and Jitter on NetFlow Analyzer from Plixer Scrutinizer
The performance data that is sent to the NetFlow Analyzer can also be displayed on the routers using the following show commands:
The previous example showed how the network operator of SuperWatchMaker can use Performance Monitor to create a traffic profile and collect performance data for the media applications within the corporate network. Performance Monitor can also be used to learn the traffic profiles of applications in the public cloud. For this scenario, deploy Performance Monitor on the Demilitarized Zone (DMZ) routers (see Figure 6 below).
Figure 6. Deploying Performance Monitor on Internet Access
By deploying Performance Monitor on the DMZ routers, flow statistics and performance data for cloud-based applications can be gathered. Often those applications are based on TCP, so in the example in Table 4 (below), a Performance Monitor policy is created to collect flow statistics and TCP metrics, and send these records to a NetFlow collector for analysis.
Table 4. Configuration Example: Baselining on Internet Access
Commands
Description
flow exporter NMS
destination NetFlow1.superwatchmaker.com
transport udp 2055
ip access-list extended all-tcp
permit tcp any any
class-map all-tcp
match access-group name all-tcp
flow monitor type performance-monitor all-tcp
record default-tcp
exporter Plixer
policy-map type performance-monitor baseline
class all-tcp
flow monitor all-tcp
monitor parameters
flows 500
interface gigabitethernet 0/1
description Internet-Access-ISP1
service-policy type performance-monitor
input baseline
service-policy type performance-monitor
output baseline
This policy meters all TCP traffic entering and exiting the WAN interfaces on the Internet edge routers. Depending on the CPU utilization of the device, the network operator can gradually increase the number of monitored flows. This example starts with a conservative number of 500 flows to monitor. After the flow data has been analyzed by the NetFlow server, narrow down the classification ACLs by calling out the server subnets of the applications of interest.
After the Internet edge routers are configured for Performance Monitor, reports can be viewed on the NetFlow analyzer. Figure 7 (below) shows RTT and packet loss values for applications in a pie chart and Figure 8 shows RTT and packet lost values on a plot that displays statistics per interface. In this format, the statistics for different interfaces connected to different ISPs can be compared.
Figure 7. Performance Monitor TCP Statistics: Per Application RTT and Packet Loss (Pie Chart) from Plixer Scrutinizer
Figure 8. Performance Monitor TCP Statistics: Per Application RTT and Packet Loss (Statistics Per Interface) from Plixer Scrutinizer
Understanding RTP and TCP Metrics
Performance Monitor calculates RTP packet drops by keeping track of the sequence numbers that are part of the RTP header. Unlike a TCP connection, a media stream based on RTP and UDP is always unidirectional. Thus, when applying a media monitor policy in the input direction on a LAN interface on a branch site's router, RTP metrics only for media streams leaving the site can be collected. To collect RTP metrics for media streams entering a branch site, the policy either on the WAN interface (input) or on the LAN interface (output) needs to be applied.
Another field in the RTP header is the Synchronization Source identifier (SSRC). This identifier is used to distinguish between different audio and video channels if they share the same UDP session. In the case of the Cisco TelePresence System, the multiscreen video channels share the same UDP stream (IPsrc, IPdst, and Layer 4 ports). For the Cisco TelePresence System, the SSRC is used to differentiate the unique video channels.
RTP jitter values are calculated by analyzing the time-stamp field in the RTP header. The time stamp does not actually refer to regular time, but to ticks of the encoder's clock. For video, the encoding clock rate is usually 90 kHz, and in traditional voice it is 8 kHz. However, with modern wideband audio codecs, the frequency may be a variety of values. Performance Monitor tries to derive the clock rate from the payload-type field in the RTP header, so the RTP payload type gives an idea of the kind of media in an RTP stream. The static RTP payload types can be found on the IANA website (http://www.iana.org/assignments/rtp-parameters). Some important payload types are listed in Table 5 (below).
Table 5. Payload Types
Payload Type
Name
RTP Clock Rate
0
PCMU (G.711 mu-law)
8000 Hz
Most audio codecs use an RTP clock rate of 8 kHz.
8
PCMA (G.711 A-law)
8000 Hz
9
G.722 (default codec for Cisco IP Phones)
8000 Hz
18
G.729
8000 Hz
34
H.263
90,000 Hz
96-127
Dynamic
Performance Monitor uses 35 kHz as the default for payload type 96, and 90 kHz as the default for all other payload types. Most video codecs use a clock rate of 90 kHz.
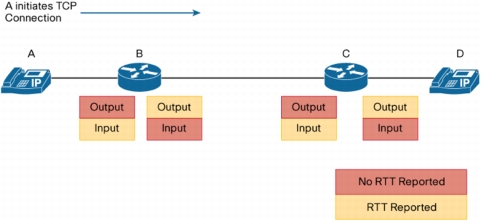
A Performance Monitor policy is configured on an interface in the inbound or outbound direction. Figure 9 (below) depicts a TCP connection initiated by host A. Media monitoring uses the time taken to perform a TCP three-way handshake to calculate TCP RTT. Only the upstream interfaces see the TCP SYN call; therefore, only RTT statistics are seen for the Performance Monitor policies depicted in Figure 9. Moreover, because Performance Monitor takes the entire three-way handshake into account, it does not matter where the sample is taken. Routers B and C will report the same RTT.
Figure 9. TCP RTT
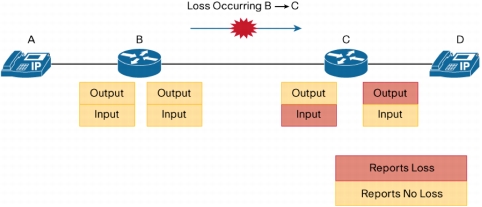
Likewise, when calculating TCP loss, media monitoring keeps track of TCP sequence numbers. So when packets are lost between routers B and C (as shown in Figure 10 below), router C will notice the loss on the interfaces located upstream of the error source. Router B, however, will not report any packet loss. This behavior allows the network operator to pinpoint the error source.
Figure 10. TCP Packet Loss
Troubleshooting and Fault Isolation
This section discusses how to make the sample network ready for media troubleshooting, and it also shows the steps for a fault isolation example.
Preparing the Network for Media Troubleshooting
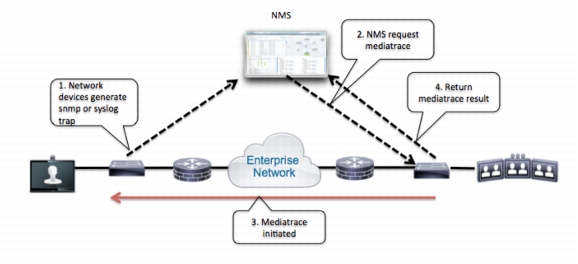
When a problem occurs, you want to capture performance data while the event is happening; therefore, preparing the network for media troubleshooting in advance is necessary. Specifically, what is needed is to enable the network devices for Mediatrace so that the network devices can respond to Mediatrace requests.
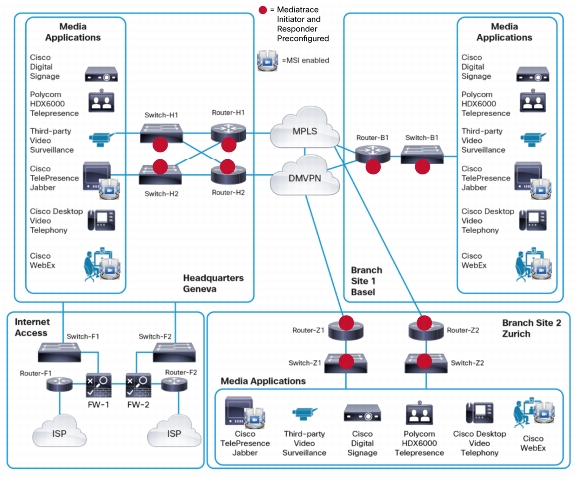
Figure 11 (below) depicts the SuperWatchMaker network. All network elements that are in the path of the company's critical media applications will be enabled for Mediatrace. In the event of a network problem, the operator can initiate a mediatrace to retrieve performance data from the devices along a media flow, allowing the operator to locate the cause of the problem.
Figure 11. Preparing the Network for Mediatrace
When troubleshooting a network problem, which flows are affected is the information needed. SuperWatchMaker did not want to rely on user complaints for that, so it put proactive monitoring in place to be aware of network problems. Specifically, SuperWatchMaker's network operator enabled Performance Monitor on the WAN routers to assess RTP metrics for its most important media applications. When performance thresholds are crossed, syslog alerts are directed to an NMS.
Performance Monitor is deployed on the router's WAN interface in the ingress direction. This way, RTP performance metrics are gathered for media flows coming from the WAN into the sites. In this example, Performance Monitor Threshold-Crossing Alerts (TCAs) are set for Cisco TelePresence System calls between the headquarters and the two branch sites (see Figure 12 below).
Figure 12. Applying Performance Monitor TCAs
Deployment Configuration Example: Mediatrace
Table 6 (below) shows a sample Mediatrace configuration.
This command is needed so that during a network problem the operator can initiate a Mediatrace session. All Mediatrace responders will send back their reports to the network address specified as source-interface. Make sure this address can be reached from all nodes. The max-session value specifies the number of sessions that can be initiated at a time. Different platforms have different default values.
In this example, sessions are limited to a maximum of 10.
mediatrace responder
This command enables the Mediatrace responder on all devices that support it. Mediatrace responders send their Mediatrace reports to Mediatrace initiators.
policy-map type performance-monitor mediamon1
class REALTIME-INTERACTIVE
flow monitor inline
record default-rtp
react 1 transport-packets-lost-rate
description Media-Packet-Loss
threshold value ge 1.00
alarm severity critical
action syslog
interface <WAN Interfaces>
service-policy type performance-monitor input mediamon1
In the react portion of a Performance Monitor policy map, define drop thresholds for mission-critical media applications. Here, assign a TCA alarm to the Realtime-Interactive class, which contains Cisco TelePresence System calls. This way, there will be an alert when a network problem occurs. You can direct traps to an SNMP manager or, as in this example, trigger a syslog message. The alert will contain the flow in question, which is needed to further troubleshoot the problem using Mediatrace.
Configuration of Switches H1, H2, and B1
Description
ip rsvp snooping
Cisco Catalyst® 3000 and 4000 Series Switches support Mediatrace even if they are configured to run in Layer 2 mode. In this case, IP Resource Reservation Protocol (RSVP) snooping needs to be enabled for Mediatrace packets to be forwarded to the switch's CPU.
This command enables the Mediatrace initiator on the switch. For switches running in Layer 2 mode, you can define the management VLAN interface as the Mediatrace source. Make sure that this network address can be reached because Mediatrace responders will send their reports to this address.
mediatrace responder max-sessions 10
This command enables the Mediatrace responder and limits the number of concurrent Mediatrace sessions to 10.
The SuperWatchMaker network is now ready for media troubleshooting.
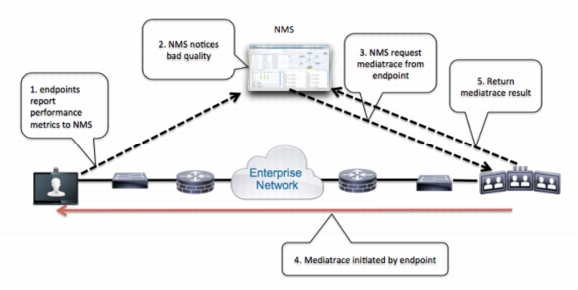
Isolating a Network Problem Using Mediatrace
Determining the root cause of a network problem using media monitoring involves several steps. Figure 13 (below) lists the steps from fault detection to isolation of the root cause.
Figure 13. Mediatrace Troubleshooting Workflow
1. A network problem is usually brought to a network operator's attention by an NMS alert or user complaints. Performance Monitor allows the network operator to set thresholds for packet loss and directs syslog messages to the NMS. These syslog messages contain the flow information that you can feed into Mediatrace. After it is known that a problem occurred and the media flows that are affected, troubleshooting can start.
2. Mediatrace is sent toward the same destination as the actual media flow. Ideally, you can initiate Mediatrace directly from the source of the media; however, this can be done only if the media device has embedded Mediatrace capability (through the Media Services Interface [MSI]). Alternatively, you can initiate Mediatrace on a switch or router; for this, determine the Mediatrace initiator that is located as close as possible to the media sender. If an up-to-date topology drawing exists, the network operator can see the network address of the Mediatrace initiator on that diagram. If it is unclear what devices are in the media path, use a reverse Mediatrace operation (a Mediatrace operation sent to the source IP address of the media stream) to determine the Mediatrace initiator.
3. Invoke Mediatrace to gather performance data along the media path. All Mediatrace responders send their performance reports to the initiator.
4. By analyzing the data, the network operator can isolate the problem.
5. The operator eventually finds the problem.
Fault Isolation Procedure
To better understand media troubleshooting using Mediatrace and Performance Monitor, examine the troubleshooting scenario for the SuperWatchMaker network shown in Figure 14 below.
Figure 14. Isolating a Network Problem Using Mediatrace and Performance Monitor
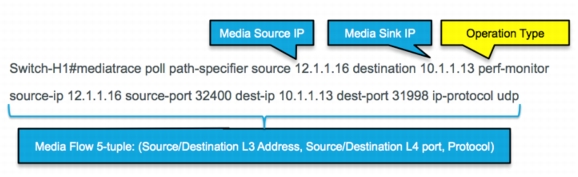
The network operator of SuperWatchMaker has noticed Performance Monitor TCAs on the syslog server indicating that packet-loss thresholds have been crossed for one of SuperWatchMaker's critical media applications (Cisco TelePresence System). The operator logs in to the router to examine this problem more closely. In the syslog buffer for Router-B1, the operator can see that there is packet loss for one of the media flows. Performance Monitor supplies the 5 tuple for that flow:
May 3 13:38:33.610: %PERF_TRAFFIC_REACT-2-CRITSET: TCA RAISE.
Detailed info: Threshold value crossed - current value 1.27%
Flow info: src ip 12.1.1.16, dst ip 10.1.1.13
src port 32400, dst port 31998
ssrc 30583
Policy info: Policy-map mediamon1, Class REALTIME-INTERACTIVE, Interface GigabitEthernet0/1, Direction input
React info: id 1, criteria transport-packets-lost-rate, severity critical, alarm type discrete, threshold range [1.00%, 100.00%]
Because the media flow is generated in the regional headquarters, the operator wants to determine the device in the headquarters to which the media source is connected. The network operator can find out which device is closest to the media source either by looking at the network diagram or by invoking a reverse Mediatrace operation with the media source address as the target. The output of such a reverse Mediatrace operation is shown here:
Because the Mediatrace poll had a destination address of the video endpoint, it travelled all the way to that host. All Mediatrace-enabled devices responded to the poll, and by looking in the show command output, the network operator can see that Switch-H1 is the relevant device. The Mediatrace results shown here also list all the interfaces along the data path. This information is particularly useful for checking QoS settings on all interfaces along a network path.
Now the operator can connect to Switch-H1 and launch a Mediatrace session that gathers performance information about all Mediatrace-enabled devices in the path. The source and destination addresses of the Mediatrace message will be the same as the flow the operator is troubleshooting. Using the same network address for the media flow allows Mediatrace to travel down the same path as the real traffic, even if the addresses can be reached through Equal-Cost Multipath (ECMP). Cisco Express Forwarding (CEF) hashes source and destination Layer 3 addresses to determine the equal-cost path to which packets are sent.
Table 7 below shows the configuration elements of a Mediatrace poll.
Table 7. Mediatrace Poll Configuration Elements
Configuration Element
Description
Path specifier
The path specifier identifies the destination and (optional) source IP addresses of the Mediatrace packet. The addresses need to match those of the actual data flow.
Layer 2 parameters
If Mediatrace is invoked on a Layer 2 switch, these parameters specify through which VLAN it should go.
Performance Monitor parameters
These parameters identify the 5 tuple of media flow for which you want to gather Performance Monitor statistics (source IP address, source Layer 4 port, destination IP address, destination Layer 4 port, and IP protocol).
Mediatrace initiator
Each Mediatrace responder will send Mediatrace reports to this address.
Following are the results for a Mediatrace type Performance Monitor initiated on Switch-H1 in the headquarters:
Request Timestamp: 13:39:40.921 UTC Tue May 3 2011
Request Status: Completed
Number of hops responded (includes success/error/no-record): 3
Number of hops with valid data report: 3
Number of hops with error report: 0
Number of hops with no data record: 0
Detailed Report of collected data:
Number of Mediatrace hops in the path: 3
Mediatrace Hop Number: 1 (host=Router-H1, ttl=254)
Metrics Collection Status: Success
Reachability Address: 19.1.1.2
Ingress Interface: Gi0/1
Egress Interface: Gi0/2
Metrics Collected:
Flow Sampling Start Timestamp: 13:39:06
Loss of measurement confidence: FALSE
Media Stop Event Occurred: TRUE
IP Packet Drop Count (pkts): 0
IP Byte Count (KB): 12299.602
IP Packet Count (pkts): 9062
IP Byte Rate (Bps): 409986
Packet Drop Reason: 0
IP DSCP: 40
IP TTL: 62
IP Protocol: 17
Media Byte Rate Average (Bps): 403945
Media Byte Count (KB): 12118.362
Media Packet Count (pkts): 9062
RTP Interarrival Jitter Average (usec): 24436
RTP Packets Lost (pkts): 0
RTP Packets Expected (pkts): 9075
RTP Packet Lost Event Count: 0
RTP Loss Percent (%): 0.00
Mediatrace Hop Number: 3 (host=Router-B1, ttl=251)
Metrics Collection Status: Success
Reachability Address: 23.1.1.2
Ingress Interface: Gi0/1
Egress Interface: Gi0/2.10
Metrics Collected:
Flow Sampling Start Timestamp: 13:39:06
Loss of measurement confidence: FALSE
Media Stop Event Occurred: TRUE
IP Packet Drop Count (pkts): 0
IP Byte Count (KB): 12185.851
IP Packet Count (pkts): 8977
IP Byte Rate (Bps): 406195
Packet Drop Reason: 0
IP DSCP: 40
IP TTL: 59
IP Protocol: 17
Media Byte Rate Average (Bps): 400210
Media Byte Count (KB): 12006.311
Media Packet Count (pkts): 8977
RTP Interarrival Jitter Average (usec): 23776
RTP Packets Lost (pkts): 104
RTP Packets Expected (pkts): 9081
RTP Packet Lost Event Count: 102
RTP Loss Percent (%): 1.14
Mediatrace Hop Number: 4 (host=Switch-B1, ttl=251)
Metrics Collection Status: Success
Reachability Address: 18.1.1.1
Ingress Interface: Gi1/0/3
Egress Interface: Gi1/0/11
Metrics Collected:
Flow Sampling Start Timestamp: 13:39:06
Loss of measurement confidence: FALSE
Media Stop Event Occurred: TRUE
IP Packet Drop Count (pkts): 0
IP Byte Count (KB): 12185.851
IP Packet Count (pkts): 8977
IP Byte Rate (Bps): 406195
Packet Drop Reason: 0
IP DSCP: 40
IP TTL: 59
IP Protocol: 17
Media Byte Rate Average (Bps): 400210
Media Byte Count (KB): 12006.311
Media Packet Count (pkts): 8977
RTP Interarrival Jitter Average (usec): 23778
RTP Packets Lost (pkts): 104
RTP Packets Expected (pkts): 9081
RTP Packet Lost Event Count: 102
RTP Loss Percent (%): 1.14
Switch-H1#
In the preceding output, the SuperWatchMaker network operator can see that there is a network problem between Router-H1 and Router-B1. The Mediatrace output also shows the ingress interface on Router-B1, so the operator concludes that the problem is most likely in the Multiprotocol Label Switching (MPLS) network. By contacting the ISP, the operator learns that the ISP currently has a problem on an optical link and is in the process of fixing it. SuperWatchMaker's network operator now diverts traffic to the backup link and informs the help desk. In addition, the operator could test the backup link using IP SLA VO prior to moving any live traffic onto that link. This concept is discussed in the "Network Validation" section later in this document.
This section summarizes the commands used in a problem scenario similar to the one just described.
The first command shown here is issued on a router to find the Mediatrace-enabled node closest to a media source. In this example, the command is issued on Router-B1:
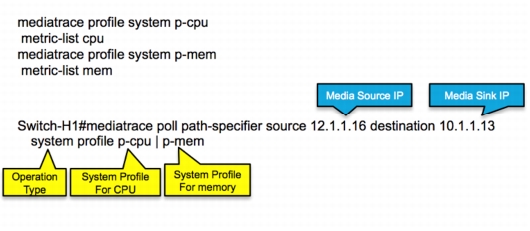
To gather comprehensive performance metrics for an RTP flow, the following command can be used. In the scenario here, the command is issued on Switch-H1:
In addition to the Performance Monitor operation, the Mediatrace system operation is helpful in looking for a problem cause. As part of the system operation, Mediatrace collects interface counters and CPU, and memory statistics along the media path:
By default, a Mediatrace system operation collects interface statistics.
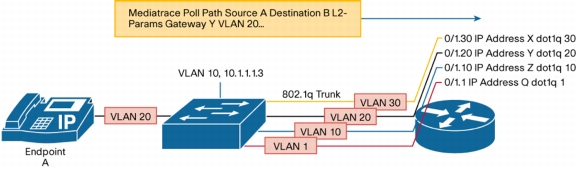
Mediatrace works for Layer 2 and 3 devices. A Layer 2 switch enabled for Mediatrace will respond to a Mediatrace request like any other Mediatrace responder. However, when a Mediatrace operation is initiated on a switch in Layer 2 mode, some additional parameters are required. Figure 15 (below) shows a Mediatrace poll launched on a Layer 2 switch for a media flow originating on endpoint A. To make sure that Mediatrace polls the correct next-hop device, the mediatrace poll command supplies the gateway address for the VLAN in which endpoint A resides. Please note that the switch needs to have Layer 3 connectivity to the destination IP address, i.e. the switch must be able to ping the destination IP address.
Figure 15. Mediatrace Layer 2 Parameters
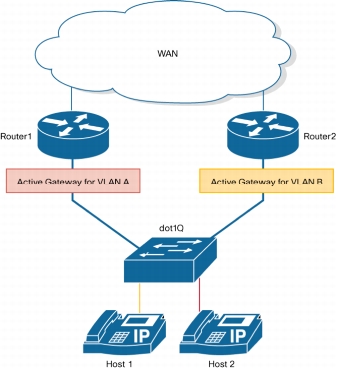
In many LAN designs, Hot Standby Router Protocol (HSRP) or Virtual Router Redundancy Protocol (VRRP), or Gateway Load Balancing Protocol (GLBP), is deployed to provide first-hop redundancy to end hosts. Figure 16 (below) shows a scenario in which two media endpoints reside in different VLANs and their active default gateways reside on distinct routers. Therefore, a Mediatrace operation for a flow originating at Host 1 needs to be sent to Router2, whereas a Mediatrace operation for Host 2 needs to go to Router1.
Figure 16. Mediatrace Initiated on a Layer 2 Switch
In the case of HSRP, specify the standby IP address for the respective VLAN as the gateway (as displayed in the show standby command). In the case of GLBP, identify the router that GLBP selected as the gateway for a given host.
Layer 2 Mediatrace Example
The following example shows how to enable Mediatrace on a Layer 2 switch. The operator supplies the correct gateway and VLAN parameters:
Using the mediatrace poll command, Mediatrace retrieves Performance Monitor statistics from the devices in the SuperWatchMaker network.
Cisco Prime Collaboration Assurance
Cisco Prime™ Collaboration provides application-level monitoring, troubleshooting and reporting for TelePresence calls between CTS, EX, Profile, Integrator C or Quickset series endpoints that are deployed with Cisco Unified Communications Manager or with Cisco Video Communications Server. Data is collected and analyzed from several sources:
• Network device health and system information via SNMP MIB
• Performance monitor statistics via SNMP MIB
• Mediatrace information via Web Services Management Agent
• Endpoint health and system information via integration to the call control.
This tool provides session monitoring beginning with an application view into the TelePresence systems, and includes the ability to utilize Cisco Medianet capabilities in the network to validate whether the network is contributing to issues experienced and reported by the applications.
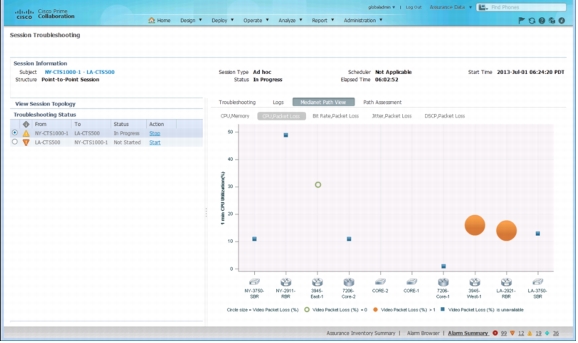
Collection of Mediatrace information occurs when a specific media session is chosen for troubleshooting. The tool automatically configures Mediatrace within the network, collects the data, and displays it graphically as shown in Figure 17 below. A specific point-to-point session is always chosen to be monitored, the network path for that session has been discovered and displayed, and hop-by-hop system health and packet statistics can be viewed. The statistics also include packet loss, jitter, and latency for this specific session.
Figure 17. Cisco Prime Collaboration Assurance
Configuration Requirements for Cisco Prime Collaboration Assurance
For Cisco Prime Collaboration Assurance to dynamically configure Mediatrace and collect data, the Web Services Management Agent must be configured with a privilege 15 username account, which allows the agent to perform configuration changes. In this example a simple local account is configured, but is not restricted to local accounts. Off-device authentication methods such as RADIUS may also be used.
Two base commands for Mediatrace are also configured. From this base configuration CPCA will now be able to add the necessary configuration for a session-specific Mediatrace.
username username privilege 15 secret password
!
!CollabMgr requires priv 15 username for it to work.
!
ip http authentication local
ip http secure-server
!
wsma agent exec profile wsma_listener_https
wsma agent config profile wsma_listener_https
!
wsma profile listener wsma_listener_https
transport https
!
wsma profile listener wsma_listener_ssh
transport ssh
mediatrace responder
mediatrace initiator source-ip source-ip-address
!
When viewing node-level packet statistics for a specific session, other generic packet flows that are passing through this node can be viewed. The data collection is based on Performance Monitor configured on the node. CPCA does not perform any dynamic configuration of Performance Monitor; see the "Traffic Baselining" section in this document on Performance Monitor for configuration details. The statistics, furthermore, are collected via SNMP MIB.
Cisco Prime Infrastructure
Cisco Prime Infrastructure with an Assurance license provides network-based monitoring of application performance for managing an end-to-end user experience. It brings together network-based data from several sources to allow performance monitoring of diverse applications. It includes the Media Monitoring and Performance Monitor capabilities for Cisco Medianet. The following are sources of data from the network:
To deploy Cisco Medianet capabilities with Cisco Prime Infrastructure, the network node may be configured to export Performance Monitor data to the management server. The export of data is accomplished with NetFlow data export. Note that this configuration is similar to any that would be configured for a NetFlow Collector management tool that can interpret the specific Performance Monitor data. The following is an example performance monitor record with data export to a CPAM server:
flow record type performance-monitor PerfMonRecord
match ipv4 protocol
match ipv4 source address
match ipv4 destination address
match transport source-port
match transport destination-port
match transport rtp ssrc
collect application media bytes counter
collect application media bytes rate
collect application media packets counter
collect application media packets rate
collect application media event
collect interface input
collect interface output
collect counter bytes
collect counter packets
collect routing forwarding-status
collect transport packets expected counter
collect transport packets lost counter
collect transport packets lost rate
collect transport round-trip-time
collect transport event packet-loss counter
collect transport rtp jitter mean
collect transport rtp jitter minimum
collect transport rtp jitter maximum
collect timestamp interval
collect ipv4 dscp
collect ipv4 ttl
collect ipv4 source mask
collect ipv4 destination mask
collect monitor event
flow monitor type performance-monitor PerfMon
record PerfMonRecord
exporter PerfMonExporter
flow exporter PerfMonExporter
destination CPAMIP
source Loopback0
transport udp CPAMPort
policy-map type performance-monitor PerfMonPolicy
class class-default
flow monitor PerfMon
monitor metric rtp
min-sequential 2
max-dropout 2
max-reorder 4
monitor metric ip-cbr
rate layer3 packet 1
interface interface-name
service-policy type performance-monitor input PerfMonPolicy
service-policy type performance-monitor output PerfMonPolicy
In this example configuration:
• CPAMIP is the IP address of the Cisco Prime Infrastructure server.
• CPAMPort is the UDP port on which the Cisco Prime Infrastructure server is listening for Performance Monitor data.
• interface-name is the name of the interface(s) where Performance Monitor NetFlow data should be collected.
Cisco Prime Infrastructure-Media Monitoring
Several different views are available for media monitoring. Once Performance Monitor data is being sent to the Cisco Prime Infrastructure from select devices, that data can be used by the following features:
• Incidents Dashboard
• Thresholds Configuration
• 360 Device View
• Voice/Video Detail Dashboard
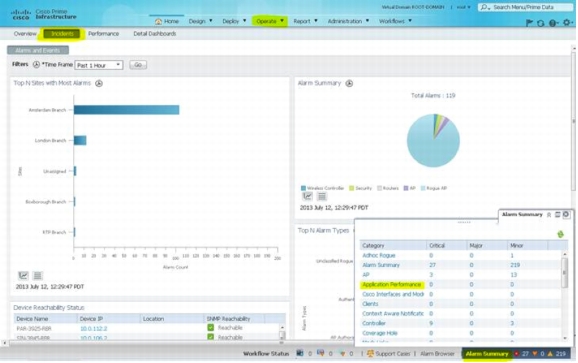
Incidents Dashboard
As highlighted in yellow (highlighting was added) in the display shown in Figure 18 (below), select the Incidents tab from the Operate main menu. This dashboard provides an overall high-level view of alarms and events raised by this system. These alarms are based on the data collected from the various sources and analyzed by the tool.
Figure 18. Incidents Dashboard Display
Alarm Summary
To view the detail of the alarms, hover on the Alarm Summary in the tray at the bottom right of the dashboard. (Refer to Figure 18.) This action will bring up a popup menu that gives a further breakdown of the alarms by class. The Alarm Summary is available on every dashboard and is always accessed from the tray.
For Cisco Medianet information, the Application Performance alarms are of specific interest. Click on the Application Performance link in the Alarm Summary popup menu to view and manage alarms (link highlighted in yellow).
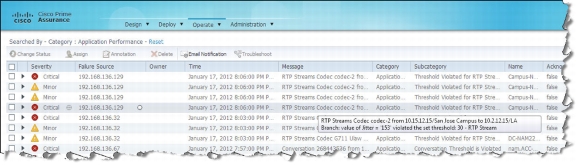
This more detailed alarm dashboard illustrates the management of alarms. Alarms may be assigned, annotated, status changed and emailed from this dashboard. To view the details of a specific alarm, hover over it and a popup window will display with alarm details. For example, in Figure 19 (above), the popup window indicates that the specific RTP stream experienced jitter that was in excess of the administrator controlled threshold of 30 milliseconds.
Threshold Configuration
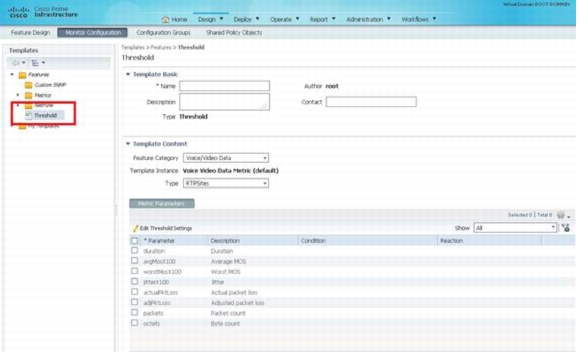
Cisco Prime Infrastructure is a data collector. To enable the alarms and events for Cisco Medianet data, thresholds that define the service-level goals for the network must be set up. Thresholds are configured via the creation of templates. Figure 20 (below) provides an example of a threshold set for monitoring jitter and packet loss on RTP streams from the Monitoring Templates dashboard.
Figure 20. Template Configuration for Setting Thresholds for Monitoring Jitter and Packet Loss on RTP Streams
Thresholds specify a Feature Category (Voice/Video Data) in this case, and a Type (RTPSites). The Type defines a filter of devices or device groups that the threshold is applied for.
Device 360 View
To aid in troubleshooting, additional data can be viewed from the device that originated the data that Cisco Prime Infrastructure triggered an alarm about. As shown in Figure 21 (below), by hovering next to the Failure Source, a popup window appears that filters the database and displays a 360 view of all data collected about this device. Overall system health can be seen, as well as any other alarms raised for this device.
Figure 21. Device 360 View (Popup Window)
Voice/Video Detail Dashboards
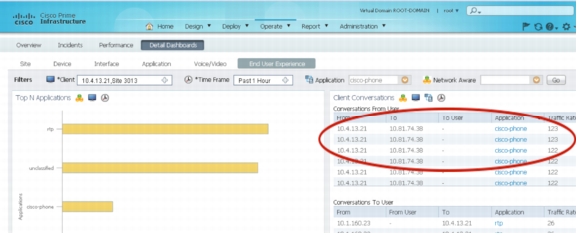
Detail dashboards (see Figure 22, below) provide groupings of information that are of a specific type. A specific dashboard is available for voice and video information that provides the following information:
• Worst Site-to-Site Connections by Jitter
• Worst Site-to-Site Connections by Packet Loss
• RTP Connections Details
• Worst RTP Streams by MOS
• Top RTP Stream by Locations
Figure 22. Voice/Video Detail Dashboards
From this dashboard it is easy to quickly focus on problem areas for media streams and view specific session data or site-based data (Figure 23 & 24).
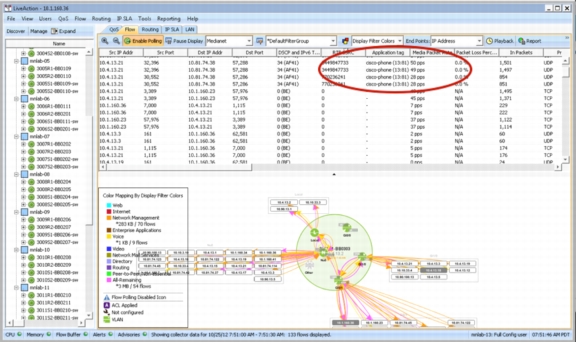
Figure 23. List of RTP Conversations that can be Troubleshooted
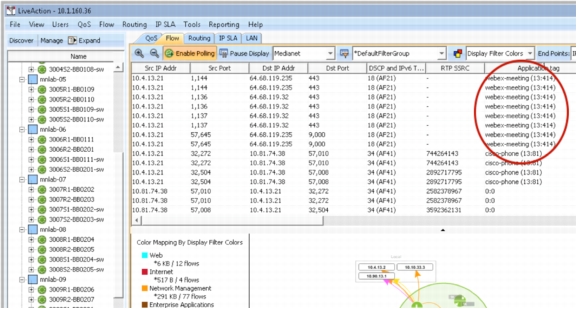
Figure 24. Troubleshooting Output Using Mediatrace
For more information about the Cisco Prime product portfolio, go to www.cisco.com/go/prime.
Other Fault Management Deployment Options
The deployment option described in the "Isolating a Network Problem Using Mediatrace" section earlier in this document assumes that Performance Monitor is invoked by Mediatrace only when there is a network problem.
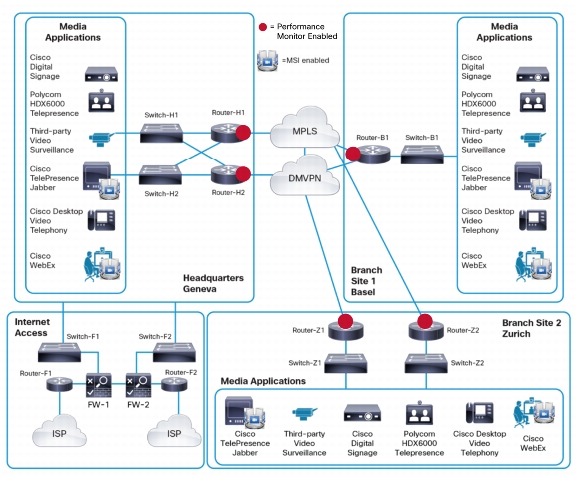
Another option is to deploy Performance Monitor on all network nodes and let it gather performance statistics continuously. When coupled with a powerful NetFlow collector and analyzer, this deployment option would supersede the Mediatrace Performance Monitor operation, because all current and historical fault statistics could be retrieved from the NetFlow analyzer (see Figure 25 below)
Figure 25. Media Monitoring Enabled on All Network Nodes
Network Validation
This section discusses IP SLA VO and how it can be used to test the network's readiness for media applications.
Validating IP SLAs for Video Applications
Figure 26 (below) shows a synthetic video flow.
Figure 26. Creating a Synthetic Video Flow
Deploy a new Cisco TelePresence endpoint here in one of the branch sites in the reference topology.
When a new Cisco TelePresence System is added, provision the network with additional bandwidth and adjust the QoS configuration so that Cisco TelePresence traffic is treated according to the IP SLAs in place. Using IP SLA VO, the operator can test the QoS configuration with a synthetic media flow that mimics real Cisco TelePresence traffic, and validate the IP SLAs needed for that application before the system goes live.
IP SLA VO creates a unidirectional RTP flow from the IP SLA initiator to the responder.
Note: It is considered a good practice to configure the IP SLA peers as close as possible to the real endpoint. Ideally, a peer should be configured on the same access switch and in the same VLAN in which the media endpoint resides.
Deployment Configuration Example: IP SLA VO
To model a realistic Cisco TelePresence call, configure the IP SLA initiator and responder on a pair of IP SLA VO-capable devices (see Figure 27 below).
Figure 27. IP SLA VO
Figure 27 shows that the switches in both the headquarters and branch site are configured with an IP SLA VO initiator and responder. The full configuration for both switches is shown here:
Configuration on Switch-B1
Configuration on Switch-H2
ip sla 1
video <H2> 20010 source-ip <B1> source-port 27010 profile TELEPRESENCE
duration 60
frequency 75
ip sla schedule 1 life forever start-time now
ip sla enable reaction-alerts
ip sla responder
ntp server <network address of NTP server>
ip sla 1
video <B1> 27010 source-ip <H2> source-port 20010 profile TELEPRESENCE
duration 60
frequency 75
ip sla schedule 1 life forever start-time now
ip sla enable reaction-alerts
ip sla responder
ntp server <network address of NTP server>
After applying this configuration, both switches will send a UDP RTP stream that looks to the network like a Cisco TelePresence 1000 1080p call. The default duration for IP SLA VO is 20 seconds, and the default frequency is 15 minutes. Here, the duration of a call is configured for 60 seconds, so after about 75 seconds the IP SLA results can be retrieved from both switches.
The duration of the synthetic Cisco TelePresence call in the example is configured as 1 minute. After that, IP SLAs have 15 seconds to compute the results before starting the next operation.
The results of the configuration are shown here:
Switch-B1#show ip sla statistics 1
IPSLAs Latest Operation Statistics
IPSLA operation id: 1
Type of operation: video
Latest operation start time: 08:41:08.419 UTC Tue Apr 12 2011
Latest operation return code: OK
Packets:
Sender Transmitted: 275833
Responder Received: 275833
Responder Over Timeout: 0
Responder Over Threshold: 0
Latency one-way time:
Number of Latency one-way Samples: 189111
Source to Destination Latency one way Min/Avg/Max: 1/0/73 milliseconds
NTP sync state: SYNC
Inter Packet Delay Variation, RFC 5481 (IPDV):
Number of SD IPDV Samples: 189117
Source to Destination IPDV Min/Avg/Max: 0/1/72 milliseconds
Packet Loss Values:
Loss Source to Destination: 0
Source to Destination Loss Periods Number: 0
Source to Destination Loss Period Length Min/Max: 0/0
Source to Destination Inter Loss Period Length Min/Max: 0/0
Out Of Sequence: 0 Tail Drop: 0
Number of successes: 1
Number of failures: 0
Operation time to live: Forever
Now the operator can compare the packet drop and one-way delay values with the IP SLA targets for that application.
Note: For one-way delay measurement, Network Time Protocol (NTP) needs to be enabled on the IP SLA VO initiator and responder.
After network validation is complete, the synthetic Cisco TelePresence streams can be disabled:
Switch-B1(config)#no ip sla schedule 1
Switch-H1(config)#no ip sla schedule 1
Validating QoS Implementation Using IP SLA VO and Mediatrace
QoS is essential to a satisfying end-user experience for media applications. Sometimes it is hard to verify that QoS is working as designed. IP SLA VO is useful for verifying that application media flows are being classified and marked according to the enterprise QoS design, and end up in the queue that has been provisioned for them. You can apply this verification to the reference network.
The switches are configured to trust QoS markings coming from the Cisco TelePresence System (Cisco TelePresence bearer traffic is marked with CS4), and the WAN routers are provisioned with a low-latency queue for Cisco TelePresence traffic.
IP SLA VO marks packets by default with CS4. This marking can be verified with the show ip sla configuration command.
To verify that QoS is working as expected for the new Cisco TelePresence System installation, perform the following steps (see Figure 28 below):
• Verify that synthetic Cisco TelePresence bearer traffic preserves the correct DSCP marking across the system.
• Verify that synthetic Cisco TelePresence streams reach the correct queue on the WAN routers.
Figure 28. Verification of QoS for the new Cisco TelePresence System Installation
Switch-H1 and Switch-B1 are used again to generate an artificial Cisco TelePresence call (see the "Deployment Configuration Example: IP SLA VO" section earlier in this document for a detailed configuration).
The SuperWatchMaker network is enabled for Mediatrace, so the network operator can now invoke a Mediatrace poll to display network path, DSCP value, and performance statistics for intermediate nodes:
Validating Performance Monitor Implementation Using IP SLA VO
The "Validating IP SLAs for Video Applications" section earlier in this document discusses how Performance Monitor to retrieve performance metrics for live media flows can be deployed. Because IP SLA Video Operation is creating RTP streams, the Performance Monitor configuration can be tested using IP SLAs VO.
Configuration Example
The branch-site routers are configured with a Performance Monitor policy as discussed in the "Traffic Baselining" section earlier in this document. To display the Cisco TelePresence flow, you can use the following command:
Here is a sample show command output for a Cisco TelePresence flow generated by IP SLA VO and monitored on the branch-site router:
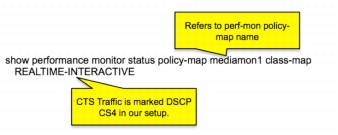
Router-B1#show performance monitor status policy-map mediamon1 class-map REALTIME-INTERACTIVE
Codes: * - field is not configurable under flow record
NA - field is not applicable for configured parameters
Cisco Medianet Autoconfiguration Solution for Cisco Digital Signage
This section discusses how the network operator of SuperWatchMaker can use Autoconfiguration capabilities to ease the deployment of Cisco DMPs. SuperWatchMaker wants to deploy a large number of Cisco DMPs in the Zurich branch. To ease the deployment, the following Cisco Medianet capabilities are used:
• Auto Smartports
• Location
• Service discovery
• Autoregistration
Figure 29 (below) depicts the SuperWatchMaker network with Cisco DMM and a central Dynamic Host Configuration Protocol (DHCP) server. The new Cisco DMPs in Zurich will register with the Cisco DMM in Geneva. They retrieve the Layer 3 address of the Cisco DMM from the DHCP server and their location information from the switch.
Figure 29. Cisco Digital Media Systems (DMS) Deployment
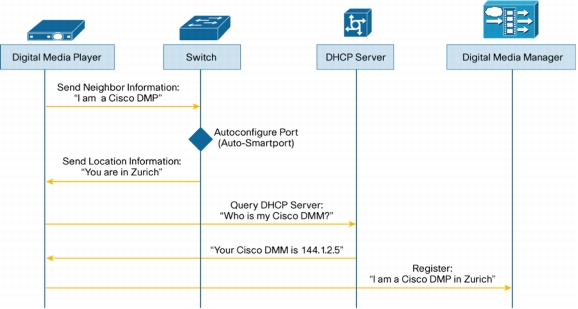
Figure 30 shows the interactions between the Cisco DMP, the switch, the DHCP server, and the Cisco DMM. As soon as the switch detects a Cisco DMP, it configures the port with the correct security, QoS, and VLAN settings for Cisco DMS. Then, it conveys location information to the Cisco DMP. The Cisco DMP is assigned an IP address, at the same time that it asks for the IP address of a Cisco DMM. The Cisco DMP registers with the Cisco DMM that supplied location information. The administrator can then assign location-specific media content to that digital sign such as a media file in a particular language.
Figure 30. Interactions Between Cisco DMP, the Switch, the DHCP Server and the Cisco DMM
Deployment Configuration Example: Digital Signage
Table Figure 8 (below) presents a Cisco Medianet Autoconfiguration deployment configuration example for Digital Signage.
Table 8. Configuration Example: Cisco Medianet Autoconfiguration for Digital Signage
Solution Element
Cisco DMP
Cisco DMPs do not require any configuration. Cisco Medianet features are enabled by default.
Switch-Z1 and Switch-Z2
macro auto global processing
location civic-location identifier L1
additional-location-information zurich
building 1
city Zurich
country CH
primary-road-name Hauptstrasse
state ZH
interface range GigabitEthernet 1/1 - 48
location civic-location-id L1
macro auto execute CISCO_DMP_EVENT builtin CISCO_DMP_AUTO_SMARTPORT ACCESS_VLAN=100
This command enables Auto Smartports globally on the switch.
In this example, the location information is configured to be identical for all ports on the two switches in the Zurich branch office.
This command assigns the civic location to a series of access ports.
This command changes the VLAN parameter for the DMP from the default 1 to 100.
Router-RZ1 and Router-RZ2
!
interface Vlan x
ip helper-address 172.16.5.105
end
On the access VLAN, specify the DHCP server address so that the device can convert Bootstrap Protocol (BOOTP) broadcasts to unicast.
DHCP Server
class "DMM" {
match if option option-125 = "\x00\x00\x00\x09\x06\x13\x04\x01\x44\x4d\x4d";
This example list the configuration that needs to be added to a Cisco IP Solution Center (ISC) DHCP server. Other products use similar syntax. The Cisco DMPs discover the Cisco DMM address by sending a DHCPINFORM message with a specific option 125 to the DHCP server. The corresponding reply (DHCPACK) should contain the IP address of the Cisco DMM. In this example, the highlighted section (\xac\x10\x05\xd2\) denotes the IP address of the Cisco DMM, which is 172.16.5.210 in hexadecimal format.
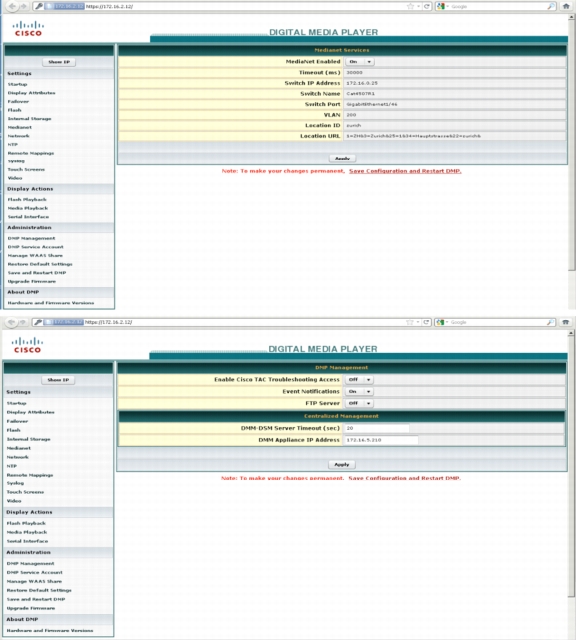
Figure 31 through Figure 33 (below) shows the Cisco DMP service discovery process. The DMP-1 and DMP-2 screens are from the web interface of the Cisco DMP. The other screens are from Cisco Digital Media Manager.
Figure 31, showing screens from Cisco DMPs in Zurich, indicate that location information has been learned from the switch and that the Cisco DMM IP address was retrieved from the DHCP server through DHCP option 125.
Figure 31. The Cisco DMP Discovery Process
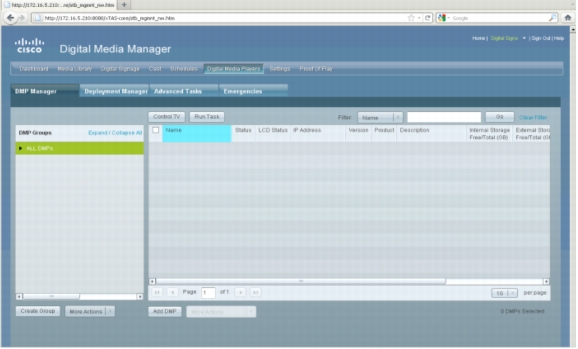
Figure 32 (below) shows the Cisco DMM screen before the Cisco DMPs have registered. There is a default Cisco DMP group called All-DMPs.
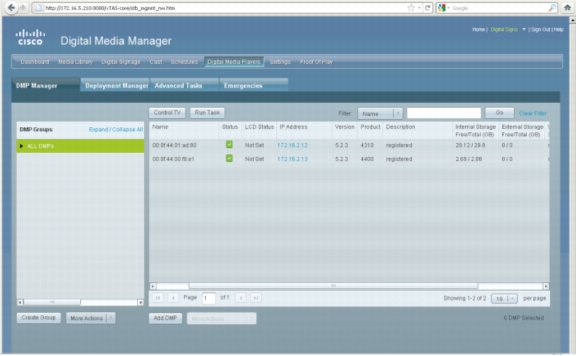
After the Cisco DMPs have learned the Cisco DMM address, they register with the Cisco DMM. In Figure 35, so far two Cisco DMPs in Zurich have registered.
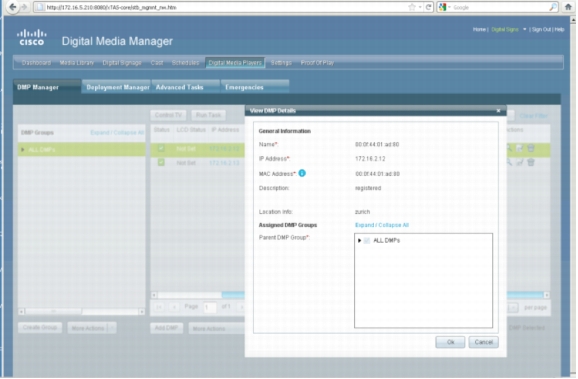
The location information for a given Cisco DMP can be displayed in the Cisco DMM (see Figure 36). Now the administrator can assign media content based on the location to this specific Cisco DMP or can create a group, such as for a particular language.
Figure 32. The Cisco DMM Screen Before the Cisco DMPs Have Registered
Figure 33. The Cisco DMM Screen After Two of the Cisco DMPS Have Registered
Figure 34. Location Information on the Cisco DMM
Table 9 below lists the software versions used in this Cisco DMS deployment example.
Table 9. Software Versions Used in Cisco DMS Deployment Example
These set of commands create a DHCP pool for the IP Camera based on its MAC address. It provides information to camera; that is, IP address, DNS, Default Router, and Video Surveillance Management Server (VSMS) information.
Interface configured triggered by IP Camera at the port
Switch#sh location civic-location identifier 1
Civic location information
--------------------------
Identifier : 1
Building : 1
Primary road name : HAUPTSTRASSE
City : ZURICH
State : ZH
Country : CH
Additional location : ZURICH
Switch#sh run int f0/2
!
interface FastEthernet0/2
switchport access vlan 2003
switchport mode access
switchport block unicast
switchport port-security
srr-queue bandwidth share 1 30 35 5
priority-queue out
mls qos trust device ip-camera
mls qos trust dscp
macro description CISCO_IPVSC_EVENT
auto qos video ip-camera
spanning-tree portfast
spanning-tree bpduguard enable
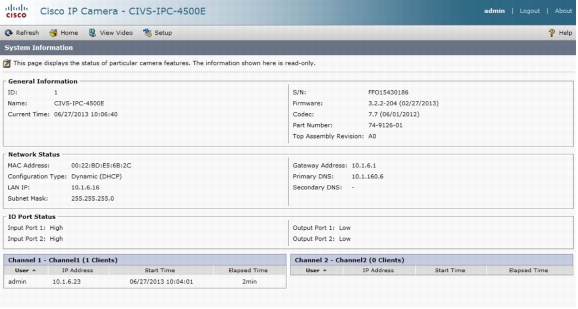
Figure 35 (below) is CIVS-IPC screenshot taken from the web interface of the Cisco camera. It displays the IP address information that has been learned from the switch and that the Cisco VSMS IP address was retrieved from the DHCP server through DHCP option 125.
Figure 35. Cisco IP Surveillance Camera Discovery Process
After the Cisco IP Surveillance Camera learns its IP address, it formats a registration message towards the Cisco Video Surveillance Management Server (VSMS).
The media server relays the message to the Cisco Video Surveillance Operations Manager (VSOM). The VSOM applies the template for the camera and assigns the camera to a media server, as show in Figure 36.
Figure 36. The Cisco Video Surveillance Operations Manager-once the camera is registered.
Table 11 (below) lists the software versions used in the Cisco IP Surveillance Camera deployment example.
Table 11. Software Versions Used in the Cisco IP Surveillance Camera Deployment Example.
Platform
Software Release
Cisco CIVS-IPC-4500E
Version 3.2.2-204
Router
Cisco IOS Software, C2900 Software (C2900-UNIVERSALK9-M), Version 15.3(1)T
Switch
Cisco IOS Software, C2960SM Software (C2960SM-LANBASEK9-M), Version 15.0(2)SE2
Cisco Video Surveillance Operations Manager (VSOM)/Cisco Video Surveillance Management Server (VSMS)
Network operators want to understand how their network is being used and by which applications. Traditionally, this knowledge has been available by exporting information about the flows traversing the network using Traditional and Flexible NetFlow (FNF),2 and then analyzing them using a Network Management System (NMS). Exported fields that can be used to classify flows range from IP addresses, port numbers, DSCP markings (assuming that the operator has classified applications based on DSCP markings), and application names using NBAR, among other techniques. In an earlier section it was illustrated how Performance Monitor3 can be used to gather further insight into the health of these flows by collecting statistics such as packet loss, jitter, round-trip-time and bandwidth used for the individual flows.
The network operator of the SuperWatchMaker network, in addition to collecting information about flows traversing the network, also wants to identify what applications they belong to. The operator is having a difficult time doing so by using the traditional methods, since this person does not understand the applications' behavior due to:
• Several applications use the same source and destination IP addresses
• It is difficult to associate applications to port numbers
• It is difficult to have unique DSCP-to-applications mapping
In this section of the document, it will be illustrated how to deploy MSI and MSP to get visibility for the applications that are using the network. Flow Metadata generated by MSI/MSP is integrated with Performance Monitor to identify which flows belong to which applications, thereby providing application visibility. NBAR2 is a complementary feature that can be used together with MSI and MSP. How to deploy NBAR2, and show application visibility through its integration with Flexible NetFlow will also be discussed.
In the following deployment scenarios, three deployment scenarios to achieve application visibility will be addressed:
• MSI integration with Performance Monitor
• MSP integration with Performance Monitor
• NBAR2 integration with Flexible NetFlow
MSI Integration with Performance Monitor
Table 12 (below) illustrates the Cisco Medianet components and their location of deployment.
Table 12. Cisco Medianet Components for Application Visibility
Cisco Medianet Components
Location of Deployment
Flow Metadata Originator: MSI
Endpoints with MSI
Endpoints
Performance Monitor
WAN edge, campus and branch routers and switches
Network Management Systems
Cisco Prime Infrastructure
Third-party NMS
Campus/Branch/Datacenter
Performance Monitor deployment in the SuperWatchMaker network has been illustrated in depth previously in this guide. Performance Monitor has been enabled in WAN edge, campus routers and switches, branch routers and switches and Internet edge routers as shown in Figure 37 (below). It is not mandatory to deploy Performance Monitor in all of the network nodes. It is however recommended, since the network operator will receive reports indicating the state of flows from each node. Performance Monitor deployed on even a single network node will add value to the SuperWatchMaker network.
In this deployment scenario, Flow Metadata is generated by the MSI installed on the endpoints. Figure 38 illustrates where to enable the Flow Metadata feature on the network nodes. Enabling the Flow Metadata feature on the network node will enable the network node to process Flow Metadata packets received from the MSI endpoint. The Flow Metadata database is then built on the node, which can be used for:
• Application visibility
• Integration with QoS
Similar to the deployment of Performance Monitor, it is not mandatory to deploy Flow Metadata on every network node. If a network node that has Performance Monitor enabled needs to identify the flow application name, vendor and other information provided by Flow Metadata, then Flow Metadata should be enabled on the same network node. If a network operator has designed QoS policies using Flow Metadata attributes on a network node (as will be discussed in the next use case in this document), then it is mandatory to enable Flow Metadata on this network node.
IOS Configuration 1 provides a step-by-step guide for deploying Flow Metadata and Performance Monitor for application visibility.
Figure 37. MSI and Performance Monitor Deployment for "Getting Visibility" Use Case
Figure 38. Deploy Flow Metadata on Campus/Branch Network Nodes
• The MSI software needs to be downloaded and installed separately. It is available for download on Cisco.com along with the Jabber for Windows application.
• As part of its install MSI, will also install a network driver applied to each interface.
• MSI itself will run as a headless windows service.
In soft endpoints, multiple applications installed on the end-system will use the same installation of MSI. For instance, if both Jabber for Windows and WebEx are running on the same laptop, they both will use the same installation of MSI.
Hard endpoints have MSI integrated in the image.
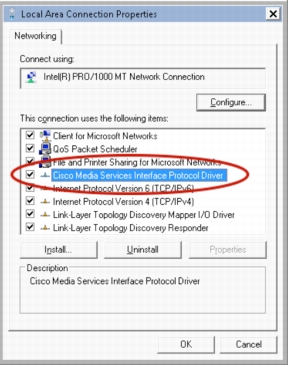
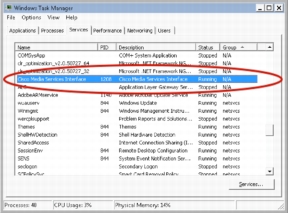
In a Windows based laptop, go to "Network Connections".
Verify the existence of "Cisco Media Services Interface Protocol Driver".
Verify that the process "Cisco Media Services Interface" is in the running state.
metadata flow
On a layer 2 switch, the following configuration below is required for metadata to be forwarded to the switch's CPU:
ip rsvp snooping
Or:
ip rsvp snooping vlan <id>
Configure Flow Metadata on the routers and switches to be able to understand and process metadata messages coming from the MSI endpoints. For a more detailed Flow Metadata configuration, refer to Flow Metadata configuration guide.1
On the Catalyst 4K, due to defect CSCub10690, an explicit vlan needs to be specified when enabling rsvp snooping.
As previously mentioned in this document, it is not mandatory to configure metadata on all routers and switches, but is recommended, since the Flow Metadata features can be utilized by network nodes for a variety of purposes.
flow record type performance-monitor pm-r-rtp
description flow record RTP
match ipv4 protocol
match ipv4 source address
match ipv4 destination address
match transport source-port
match transport destination-port
match transport rtp ssrc
collect routing forwarding-status
collect ipv4 dscp
collect ipv4 ttl
collect transport packets expected counter
collect transport packets lost counter
collect transport packets lost rate
collect transport event packet-loss counter
collect transport rtp jitter mean
collect transport rtp jitter minimum
collect transport rtp jitter maximum
collect interface input
collect interface output
collect counter bytes
collect counter packets
collect counter bytes rate
collect timestamp interval
collect application name
collect application media bytes counter
collect application media bytes rate
collect application media packets counter
collect application media packets rate
collect application media event
collect monitor event
collect application version
collect application vendor
Define the performance monitor flow record for Jabber for Windows flows. Jabber for Windows audio and video flows are transported via RTP. Thus, it is essential to match and collect RTP specific fields.
"Application name" collected will be exported via Flexible NetFlow.
Note that
"Collect application name", "collect application version", "collect application vendor" is not available on the Catalyst 4k for image versions referred to in Table 1.
This will apply only to ISR G2 and ASR1k series.
Note that
IOS Flexible NetFlow record definition also offers the option to "collect application name". However, the application name is only from NBAR discovery and not metadata. In the case of a performance monitor flow record, the information is sourced from both NBAR and Flow Metadata. Information such as application version and vendor is not available for Flexible NetFlow.
flow record type performance-monitor pm-r-tcp
description flow record TCP
match ipv4 protocol
match ipv4 source address
match ipv4 destination address
match transport source-port
match transport destination-port
collect routing forwarding-status
collect ipv4 dscp
collect ipv4 ttl
collect transport round-trip-time
collect transport event packet-loss counter
collect interface input
collect interface output
collect counter bytes
collect counter packets
collect counter bytes rate
collect timestamp interval
collect application name
collect application media bytes counter
collect application media packets rate
collect application media event
collect monitor event
collect transport round-trip-time min
collect transport round-trip-time max
collect transport round-trip-time sum
collect transport round-trip-time samples
collect application version
collect application vendor
!
Define flow record for WebEx flows. Most WebEx flows are TCP based flows. Thus, it is essential to match and collect TCP specific fields.
"Application name" collected will be exported via Flexible NetFlow.
Note that
"Collect application name", "collect application version", "collect application vendor" is not available on the Catalyst 4k for image versions referred to in Table 1.
So, this will apply only to ISR G2 and ASR1k series.
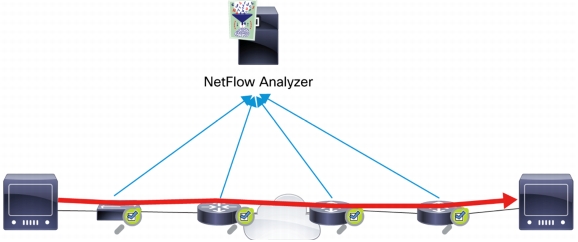
flow exporter xport1
destination 10.1.160.37
source Loopback0
transport udp 2055
template data timeout 60
option interface-table
option application-table
!
Define flow exporter. Here, the exporter is configured to export information via NetFlow v9 packets destined to 10.1.160.37 and to UDP port 2055. The "option application table" ensures that the application name data exported in the NetFlow data records can be decoded using the application table.
Note that
"Option application table" is available only on the ISRG2 and ASR1k series.
flow monitor type performance-monitor pm-m-rtp
record pm-r-rtp
exporter xport1
!
Configure a flow monitor and associate the flow record for RTP flows and the exporter.
flow monitor type performance-monitor pm-m-tcp
record pm-r-tcp
exporter xport1
!
Configure a flow monitor and associate the flow record for TCP flows and the exporter.
class-map match-any VOIP
match ip dscp ef
class-map match-any BROADCAST-VIDEO
match ip dscp cs5
class-map match-any CONTROL
match ip dscp cs6
class-map match-any TRANSACTIONAL
match ip dscp af21
class-map match-any STREAMING
match ip dscp af31
class-map match-any SIGNALING
match ip dscp cs3
class-map match-any REALTIME-INTERACTIVE
match ip dscp cs4
class-map match-any VIDEO-CONF
match ip dscp af41
!
Class maps for the 8-class based QoS system. Each class is matching packets based on DSCP.
policy-map type performance-monitor pm-1
class VOIP
flow monitor pm-m-rtp
class BROADCAST-VIDEO
flow monitor pm-m-rtp
class STREAMING
flow monitor pm-m-tcp
class REALTIME-INTERACTIVE
flow monitor pm-m-rtp
class VIDEO-CONF
flow monitor pm-m-rtp
class TRANSACTIONAL
flow monitor pm-m-tcp
class SIGNALING
flow monitor pm-m-tcp
class CONTROL
flow monitor pm-m-tcp
Define a policy map of type performance-monitor. 8-class based system recommended in QoS SRND 4.02 is being used here. The policy-map is of type performance-monitor.
Jabber for Windows matches to class VIDEO-CONF and WebEx flows match to TRANSACTIONAL class. This is assuming that the flows for these applications have the correct DSCP. Marking these flows with the correct DSCP marking is shown in the "Ensuring QoS" section using Flow Metadata.
interface gig 0/1
service-policy type performance-monitor input pm-1
service-policy type performance-monitor output pm-1
Apply the policy-map in the ingress and/or egress direction. The interfaces can be chosen by the network administrator. Typically, it can be the WAN interface or the LAN interface.
Note:
Not every platform supports the application of performance-monitor in outbound direction.
Verification of "MSI Integration with Performance Monitor"
Verification Using CLI
• On network nodes where Flow Metadata and Performance Monitor are configured, use the show command listed in IOS Output 1.
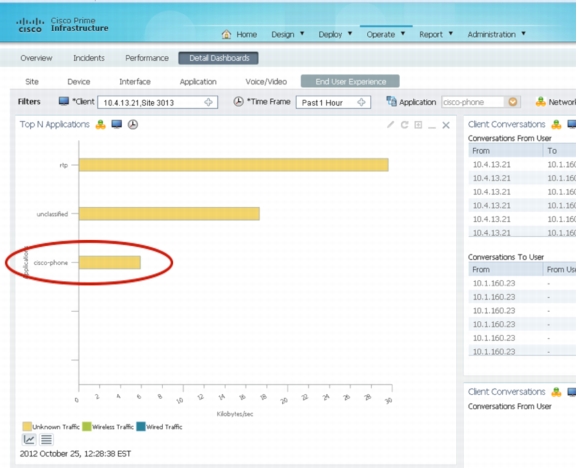
• Performance Monitor associated the Jabber for Windows flows with the `cisco-phone' application. This association was made using the Flow Metadata database that was developed on the network node. The network node uses the Flow Metadata messages sent by MSI to populate the database and associate the flows. There are 2 constituent flows: audio and video for Jabber for Windows.
IOS Output 1: Performance Monitor Associating Jabber for Windows Flows with Application Name
Router-H1#show performance monitor status policy-map pm-1 class-map VIDEO-CONF
Codes: * - field is not configurable under flow record
NA - field is not applicable for configured parameters
UR - field is unreportable for configured paramaters
Match: ipv4 source address = 10.4.13.21, ipv4 destination address = 10.81.74.38, transport source-port = 32272, transport destination-port = 57010, transport rtp ssrc = 744264143, ip protocol = 17,
Policy: pm-1, Class: VIDEO-CONF
routing forwarding-status : Forward
transport packets expected counter : 7095
transport packets lost counter : 0
transport packets lost rate ( % ) : 0.00
transport event packet-loss counter : 0
transport rtp jitter mean (usec) : 16424
transport rtp jitter minimum (usec) : 341
transport rtp jitter maximum (usec) : 765208
interface input : Gi1/0
interface output : Gi0/1
counter bytes : 851400
counter packets : 7095
counter bytes rate : 5791
application media bytes counter : 652740
application media bytes rate : 4440
application media packets counter : 7095
application media packets rate : 48
application media event : Normal
monitor event : false
application version : 9.1.0
application vendor : Cisco Systems, Inc.
ip dscp : 0x22
ip ttl : 127
application id : cisco-phone
Codes: * - field is not configurable under flow record
NA - field is not applicable for configured parameters
UR - field is unreportable for configured paramaters
Match: ipv4 source address = 10.4.13.21, ipv4 destination address = 10.81.74.38, transport source-port = 32504, transport destination-port = 57008, transport rtp ssrc = 2892717795, ip protocol = 17,
Policy: pm-1, Class: VIDEO-CONF
routing forwarding-status : Forward
transport packets expected counter : 4031
transport packets lost counter : 0
transport packets lost rate ( % ) : 0.00
transport event packet-loss counter : 0
transport rtp jitter mean (usec) : 6563
transport rtp jitter minimum (usec) : 4
transport rtp jitter maximum (usec) : 751475
interface input : Gi1/0
interface output : Gi0/1
counter bytes : 193488
counter packets : 4031
counter bytes rate : 1316
application media bytes counter : 80620
application media bytes rate : 548
application media packets counter : 4031
application media packets rate : 27
application media event : Normal
monitor event : false
application version : 9.1.0
application vendor : Cisco Systems, Inc.
ip dscp : 0x22
ip ttl : 127
application id : cisco-phone
• IOS Output 2 shows Performance Monitor detecting WebEx flows by associating those flows with the application name `webex-meeting'.
IOS Output 2: Performance Monitor Associating WebEx Flows with Application Name
Router-H1#show performance monitor status policy-map pm-1 class-map TRANSACTIONAL
Codes: * - field is not configurable under flow record
NA - field is not applicable for configured parameters
UR - field is unreportable for configured paramaters
Match: ipv4 source address = 10.4.13.21, ipv4 destination address = 64.68.119.32, transport source-port = 1137, transport destination-port = 443, ip protocol = 6,
Policy: pm-1, Class: TRANSACTIONAL
routing forwarding-status : Forward
transport round-trip-time (msec) : NA
transport round-trip-time sum (msec) : NA
transport round-trip-time samples : NA
transport event packet-loss counter : 0
interface input : Gi1/0
interface output : Gi0/1
counter bytes : 2257
counter packets : 48
counter bytes rate : 25
application media bytes counter : 337
application media packets counter long : 48
application media packets rate : 0
application media event : Normal
monitor event : false
transport round-trip-time min (msec) : NA
transport round-trip-time max (msec) : NA
application version : T28.4
application vendor : Cisco Systems, Inc.
ip dscp : 0x12
ip ttl : 127
application id : webex-meeting
Verification Using NMS
Performance Monitor data can be exported to a NetFlow collector via Flexible NetFlow for further processing and reporting as shown in Figure 39 (below). This is done by configuring NetFlow exporter on the network nodes. This has been illustrated in IOS Configuration 1. By default, this export happens every 30 seconds. The NMS can then group this data coming from several network nodes and answer questions such as:
• Where did the degradation of the video session happen?
• Which flows have the highest jitter?
• Did the service provider impart any packet losses or additional jitter that is violating the SLA that service provider agreed upon?
Figure 39. The Performance Monitor Exporting to a NetFlow Analyzer
Several network management tools, both Cisco and third-party vendors, support Performance Monitor. For a complete listing of third-party vendors, refer to the Cisco Developer Network.4 In this section, two NMS will be covered:
• Cisco Prime Infrastructure
• LiveAction ActionPacked, a third-party vendor
When Performance Monitor exports application names, it uses the same Engine ID: application ID as NBAR. Thus, any NMS that can recognize NBAR application IDs, can recognize Flow Metadata application names. Figure 40. and Figure 41 are screenshots of Cisco Prime Infrastructure reporting Jabber for Windows flows as a `cisco-phone' application.
Figure 40. Cisco Prime Infrastructure Detecting a `cisco-phone' Application
Figure 41. Cisco Prime Infrastructure Providing Statistics for `cisco-phone' Flows
Figure 42 and Figure 43 are screenshots for LiveAction depicting Jabber for Windows and WebEx flows respectively. The Engine ID: Application ID of 13:81 and 13:414 for `cisco-phone' and `webex-meeting' respectively can also be seen in the screenshots.
Table 14 (below) illustrates the Cisco Medianet components and their location of deployment.
Table 14. Cisco Medianet Components for "Getting Visibility" Via MSP
Cisco Medianet Components
Location of Deployment
Flow Metadata originator: MSP
Access switch/router closest to the endpoint
Performance Monitor
WAN edge, campus and branch routers and switches
Network Management Systems
Cisco Prime Infrastructure
Third-party Vendors
Campus/branch/datacenter
Figure 44. Deploying MSP in Network Nodes Closest to the Endpoints
In this deployment scenario, MSP is configured on the network nodes closest to the endpoint. Sometimes the closest switch might not support MSP, in that case the closest router should be used as the MSP. In Figure 44. Switch-Z1 and Switch-Z2 are not capable of MSP, so MSP is deployed on Router-Z1 and Router-Z2 instead. Switch-H1, Switch-H2 and Switch-B1 are capable of MSP, and they are close to the endpoint, so MSP is deployed on these switches. MSP is designed for endpoints that do not have MSI installed in them. MSP inspects signaling protocols like SIP, RTSP, and H.323 when the endpoint is establishing a media session. MSP then generates Flow Metadata on behalf of the endpoint. Flow Metadata packets then travel the same path as the media flows. The Flow Metadata database is then built on the network node which can be used for:
• Application visibility
• Integration with QoS
Performance Monitor and Flow Metadata are enabled in the SuperWatchMaker network in a similar way to Figure 37 and Figure 38 respectively. For this deployment scenario, we will use Polycom HDX 6000 endpoints installed in SuperWatchMakers's campus and branch networks.
Table 15. IOS Configuration 2: Configuring MSP on Network Nodes
Configuration
Description
profile flow
media-proxy services profile PLY
metadata
!
media-proxy services PLY
metadata flow
Enable MSP on the network node closest to the endpoint
The MSP profile PLY will generate Flow Metadata for flows that MSP detects. In this specific deployment scenario, MSP will detect Polycom flows and generate metadata for Polycom flows.
Flow Metadata packets will then traverse the network taking the same path as the media packets.
Performance Monitor configuration will be the same as in IOS Configuration 1.
Metadata information originated by MSP can be used for application visibility by "collect application name"
Verification of "MSP Integration with Performance Monitor"
Verification Using CLI
• MSP on Swich-H1 detects Polycom flows and generates Flow Metadata that will traverse the downstream network nodes.
• IOS Output 3 shows the Flow Metadata table populated with information about Polycom flows, including audio or video flow, application name, clock rate, codec type etc. on downstream network node Router-H1.
• Performance Monitor will collect the application name via its corresponding flow record field and export it to the NMS. At the time of the this publication, there is no integration between Performance Monitor fields like "collection application version" and "collect application vendor" with the corresponding MSP collected information.
IOS Output 3: MSP Populating Flow Metadata Table and Integration with Performance Monitor
#MSP is enabled on Switch-H1 and Flow Metadata information is viewed on Router-H1
Global Session Id : 1E3BD554-1EE7-11E2-B6D6-001C0F5DFF00-00000000-00000000
Matched filters :
Direction: IN:
Direction: OUT:
Router-H1#show metadata flow local-flow-id 197
To From
Protocol SPort DPort Ingress I/F Egress I/F
70.26.0.52 60.10.0.54
UDP 49412 49256 GigabitEthernet0/2 Tunnel0
Metadata Attributes :
Application Vendor : Unknown vendor [2684]
End Point Model : Polycom-VCF
Application Device Class : desktop-conferencing
Called URI : 220531@100.250.0.125
Calling URI : 24006@100.250.0.125
Application Name : rtp
Application Tag : 218103869 (rtp)
Bandwidth : 64
Application Media Type : audio
SDP Session ID : 12085
SIP User Name : CiscoSystemsCCM
Mime Type : G729
Payload Type : 18
Clock Frequency : 8000
Global Session Id : 1E3BD550-1EE7-11E2-B6D6-001C0F5DFF00-00000000-00000000
Matched filters :
Direction: IN:
Direction: OUT:
Router-H1# show performance monitor status
Match: ipv4 source address = 60.10.0.54, ipv4 destination address = 70.26.0.52, transport source-port = 49412, transport destination-port = 49256, transport rtp ssrc = 721676033, ip protocol = 17,
Policy: inline, Class: inline
routing forwarding-status : Forward
transport packets expected counter : 8913
transport packets lost counter : 0
transport packets lost rate ( % ) : 0.00
transport event packet-loss counter : 0
transport rtp jitter mean (usec) : 3210
transport rtp jitter minimum (usec) : 1105
transport rtp jitter maximum (usec) : 9923
interface input : Gi0/2
interface output : Tu0
counter bytes : 534780
counter packets : 8913
counter bytes rate : 2987
application media bytes counter : 285216
application media bytes rate : 1593
application media packets counter : 8913
application media packets rate : 49
application media event : Normal
monitor event : false
application version : NA
application vendor : NA
ip dscp : 0x20
ip ttl : 61
application id : rtp
Codes: * - field is not configurable under flow record
NA - field is not applicable for configured parameters
UR - field is unreportable for configured paramaters
Match: ipv4 source address = 60.10.0.54, ipv4 destination address = 70.26.0.52, transport source-port = 49414, transport destination-port = 49258, transport rtp ssrc = 2057121025, ip protocol = 17,
Policy: inline, Class: inline
routing forwarding-status : Forward
transport packets expected counter : 6991
transport packets lost counter : 0
transport packets lost rate ( % ) : 0.00
transport event packet-loss counter : 0
transport rtp jitter mean (usec) : 449
transport rtp jitter minimum (usec) : 2
transport rtp jitter maximum (usec) : 32782
interface input : Gi0/2
interface output : Tu0
counter bytes : 6084378
counter packets : 6991
counter bytes rate : 33990
application media bytes counter : 5888630
application media bytes rate : 32897
application media packets counter : 6991
application media packets rate : 39
application media event : Normal
monitor event : false
application version : NA
application vendor : NA
ip dscp : 0x20
ip ttl : 61
application id : rtp
Verification Using NMS
• Similar to the previous deployment scenario, Performance Monitor can export the application ID collected for Polycom flows to a NMS.
• Figure 45 (below) depicts Cisco Prime Infrastructure reporting on Polycom flows. These flows will appear as "rtp" as the application name exported is "rtp".
• A third-party vendor tool that understands Cisco Flexible Netflow and application-table exports can also be used.
Figure 45. Cisco Prime Infrastructure Reporting Polycom Flows as `rtp'
NBAR2 Integration with Flexible NetFlow
NBAR uses deep packet inspection to identify applications based on their unique signatures. NBAR2 is a complete re-architecture of NBAR and supports ~1000 protocols with ~100 protocols added every year. NBAR2 can be enabled on all, or a few key network nodes in the SuperWatch network. Once NBAR2 is configured, it can be utilized in:
• Application visibility
• Integration with QoS for classification and marking
IOS Configuration 3 below illustrates step-by-step configuration of NBAR2, and its integration with Flexible NetFlow.
Table 16. IOS Configuration 3: NBAR2 Integration with FNF
Configuration
Description
flow record traffic-stats
match ipv4 protocol
match ipv4 source address
match ipv4 destination address
match transport source-port
match transport destination-port
match interface input
collect ipv4 dscp
collect interface output
collect flow direction
collect counter packets
collect timestamp sys-uptime first
collect timestamp sys-uptime last
collect application name
!
Create a Flexible NetFlow record with `collect application name' among other fields of interest.
flow exporter xport1
destination 10.1.160.37
source Loopback0
transport udp 2055
template data timeout 60
option interface-table
option application-table
!
Create a flow exporter that was created for Performance Monitor. Enable the `option application-table' so that the NMS can associate the application ID exported with the application name.
flow monitor traffic-stats
exporter xport1
record traffic-stats
!
Associate the Flexible NetFlow record and exporter to a flow monitor.
interface GigabitEthernet1/0
ip flow monitor traffic-stats input
ip flow monitor traffic-stats output
!
Apply the flow monitor to an interface in the ingress and/or egress direction.
Verification for "NBAR2 Integration with Flexible NetFlow"
Unlike previous deployment scenarios, where Flow Metadata and its effects could have been verified on downstream nodes of origination, verification of NBAR2 will have to be done on the network nodes where NBAR2 is configured. NBAR2, and its effects, are localized to the network nodes where the feature is enabled.
Verification Via CLI
IOS Output 4 below shows all the constituent flows of the WebEx session.
IOS Output 4: NBAR2 Integration with FNF
Router-H1#show flow monitor traffic-stats cache
Cache type: Normal
Cache size: 4096
Current entries: 18
High Watermark: 41
Flows added: 749
Flows aged: 731
- Active timeout ( 1800 secs) 0
- Inactive timeout ( 15 secs) 731
- Event aged 0
- Watermark aged 0
- Emergency aged 0
IPV4 SOURCE ADDRESS: 10.4.13.21
IPV4 DESTINATION ADDRESS: 64.68.119.32
TRNS SOURCE PORT: 2528
TRNS DESTINATION PORT: 443
INTERFACE INPUT: Gi1/0
IP PROTOCOL: 6
interface output: Gi0/1
flow direction: Input
counter packets: 152
timestamp first: 15:20:35.357
timestamp last: 15:26:07.845
ip dscp: 0x00
application name: cisco webex-meeting
IPV4 SOURCE ADDRESS: 10.4.13.21
IPV4 DESTINATION ADDRESS: 64.68.119.32
TRNS SOURCE PORT: 2529
TRNS DESTINATION PORT: 443
INTERFACE INPUT: Gi1/0
IP PROTOCOL: 6
interface output: Gi0/1
flow direction: Input
counter packets: 84
timestamp first: 15:20:35.397
timestamp last: 15:26:08.145
ip dscp: 0x00
application name: cisco webex-meeting
IPV4 SOURCE ADDRESS: 10.4.13.21
IPV4 DESTINATION ADDRESS: 64.68.119.235
TRNS SOURCE PORT: 2532
TRNS DESTINATION PORT: 443
INTERFACE INPUT: Gi1/0
IP PROTOCOL: 6
interface output: Gi0/1
flow direction: Input
counter packets: 105
timestamp first: 15:20:37.881
timestamp last: 15:26:17.361
ip dscp: 0x00
application name: cisco webex-meeting
IPV4 SOURCE ADDRESS: 10.4.13.21
IPV4 DESTINATION ADDRESS: 64.68.119.235
TRNS SOURCE PORT: 64017
TRNS DESTINATION PORT: 9000
INTERFACE INPUT: Gi1/0
IP PROTOCOL: 17
interface output: Gi0/1
flow direction: Input
counter packets: 36
timestamp first: 15:20:38.481
timestamp last: 15:26:08.637
ip dscp: 0x00
application name: cisco webex-meeting
Verification Via NMS
Figure 46 (below) displays Cisco Prime Infrastructure reporting on WebEx flows using the application name `webex-meeting'. This is similar to previous deployment scenarios where Performance Monitor was exporting via Flexible NetFlow.
Figure 46. NBAR2 Export Via FNF Shown on Cisco Prime Infrastructure
In the same management network, it is possible that some devices use Performance Monitor integrated with MSI, some devices use Performance Monitor integrated with MSP, whereas some other devices use flexible NetFlow integrated with NBAR. The NetFlow data from these different sources can coexist and be handled by the same network management system.
Ensuring Quality of Service
In this use case, how to deploy Cisco Medianet features to ensure Quality of Service (QoS) for media applications will be discussed.
In the following deployment scenarios, we will address three mechanisms to ensure QoS for applications:
• MSI integration with QoS
• MSP integration with QoS
• NBAR2 integration with QoS
Table 17 (below) lists the Flow Metadata attributes that can be used with QoS for classification and marking. The Flow Metadata attributes are self-explanatory in what they signify.
Table 17. Flow Metadata Attributes to Use with QoS
Metadata attributes that can be matched within a QoS class-map
Description
Router-H1(config-cmap)#match application ?
application-group Application Group to match
attribute Application attribute to match
cisco-phone Cisco IP Phones and PC-based Unified Communicators
citrix Citrix Application
h323 H323 Protocol
jabber Jabber Protocol
rtp Real Time Protocol
rtsp RTSP Protocol
sip Session Initiation Protocol
telepresence-control telepresence-control stream
telepresence-data telepresence-data stream
telepresence-media telepresence-media stream
vmware-view VMWARE View
webex-data webex-data stream
webex-meeting webex-meeting stream
webex-streaming webex-streaming stream
webex-video webex-video stream
webex-voice webex-voice stream
wyze-zero-client WYZE Zero client
xmpp-client XMPP Client
Create a Flexible NetFlow record with `collect application name' among other fields of interest.
voice-video-chat-collaboration Voice, Video, Chat and Collaboration
Router-H1(config-cmap)#match metadata ?
cac Call Admission Control
called-uri Called URI
calling-uri Calling URI
device-model Device model
global-session-id Global Session ID (24 Chars)
multi-party-session-id Multi Party Session ID
Router-H1(config-cmap)#match metadata cac status ?
admitted CAC Admitted
un-admitted CAC Rejected
RSVP CAC status-to assign different DSCP values based on admitted/un-admitted status.
MSI Integration with QoS
In the SuperWatch network, packets sourced by applications installed on laptops, such as video soft clients (Jabber for Windows) or the WebEx meeting client cannot be trusted with their DSCP values. Thus by default, the DSCP marking is best-effort. Typically, remarking is done for applications or endpoints at the access layer. In the SuperWatch network, remarking will be done in Switch-H1 or Switch-H2 in the campus network. Traditionally this was done using port numbers, IP addresses, or a combination of them. In this deployment scenario, Flow Metadata attributes generated by MSI for each application will be used for QoS classification and marking.
Table 18. IOS Configuration 4: Flow Metadata Integration with QoS
Configuration
Description
metadata flow
!
On a layer 2 switch, the following global configuration is required for metadata to be forwarded to the switch's CPU:
ip rsvp snooping
Or:
ip rsvp snooping vlan <id>
Enable Flow Metadata on network nodes, where QoS classification and marking based on metadata attributes, will be done.
On Catalyst 4K, due to defect CSCub10690, vlan need to be specified when enabling rsvp snooping.
class-map match-all Jabber
match application cisco-phone
!
class-map match-all webex
match application webex-meeting
!
Classify Jabber for Windows using application `cisco-phone'. Classify the WebEx application using the `webex-meeting' application name.
policy-map mark
class webex
set ip dscp af21
class Jabber
set ip dscp af41
!
Mark WebEx packets with DSCP AF21 and Jabber for Windows packets with DSCP AF41. This is in line with the Cisco QoS SRND 4.0 recommendation.
int gigabitEthernet 1/0
service-policy input mark
!
Apply the service-policy on the access network device in the ingress direction.
Verification of "MSI Integration with QoS"
• Jabber for Windows and WebEx flows are traversing the network node where Flow Metadata is enabled. Flow Metadata information originated from applications will be processed by the network node to build the Flow Metadata database.
• IOS Output 5 shows WebEx (port number 443) flows and Jabber for Windows flows. It also shows the versions of applications that are sending Flow Metadata packets.
IOS Output 5: Application Awareness Using Flow Metadata
• IOS Output 6 shows details about Jabber for Windows audio flow and video flow. Audio flow is tagged with application media type `voice-video', the audio is part of a video call, and video flow is tagged with application media type `video'.
• IOS Output 6 also shows that a QoS policy-map has matched Jabber for Windows based on `application cisco-phone'.
• Other Flow Metadata attributes listed in Table 17 (above) can also be seen.
IOS Output 6: Flow Metadata Information for Jabber for Windows Flows
Router-H1#show metadata flow local-flow-id 1
To From Protocol SPort DPort Ingress I/F Egress I/F
Application Sub Category : voice-video-chat-collaboration
Application Device Class : software-phone
End Point Model : Jabber for Windows
Unknown Identifier (147) : [ 00 00 00 05 ]
Unknown Identifier (148) : [ 00 00 00 02 ]
Application Vendor : Cisco Systems, Inc.
Application Version : 9.1.0
Application Media Type : voice-video
Matched filters :
Direction: IN:
QOS : "application cisco-phone"
Direction: OUT:
• IOS Output 7 shows Flow Metadata details for constituent flows of the WebEx session. Four constituent WebEx flows: data, data, control and video are visible. It also shows that a QoS policy-map is matching the flows based on `application webex-meeting'.
• IOS Output 7 also shows some Unknown Identifier (such as 147, 148). This is because the IOS version used in this example is behind the MSI version on the client, so these metadata attributes are unknown to this particular IOS version. Later IOS versions will be able to interpret these new attributes.
IOS Output 7: Flow Metadata Information for WebEx Flows
Router-H1#show metadata flow local-flow-id 3
To From Protocol SPort DPort Ingress I/F Egress I/F
Application Sub Category : voice-video-chat-collaboration
Application Device Class : desktop-conferencing
Application Media Type : video
Application Vendor : Cisco Systems, Inc.
Application Version : T28.4
End Point Model : webex-meeting client
Matched filters :
Direction: IN:
QOS : "application webex-meeting"
Direction: OUT:
MSP Integration with QoS
In this deployment scenario, we will use MSP to identify Polycom flows and send Flow Metadata to downstream routers. As was listed in Table 18, multiple examples are illustrated for using Flow Metadata attributes with QoS for classification and marking purposes.
Table 19. IOS Configuration 5: Integration of Flow Metadata Generated by MSP with QoS
Configuration
Description
profile flow
media-proxy services profile PLY
metadata
!
media-proxy services PLY
metadata flow
Enable MSP on a network node closest to the endpoint.
Enable MSP to generate Flow Metadata for identified flows and send the Flow Metadata packets downstream.
class-map match-all Polycom
match application rtp
!
policy-map mark
class Polycom
set ip dscp af41
!
int gigabitEthernet 1/0
service-policy input mark
!
Example showing marking of Polycom packets with AF41. The matching is done based on application type `rtp'. Beware that NBAR also offers the capability to match on application rtp. If other rtp streams pass through this router, they can be classified by NBAR and marked with the same DSCP.
class-map match-all 911
match metadata called-uri 911@cisco.com
!
policy-map mark
class 911
set ip dscp ef
!
int gigabitEthernet 1/0
service-policy input mark
Example showing packets of a call going to 911 marked with EF markings.
Verification of "MSP Integration with QoS"
Example 1: MSP Enabled for Polycom Endpoint
In this example, MSP on Switch-H1 identifies flows originating from the Polycom endpoint and generates Flow Metadata. Polycom flows are remarked on Switch-H1 based on `match application rtp'. QoS policy can also be applied on Router-H1 based on `match application rtp' as shown in IOS Output 8 below.
IOS Output 8: Verification of MSP Deployment and Integration with QoS
Switch-H1#show profile flow
Source-IP sPort Dest-IP dPort pro I/F Media-proxy Services profile
60.10.0.54 49274 70.32.0.50 23684 UDP Gi2/31 PLY
70.32.0.50 23684 60.10.0.54 49274 UDP Gi2/20 PLY
60.10.0.54 49276 70.32.0.50 32146 UDP Gi2/31 PLY
70.32.0.50 32146 60.10.0.54 49276 UDP Gi2/20 PLY
Switch-H1#show metadata flow table
Flow To From Protocol DPort SPort Ingress I/F Egress I/F SSRC
Configuration is as shown in IOS Configuration 4. In this scenario, media is pulled from an Axis video surveillance camera using RTSP (using a client such as VLC client). MSP analyzes the RTSP protocol and identifies the audio and video flows. It also identifies attributes like vendor, RTP payload-type, clock frequency, bandwidth requirements, etc. This information will be sent via Flow Metadata to the downstream network nodes. QoS policies can be designed based on these metadata attributes to classify and mark this video surveillance traffic.
IOS Output 9: MSP with Axis Video Surveillance Camera
Switch-H1#show profile flow
Source-IP sPort Dest-IP dPort pro I/F Media-proxy Services profile
In this deployment scenario, NBAR2 will be observed identifying WebEx flows and using NBAR2 to remark WebEx traffic to AF21, as was done in the previous deployment scenario. IOS Configuration 6 below illustrates the configuration required for this deployment.
Table 20. IOS Configuration 6: Configuring NBAR2 for Integration with QoS
Configuration
Description
class-map match-any webex
match protocol webex-meeting
`match protocol' enables NBAR2 automatically.
policy-map mark
class webex
set ip dscp af21
!
Webex traffic is marked with DSCP AF21.
int gigabitEthernet 1/0
service-policy input mark
!
Apply the policy-map in the ingress direction to the interface connecting to the hosted WebEx application.
Class-map match-any webex
match protocol webex-meeting audio
match protocol webex-meeting video
match protocol webex-meeting payload-type "96"
Other WebEx matching options using NBAR2.
Note:
NBAR recognizes UDP based webex audio and video; for webex deployment scenario where SSL is used, NBAR won't be able to identify the webex audio and video flow. This is a generic limitation with the packet inspection mechanism as well as MSP, when call signaling or media stream is encrypted. Flow Metadata is the only answer for encrypted stream identification.
Verification of "NBAR2 integration with QoS"
IOS Output 10 below illustrates WebEx flows being marked to AF21 by NBAR2.
IOS Output 10: Verification of NBAR2 and its Integration with QoS
Router-H1#sh run int gigabitEthernet 1/0
Building configuration...
Current configuration : 296 bytes
!
interface GigabitEthernet1/0
description to Switch-H1
ip address 10.4.13.2 255.255.255.0
service-policy input mark
end
3013R1-BB0303#show policy-map int gigabitEthernet 1/0 input
GigabitEthernet1/0
Service-policy input: mark
Class-map: webex (match-any)
1035 packets, 120899 bytes
30 second offered rate 19000 bps, drop rate 0000 bps
Match: protocol webex-meeting
1035 packets, 120899 bytes
30 second rate 19000 bps
QoS Set
dscp af21
Packets marked 1035
Class-map: Jabber (match-any)
0 packets, 0 bytes
30 second offered rate 0000 bps, drop rate 0000 bps
Match: application cisco-phone
0 packets, 0 bytes
30 second rate 0 bps
QoS Set
dscp af41
Packets marked 0
Class-map: class-default (match-any)
628 packets, 300420 bytes
30 second offered rate 33000 bps, drop rate 0000 bps
Match: any
Ensuring QoS Via Bandwidth Reservation
In this deployment scenario, ensuring QoS by reserving bandwidth for a video surveillance flow in all the downstream network nodes will be looked at. MSP enabled on the network closest to the video surveillance camera will generate RSVP messages that will reserve bandwidth on the downstream network nodes.
Enable RSVP along with Flow Metadata in the MSP profile.
interface GigabitEthernet2/25
ip rsvp bandwidth
interface GigabitEthernet2/48
ip rsvp bandwidth
Enable rsvp bandwidth on all interfaces where the video surveillance flow is traversing. This needs to be enabled not only on the MSP enabled network node but also on the downstream network nodes.
Verification for "Deployment Scenario for Ensuring QoS Via Bandwidth Reservation"
• Switch-H1 has MSP configured. Switch-H1 will recognize the media flows from the video surveillance camera and will generate Flow Metadata, as well as RSVP signaling for bandwidth allocation for the downstream network nodes.
• The CAC status will be "admitted" if the flows are admitted for bandwidth allocation. Remarking is done on the Switch-H1 based on this Flow Metadata attribute.
• On the downstream network node Router-H1, CAC status can be verified to be "admitted" as well, if the flows are admitted via RSVP signaling. DSCP can be set to default on the downstream network nodes if there was not sufficient bandwidth to admit this flow.
IOS Output 11: Flow Metadata and Bandwidth Reservation
Switch-H1#sh profile device
MAC Address Interface Device class Device Model Device Vendor
Endpoint-Driven End-to-End Troubleshooting (No Network Write Access)
In this scenario, an organization is considered that has recently deployed Cisco Telepresence units EX90, EX60. As part of this deployment, Cisco Prime Collaboration Assurance (CPCA) was also installed to help manage the endpoints. CPCA leverages Mediatrace for troubleshooting when it detects an endpoint receiving bad voice or video quality. CPCA can initiate a mediatrace in the endpoints or in the network devices. All devices in the path of the flow that support Mediatrace should be able to respond to mediatrace requests.
However, the organization in this example uses a managed service provider. CPCA connects with network devices via Web Services Management Agent (WSMA) protocol, which requires write access into the devices. But the service provider in this case has very strict control policy on the network device access.
Starting from the 6.0 build, EX series such as EX60 or EX90 has Mediatrace capabilities integrated. The endpoints can act as mediatrace initiator or responder. So, even though the organization does not have write access to the network devices in the service provider providing managing services, they can still leverage the benefits of Mediatrace to troubleshoot calls end-to-end.
Figure 47. Solution Overview
Figure 47 (above) illustrates how this solution works. The blue area in Figure 47 stands for the managed service domain in which the organization has no write access to the network devices. Mediatrace responder on EX series is enabled by default. To initiate a mediatrace from the EX, the organization can use CPCA, which can create a mediatrace session on the endpoint. Once a mediatrace session is created on the endpoint, the CPCA can periodically retrieve report from the endpoint.
Figure 48. Mediatrace from endpoint
To get mediatrace responses from each hop within the managed service domain, the organization can request the service provider to enable mediatrace responder and snmp read access. Table 22 (below) illustrates the necessary configuration on the intermediate nodes within the managed network.
Table 22. Configuration Required on Network Devices with the Managed Service Domain
Configuration
Description
Mediatrace responder
Enable mediatrace responder
Snmp-server community public RO
On each network node, SNMP is used to provide system info (CPU, memory, interface) for mediatrace
From the CPCA perspective, end devices have to be in a managed state with MSI and HTTP credentials available. Figure 48 presents the end device in a "Managed" state with all credentials validated. Below are the steps to explain how this can be accomplished:
• From the menu bar, choose Operate > Device Work Center > Manage Credentials. Add new Credentials Profile with SNMP, CLI, HTTP and MSI credentials for your end devices.
• From the menu bar, choose Operate > Device Work Center > Discover Devices > Logical Discovery. Under IP Address section add a CUCM IP address and click "Run Now". This should discover your registered end devices with valid credentials.
Figure 49. Managed MSI End Point
Once required devices are managed by CPCA, the live session can be monitored from the Session Diagnostics tab (Operate > Session Diagnostics) and is available for troubleshooting. From this tab, a user can also see all live sessions and performance monitoring statistics for the sessions as shown in Figure 49.
Figure 50. CPCA Live Session Diagnostics
Steps to manually initiate a mediatrace from the end point:
1. Operate > Session Diagnostics
2. Select a session under "Video Collaboration Session"
3. With the cursor go over "Session Subject" information under the highlighted session and the "360 View" button represented by white circle will appear on the right hand side, as shown below. Click on "360 View" for the session.
4. Click on the "Troubleshooting" section from "360 Session View", it is represented as wrench in the top right hand corner.
5. Under "Troubleshooting Status" initiate Mediatrace from the highlighted end point by pressing the "Start" button under the Action column. This can be done from one or both end devices.
6. Once Mediatrace is complete, navigate over to "Media Path View" and "Path Assessment" to view collected statistics from end points and network devices.
7. Figure 51 (below) represents a capture from the "Media Path View" tab. The hop named "3945-AA0602" can be seen and has zero packet drops for the session, and its DSCP value is set to 32. The hop named "3845-AA0216" reports packets dropped and a DSCP value of zero. From this troubleshooting scenario, it can be concluded that the configuration was not correct on the "3945-AA0602" device causing the DSCP value reset, and causing important video/voice packets to be deprioritized.
Figure 51. Cisco Medianet Path View Example
Migrating Existing QoS Policies to Leverage Flow Metadata
In this scenario we consider an organization that already has a QoS implementation in place and wants to leverage Flow Metadata generated by MSI on their endpoints to classify the flows and enhance their QoS policies. This document will walk through the steps that the organization should follow to accomplish this.
How to Enable Flow Metadata on the EX Series
Flow Metadata support on the EX series has been available since the 6.0 build. However, by default metadata is disabled on the EX and needs to be enabled explicitly. Figure 52 (below) shows the Medianet Metadata enablement field. To access this field, login as administrator onto the EX,
• From the menu bar, choose Configuration > System Configuration
• On the left panel, click on Experimental; on the right panel, find the "Medianet Metadata" drop menu under the "NetworkServices" section.
Figure 52. Enable Medianet Metadata on the EX Series
How to Migrate the Existing QoS Policy to Support Flow Metadata
The existing QoS policy is based on ACL or NBAR. Table 23 (below) illustrates the existing QoS policy configuration.
Table 23. Existing QoS Policy Before an Update with Flow Metadata
Existing Configuration
Description
class-map match-any classify-voice
match access-group name ACL-Classify-VoIP
Existing voice class based on ACL match
class-map match-any classify-signaling
match access-group name ACL-Classify-signaling
match protocol rtcp
Existing signaling class base on ACL match or NBAR
class-map match-any classify-data
match access-group name ACL-Classify-Data
Existing Data class based on ACL match
policy-map Classify-mark
class classify-signaling
set ip precedence 3
class classify-voice
set dscp ef
class classify-data
set ip precedence 1
class class-default
set dscp default
Existing policy-map that is used to set DSCP value based on the traffic class
Because the existing applications do not support Flow Metadata, the updated QoS policy will continue to use the existing mechanism (ACL or NBAR) to identify traffic generated by these applications. After enabling Flow Metadata on the EX series, the updated QoS policy will use metadata to identify the traffic generated by the EX series. The metadata can be used in the existing class-maps, or a new class-map can be created with the metadata, and used in the existing policy-map. Table 24 (below) illustrates the updated QoS policy after metadata is incorporated.
Table 24. Existing QoS Policy After Update with Flow Metadata
Existing Configuration
Description
class-map match-any classify-voice
match application attribute media-type audio
match application attribute media-type audio-video
match access-group name ACL-Classify-VoIP
The voice streams from the EX series will get the same QoS treatment as the existing voice traffics, so the existing voice class has added metadata match to accommodate the EX voice traffic.
Note: for voice traffic identified by the metadata, the media-type attribute has two possible values:
• Media-type audio: audio stream for audio only call
• Media-type audio-video: audio stream for video call
Note: a metadata match statement needs to be on the top of class-map.
class-map match-any classify-signaling
match access-group name ACL-Classify-signaling
match protocol rtcp
Existing signaling class base on ACL match or NBAR will not be updated.
class-map match-any classify-data
match access-group name ACL-Classify-Data
Existing Data class based on ACL match will not be updated.
class-map match-all classify-telepresence-video
match application telepresence-media
match application attribute media-type video
This new class-map is used to identify the telepresence video traffic. There is no similar class-map in the existing QoS policy, thus this class-map is created to give telepresence video traffic different treatment.
policy-map Classify-mark
class classify-signaling
set ip precedence 3
class classify-voice
set dscp ef
class classify-telepresence-video
set dscp AF41
class classify-data
set ip precedence 1
class class-default
set dscp default
The QoS treatment for the existing class stays the same.
The new telepresence video class receives a different treatment than the existing classes. This is why creating a new class-map for the telepresence traffic is necessary.
Using Flow Metadata on Environments with Firewalls
Flow Metadata uses RSVP message as transport protocol with the router alert option enabled. Packets with the router alert option enabled are generally considered unsecure because it can be used for a Denial of Service (DoS) attack. For this reason, packets from the internet with the router alert option enabled are usually dropped. That means metadata packets coming from the internet should not be allowed.
In this scenario, an organization which has firewalls at different locations within its network is considered. There is a firewall to check traffic between different departments; there is also a firewall in place between this company's internal network and external network. However, the organization wants to pervasively enable Flow Metadata throughout its internal network; at the same time, it wants to protect the internal network from the internet.
In general, Cisco recommends enabling Flow Metadata between different departments in order to pervasively deploy these capabilities; Cisco also recommends disabling Flow Metadata between internal network and the internet for security reasons. Figure 53 (below) illustrates this general firewall policy guide for Flow Metadata.
Figure 53. Firewall Policy Recommended for Flow Metadata
Most firewall products by default will deny incoming packets with the router alert option enabled. That means by default, metadata packets will be dropped by the firewall.
In the following two sections, how to set up the firewall policy on different Cisco firewall products will be illustrated. The configuration for ASA and Cisco IOS firewall will be covered.
How to Configure ASA to Pass RSVP
On ASA, RSVP between two internal interfaces is not allowed by default. Table 25 (below) illustrates how to configure the ASA to allow RSVP to pass between two internal interfaces of the same security level.
Table 25. How to Permit RSVP Between Internal Interfaces of the Same Security Level
Configuration
Description
interface GigabitEthernet0/1
nameif HR
security-level 100
ip address 100.100.0.162 255.255.255.252
!
interface GigabitEthernet0/2
nameif ENG
security-level 100
ip address 100.100.0.165 255.255.255.252
!
HR interface and ENG interfaces are both internal interfaces and have the same security level.
same-security-traffic permit inter-interface
Allow traffic between two interfaces on the same security level.
policy-map type inspect ip-options RSVP
parameters
router-alert action allow
Set up ip-option insepct rule and allow packets with router alert to pass.
policy-map global_policy
class inspection_default
inspect dns preset_dns_map
inspect ftp
inspect h323 h225
inspect h323 ras
inspect sip
...
inspect ip-options RSVP
Setup global policy and use the ip-option inspect rule.
service-policy global_policy global
Apply the global policy.
The organization in this example may have a B2B connection through the ASA to its partner companies. In order to deploy Flow Metadata end to end, the two organizations agree to let the metadata pass through their network border. On ASA, the internal network interface has a different security level than the interface for B2B connection. Table 26 (below) illustrates how to make Flow Metadata pass between interfaces of different security levels.
Table 26. How to Permit RSVP Between Interfaces with Different Security Level
Configuration
Description
interface GigabitEthernet0/1
nameif B2B
security-level 10
ip address 100.100.0.162 255.255.255.252
!
interface GigabitEthernet0/2
nameif internal
security-level 100
ip address 100.100.0.165 255.255.255.252
B2B interface has a lower security level than the internal interface.
Allow endpoint 6.6.6.1 from partner's network to send RSVP to 7.7.7.1 from the internal network.
policy-map type inspect ip-options RSVP
parameters
router-alert action allow
Set up ip-option inspect rule and allow packets with router alert to pass.
policy-map global_policy
class inspection_default
inspect dns preset_dns_map
inspect ftp
inspect h323 h225
inspect h323 ras
inspect rsh
inspect rtsp
inspect esmtp
inspect sqlnet
inspect skinny
inspect sunrpc
inspect xdmcp
inspect sip
inspect netbios
inspect tftp
inspect icmp
inspect ip-options RSVP
Set up ip-option inspect rule and allow packets with router alert to pass.
service-policy global_policy global
Apply the global policy.
How to Configure IOS Firewall to Pass RSVP
Flow Metadata uses RSVP as its transport protocol and has the router-alert option turned on. To be able to match on the router-alert option using an access-list, Cisco recommends using ZBFW (Zone Based Firewall) to setup the IOS firewall configuration. By default, RSVP messages with the router alert enabled are not allowed to pass though the IOS firewall. Table 27 (below) illustrates how to setup a ZBFW policy that allows RSVP message to pass.
Table 27. ZBFW Policy that Allow RSVP to Pass
Configuration
Description
Configuration
ip access-list extended RSVP
permit 46 any any option router-alert
Access-list that will be used to match the metadata RSVP message.
class-map type inspect match-all RSVP
match access-group name RSVP
Create class-map using above RSVP access-list.
policy-map type inspect ENG_HR
class type inspect ICMP
inspect
...
class type inspect RSVP
pass
class class-default
drop
policy-map type inspect HR_ENG
class type inspect ICMP
inspect
...
class type inspect RSVP
pass
class class-default
drop
Policy-map that will be used for direction from engineering to human resource.
Identify the metadata RSVP message and allow it pass through the firewall.
Policy-map that will be used for direction from human resource to engineering.
Identify the metadata RSVP message and allow it pass through the firewall.
zone security ENG
description engineering
zone security HR
description human resource
zone-pair security ENG-HR source ENG destination HR
service-policy type inspect ENG_HR
zone-pair security HR-ENG source HR destination ENG
service-policy type inspect HR_ENG
interface GigabitEthernet1/0
zone-member security ENG
interface GigabitEthernet0/0
zone-member security HR
Easing Deployment of Cisco VXCs with Cisco Medianet Capabilities
This section describes how a network operator can use Cisco Medianet features to ease the deployment of Cisco VXCs. To ease the deployment, the following Cisco Medianet capabilities are used:
• Auto Smartports
• Location
• Flow Metadata
Figure 54 (below) depicts key parts of the VXC deployment. Cisco VXC Manager provides centralized, enterprise-scale manageability for VXC deployments. It is used to efficiently provision, monitor, and troubleshoot the Cisco VXC endpoints.
As VXC Client boots up, it will send initial messages to the switch via CDP or LLDP. As soon as the switch detects a Cisco VXC, it configures the port with the correct security, QoS, and VLAN settings for Cisco VXC. Location Services provides the ability for the Catalyst Switch to send location information to a device via CDP or LLDP-MED. This will be used by the client to advertise the address and location to a PSAP (Public Services Access Point) for the purposes of E911 Calls.
Table 28. Configuration Example: Cisco Medianet Autoconfiguration for VXC
Solution Element
Description
Cisco VXC
The Cisco VXC-6215 doesn't require any specific configuration. Cisco The MSI is enabled by default on this end device.
Switch Configuration
macro auto global processing
This command enables Auto Smartports globally on the switch.
macro auto trigger VXC-TRIGGER
device Cisco VXC 6215
Device Trigger can be created using a device defined value. This value is sent via CDP.
location civic-location identifier VXC-LOCATION
building 1
city NewYork
country USA
primary-road-name WallStreet
state NewYork
In this example, the location information is configured to be identical for all ports on the switch in the New York branch office.
macro auto execute VXC-MACRO {
if [[ $LINKUP == YES ]]
then conf t
interface $INTERFACE
macro description $TRIGGER
switchport access vlan 63
switchport mode access
switchport port-security
switchport port-security maximum 1
switchport port-security violation restrict
switchport port-security aging time 2
switchport port-security aging type inactivity
spanning-tree portfast
spanning-tree bpduguard enable
exit
fi
if [[ $LINKUP == NO ]]
then conf t
interface $INTERFACE
no macro description $TRIGGER
no switchport mode access
no switchport access vlan 63
if [[ $AUTH_ENABLED == NO ]]
then no switchport mode access
fi
no switchport port-security
no switchport port-security maximum 1
no switchport port-security violation restrict
no switchport port-security aging time 2
no switchport port-security aging type inactivity
no spanning-tree portfast
no spanning-tree bpduguard enable
exit
fi
This command creates a custom macro specific to the VXC deployment on this switch. There is no built in VXC macro at this time, but a user can utilize some existing built in macros, and make necessary modification.
Note: VXC deployment with Cisco Medianet capabilities requires single vlan deployment; voice vlan is not supported at this time.
macro auto execute VXC-TRIGGER VXC_MACRO
This command enables a customer made macro for a specific trigger.
interface range GigabitEthernet2/0/1-48
location civic-location-id VXC-LOCATION
This command assigns the civic location to a series of access ports.
interface Vlan63
description "VXC Vlan"
ip address 10.2.0.2 255.255.255.0
ip helper-address 20.0.0.118
On the access VLAN, specify the DHCP server address so the device can convert Bootstrap Protocol (BOOTP) broadcasts to unicast.
DHCP Server Configuration
class "VXC" {
match if option option-186 = "\x00\x00\x00\x09\x06\x13\x04\x01\x44\x4d\x4d";
This example lists the configuration that needs to be added to a Cisco IP Solution Center (ISC) DHCP server. Other products use similar syntax. The Cisco VXCs discover the Cisco VXCM address by sending a DHCPINFORM message with a specific option 186 to the DHCP server. The corresponding reply (DHCPACK) should contain the IP address of the Cisco VXCM. In this example, the highlighted section (\xac\x10\x05\xd2\) denotes the IP address of the Cisco DMM, which is 172.16.5.210 in hexadecimal format.
Media Awareness for VXC
Once the VXC client is up, the user can start making calls using soft phone applications. In the example, the Jabber Application is being utilized. During live video or a voice call, VXC will automatically start sending Flow Metadata information that can be utilized for QoS configuration.
Table 29 (below) presents an example of a Cisco Medianet QoS with a Flow Metadata deployment configuration.
Table 29. Configuration Example: Cisco Medianet Flow Metadata for VXC
Solution Element
Description
Cisco VXC
The Cisco VXC-6215 doesn't require any specific configuration. The MSI is enabled by default on this end device.
Switch?Router Configuration
metadata flow
This command enables Flow Metadata globally on the switch/router.
class-map match-all VXC-VIDEO
match application attribute media-type video
match application cisco-phone
match application attribute device-class software-phone
class-map match-all VXC-AUDIO-VIDEO
match application attribute media-type audio-video
match application cisco-phone
match application attribute device-class software-phone
class-map match-all VXC-AUDIO-ONLY
match application attribute media-type audio-video
match application cisco-phone
match application attribute device-class software-phone
Classify VXC soft phone using application `cisco-phone'. Classify video traffic using "media-type video", and audio using "media-type audio-video" or "media-type audio".
policy-map VXC
class VXC-VIDEO
set dscp af41
class VXC-AUDIO-VIDEO
set dscp af41
class VXC-AUDIO-ONLY
set dscp ef
This policy sets DSCP values for all video streams (audio and video leg) to AF41 and audio only streams to EF.
interface GigabitEthernet2/0/2
description "Connectd to VXC-6215"
switchport access vlan 63
switchport mode access
Access port configuration that connects End Device.
interface Vlan63
service-policy input VXC
Apply the service-policy on the access network device in the ingress direction.
Verification of MSI Flow Metadata Integration with QoS
• On network nodes, where Flow Metadata is configured, use the show command listed in IOS Output 1. From Output 1, metadata streams matching the live video sessions can be seen.
• Output 2 shows the CLI command to be used to see detailed information for each individual flow. From this output, it can be seen that QoS policy-map has matched VXC stream based on `application cisco-phone' and "application attribute media-type video".
IOS Output 1: Application Awareness Using Flow Metadata
Application Sub Category : voice-video-chat-collaboration
Application Device Class : software-phone
End Point Model : Cisco VXC 6215
Application Traffic Type : realtime
Application Transport Type : rtp
Application Vendor : Cisco Systems, Inc.
Application Version : Cisco1.0.1-364-W11
Application Media Type : video
Matched filters :
Direction: IN:
QOS : "application cisco-phone"
"application attribute media-type video"
Direction: OUT:
Router#show metadata flow local 87
To From
Protocol SPort DPort Ingress I/F Egress I/F
60.33.0.101 70.25.0.101
UDP 18194 22516 Vlan171 Tunnel0
Metadata Attributes :
Application Name : cisco-phone
Application Tag : 218103889 (cisco-phone)
Application Category : voice-and-video
Application Sub Category : voice-video-chat-collaboration
Application Device Class : software-phone
End Point Model : Cisco VXC 6215
Application Traffic Type : realtime
Application Transport Type : rtp
Application Vendor : Cisco Systems, Inc.
Application Version : Cisco1.0.1-364-W11
Application Media Type : audio-video
Matched filters :
Direction: IN:
QOS : "application cisco-phone"
"application attribute media-type audio-video"
Direction: OUT:
Monitoring within a Service Provider Network (ASR9K as PE and P Routers)
Service Provider A is a MPLS VPN infrastructure and built with multiple ASR9k PE and P routers. One of the users of this network is complaining about quality issues of video and voice calls when traversing MPLS VPN network from branch to campus sites.
Service Provider A has Video Monitoring configured on all its ASR9k routers, which is monitoring these streams. They immediately get notification from one of the PE routers about the quality issues of these calls. The service provider administrator quickly troubleshoots the issue on the PE router and fixes the issue with the call.
Table 30 (below) presents a Video Monitoring configuration for RTP streams on a ASR9k router. For more information about other monitoring options please visit: Cisco ASR9k Video Monitoring Configuration Guide.
Table 30. Configuration Example: Cisco Medianet Flow Metadata for VXC
Router Configuration
ipv4 access-list sx-20
10 permit ipv4 host 60.12.0.50 host 70.17.0.50
20 permit ipv4 host 70.17.0.50 host 60.12.0.50
Define interesting traffic to be monitored.
class-map type traffic match-any sx-20
match access-group ipv4 sx-20
end-class-map
This task sets up the flow classifier. This may match either an individual flow, or it may be an aggregate filter, matching several flows.
flow exporter-map sx-20
version v9
options interface-table
template data timeout 100
!
transport udp 9991
source GigabitEthernet0/0/0/0
destination 100.250.0.117 vrf TB3
Configure flow exporter to be able to send captured information to the network management tool.
flow monitor-map performance-traffic sx-20
record default-rtp
exporter sx-20
Create Monitor map.
policy-map type performance-traffic sx-20
class type traffic sx-20
monitor parameters
flows 1000
interval duration 10
history 10
!
monitor metric rtp
!
flow monitor type performance-traffic sx-20
!
react 1 rtp-jitter
threshold type immediate
threshold value ge 10
action syslog
!
react 2 rtp-loss-pkts
threshold value ge 3
action syslog
alarm type discrete
!
react 3 rtp-out-of-order
threshold value ge 10
!
!
end-policy-map
The policy map for video monitoring is of the performance-traffic type. Only one level of hierarchy is supported for video monitoring policy-maps. The policy map configuration for video monitoring has these three parts:
• Flow parameters configuration: Specifies the different properties of the flow that are monitored such as interval duration, required history intervals, timeout, etc.
• Metric parameters configuration: Specifies the metrics that need to be calculated for the flow that are monitored.
• React parameters configuration: Specifies the parameters, based on which, alerts are generated for the flow.
interface GigabitEthernet0/0/0/0
vrf TB3
ipv4 address 60.0.1.9 255.255.255.252
service-policy type performance-traffic input sx-20
Apply policy to the interface.
The following show command is used to see detailed information per interface flows, and each individual flow details.
ASR9k#sh policy-map type performance-traffic interface Gigaethernet 0/0/0/0 input
In this section, some design guidelines and best practices recommendations based on experience in deployments from different organizations will be shared.
Media Monitoring Deployment Models
The media monitoring features can greatly help the IT team gain more visibility into the network for faster troubleshooting and more confident pre-deployment assessment. The media monitoring features support different deployment models that will be discussed in this section. Depending on the users goals and existing deployments, the deployment model that is more appropriate for the organization should be selected.
Before diving into the different models, here are a few things to consider when deployment media monitoring:
• Media monitoring does not need to be in every hop for the benefits to be realized. Small deployments making a big difference have been seen in helping organizations troubleshoot and understand better what is going on their networks. Deployment can be done in phases and co-exist with legacy and third party devices.
• Start in trouble spots or high usage areas. Performance monitor should be deployed in key places and focus on monitoring the most critical applications for the organization. Mediatrace should be enabled in as many devices as possible. As issues are detected by Performance Monitor, Mediatrace can be used to achieve a more refined dynamic view of the status of the network hop-by-hop. The models described below will provide more guidance on what to deploy and where.
Passive Monitoring (Performance Monitor Throughout the Network with FNF Exports)
In this model, Performance Monitor is enabled strategically throughout an enterprise network. Each network device with Performance Monitor enabled sends reports in Flexible NetFlow format to a NMS.
In general, this deployment model works well for enterprises, which already have a NetFlow collector or are planning to acquire one.
If a NetFlow collector is already being used and NetFlow is enabled on the devices, simply enable Performance Monitor, and the Performance Monitor fields will be exported as well. This will allow users to get more granular monitoring reports, which will include the Performance Monitor statistics (e.g. loss, delay, jitter) as well as drill down to the application level, to get performance statistics for the applications.
When Performance Monitor is enabled, consider selecting the traffic desired for monitoring, focusing on the most business critical applications for the organization, since the feature will be always on.
This deployment model allows:
• Application Monitoring-NetFlow data enables near real time application monitoring capabilities for RTP, TCP or CBR traffic.
• Historical Analysis-historical NetFlow data may be utilized to visualize application performance historical trending.
• Traffic Profiling and Baselining-NetFlow data enables network managers to gain a detailed, time-based, view of application performance. This information can be used to plan, understand new services, and allocate network and application resources to meet customer demands.
• Network Planning-NetFlow can be used to capture data over a long period of time, producing the opportunity to track and anticipate network growth and plan upgrades.
• Problem Isolation and Troubleshooting-Hop-by-hop knowledge of application performance metrics along the network path leads to granular fault isolation, and easier troubleshooting of user traffic flows.
Proactive Monitoring and Troubleshooting (Setting Performance Monitor Threshold Crossing Alerts and Using Mediatrace)
In this model, an organization leverages the proactive monitoring capabilities of Performance Monitor by setting threshold crossing alerts specific to applications of interest to be monitored. Organizations that do not possess an NMS with a NetFlow collector, but do have an NMS that supports SNMP or syslog, should consider this deployment model.
In this model, (illustrated in Figure 55 below) Performance Monitor is configured for the various threshold level, i.e., the jitter, loss or delay thresholds. If one of the thresholds is crossed, an SNMP or syslog alert is triggered.
Using the information from the alert to identify the flow, the NMS can automatically start a mediatrace, or allow the users to start a mediatrace, if they so wish.
Mediatrace will follow the flow path hop-by-hop, and collect the Performance Monitor metrics along the media path. The mediatrace result will be returned to the NMS, which will present it to the user.
In this deployment model:
• Performance monitor with Threshold Crossing Alerts (TCA) should be enabled in strategic places in the network to monitor business critical application (some NMSs support the threshold monitoring setup on the tool itself, so users can also utilize this option instead of setting up the TCAs in the device).
• Mediatrace responders should be enabled throughout the network.
• Mediatrace initiators should be enabled on the Cisco Medianet-capable devices that are closest to the endpoints.
• NMS should be setup to alert on the threshold crossing alerts.
Figure 55. NMS Triggers Mediatrace Based on SNMP or Syslog Trap
This deployment model allows for performance troubleshooting and fault isolation.
Endpoint-Driven Monitoring and Troubleshooting
In this deployment model, the organization uses Performance Monitor and Mediatrace built into the endpoints. Figure 56 (below) illustrates this deployment model.
In this model, the Performance Monitor function is not enabled on the network devices; instead, the endpoints will monitor the media performance and send performance metrics to the NMS.
On Cisco endpoints with MSI such as EX series, the media performance metrics can be accessed via the MSI REST interface.
If the NMS detects bad quality based on the endpoint performance reading, it can request the endpoint to start a mediatrace to get an end-to-end media performance reading along the media path. This essentially requires that the mediatrace responder is enabled across the network.
This model works well with Cisco Prime Collaboration Assurance (CPCA). The section, "Endpoint-driven End-to-end Troubleshooting (no network write access)" provides details on this model.
Figure 56. NMS Utilizes the Media Monitoring and Mediatrace Capability on the Endpoints
The main benefit of this deployment model is that the network devices are not required to consume their CPU cycle to run Performance Monitor. For some network devices that CPU resource is a concern, this model can lead to better network performance.
Table 31 (below) shows a summary of these deployment models.
Table 31. Comparison Among Different Deployment Models
Deployment models
Functions
Requirements
Who should adopt
Passive monitoring
Application monitoring;
Historical analysis;
traffic profiling and baselining;
network planning;
troubleshooting
Enable Performance Monitor on network devices
Organizations that already possess or are planning to acquire a NetFlow collector for traffic monitoring and analysis.
Proactive monitoring
Troubleshooting and Fault Isolation
• Performance monitor with TCAs enabled in strategic places in the network to monitor business critical applications.
• Mediatrace responders enabled throughout the network.
• Mediatrace initiators enabled on the Cisco Medianet-capable devices that are closest to the endpoints
Organizations that rely on SNMP or syslog for device management.
Endpoint-driven monitoring
Troubleshooting and Fault Isolation
• Endpoints need to have MSI
• Mediatrace responders enabled across the network
• NMS that can monitor endpoints and request mediatraces through the REST interface
Organizations that deploy endpoints with MSI.
The main benefit of this deployment model is that the network devices are not required to consume their CPU cycle to run Performance Monitor. For some network devices that CPU resource is a concern, this model can lead to better network performance.
Flow Metadata Classification Recommendations for UC Traffic
It is common for IT to differentiate between software client traffic and hardware client traffic. Traffic from hardware clients, such as TelePresence units may get better QoS treatment than the software client. Another differentiation factor would be whether the traffic is audio-only or video + audio. On the other hand, when designing QoS policy for soft client, it is not uncommon to prioritize audio-traffic only from soft clients over video + audio traffic. The following is a simple classification scheme based on the idea of differentiation of software client vs. hardware client and audio-only vs. audio + video:
Jabberphone video conferencing (audio+video)
Jabber phone audio only call (only audio)
Physical phone video conferencing (audio+video)
Physical phone audio only call (only audio)
Telepresence video
Telepresence audio
Telepresence data
WebEx desktop sharing
WebEx video
WebEx audio
Flow Metadata currently does not support hierarchy class-map. To avoid using hierarchy class-map, define multiple class-maps for the same class, and give them the same treatment under policy-map.
For example, to classify the video conferencing traffic generated by the software client, define two class-maps: one for software client video; one for software client audio. They look like this:
Class-map match-all soft-client-video
Match application attribute device-class software-phone
Match application attribute media-type video
Class-map match-all soft-client-audio
Match application attribute device-class software-phone
Match application attribute media-type audio-video
Then under the policy-map, these two class-maps will get the same treatment, for example:
Policy-map SET-DSCP
Class soft-client-video
Set dscp AF42
Class soft-client-audio
Set dscp AF42
Table 32 (below) illustrates how to classify the UC traffics mentioned earlier.
Table 32. UC Traffic Classification Breakdown
Classification breakdown
Class-map
Software phone video conferencing (audio+video)
Class-map match-all <video>
Match application attribute device-class software-phone
Match application attribute media-type video
Class-map match-all <audio-in-video>
Match application attribute device-class software-phone
Match application attribute media-type audio-video
Software phone audio only call (only audio)
Class-map match-all <audio-only>
Match application attribute device-class software-phone
Match application attribute media-type audio
Physical phone video conferencing (audio+video)
Class-map match-all <video>
Match application attribute device-class physical-phone
Match application attribute media-type video
Class-map match-all <audio-in-video>
Match application attribute device-class physical-phone
Match application attribute media-type audio-video
Physical phone audio only call (only audio)
Class-map match-all <audio-only>
Match application attribute device-class physical-phone
Match application attribute media-type audio
Telepresence media (video)
Class-map match-all <video>
Match application telepresence-media
Match application attribute media-type video
Telepresence media (audio)
Class-map match-all <audio>
Match application telepresence-media
Match application attribute media-type audio
Telepresence media (data)
Class-map match-all <data>
Match application telepresence-data
Webex video
Class-map match-all <video >
Match application webex-meeting
Match application match application attribute media-type video
WebEx audio
Class-map match-all <video >
Match application webex-meeting
Match application match application attribute media-type audio
WebEx desktop sharing
Class-map match-all <video >
Match application webex-meeting
Match application match application attribute media-type data