This document describes how Cisco® IT has migrated one of its business-critical Oracle E-Business Suite from HP Itanium servers to the Cisco Unified Computing System™ (Cisco UCS™) x86 platform. It discusses the strategies adopted to estimate and design the system, platform migration methodologies adopted to move from HP Itanium platform to Cisco UCS Linux x86-64 platform, and some of the performance benefits and the return on investment (ROI) achieved with Cisco UCS. It also discusses some of the best practices that were followed in the journey. While this was not the first migration by Cisco IT to Cisco UCS hardware, this was one of the largest mission critical Oracle Enterprise Resource Planning (ERP) implementation that Cisco has. Hence the focus of this white paper was mainly on this 40 TB database.
Disclaimer
The information provided here is based on the installation and migration of an Oracle ERP environment from an HP Itanium platform to Cisco UCS. This document is prepared as an aid to IT staff who plan to migrate their Oracle environments to Cisco UCS. The configurations used and results obtained in proof of concepts (POCs) are all meant to provide the reader with an overview of the approaches that were followed but in no way represent the optimal configuration of Cisco UCS. Every IT department has its own installation and setup methodologies, IT procedures, data center network design, etc., which may be different from Cisco's. Therefore, this document is meant only to provide guidance about sample migration approaches.
Target Audience
This document is intended to assist solution architects, system and storage administrators, database administrators, sales engineers, field engineers, and consultants in the planning, design, deployment, and migration of Oracle ERP systems to Cisco UCS servers. This document assumes that the reader has an architectural understanding of Cisco UCS servers, Oracle ERP systems, Oracle Real Application Clusters (RAC) technologies, and storage and networking concepts.
Purpose
The purpose of this document is to demonstrate the best practices followed in migrating Oracle ERP and database software; predesigning and estimating the Cisco UCS, storage, and network infrastructure; running POCs to validate the design; and planning the go-live activities.
While the paper focusses mainly on HP-UX Itanium to Cisco UCS as a case study, a similar strategy could be adopted for earlier generation of Superdomes or PA-RISC too.
The document is intended to help readers:
• Estimate the requirements for migration from an existing traditional system
• Implement a POC on a smaller model to understand the CPU and I/O metrics of the database for a similar type of workload
• Determine the final design with a sufficient buffer for failover and future growth and then perform tests to validate the design
Wherever needed, configuration data is also included along with post-go-live performance data.
Please note that every system is unique in it characteristics. The detailed analysis presented here was performed for the Cisco Customer Care (referred to in this document as C3) system database, considering the business importance, computing capacity (350 Intel cores), and I/O rate (6 GBps).
IT Decision Influences
Cisco moved its largest Oracle E-Business Suite database to Cisco UCS in March 2012. It migrated the 40 TB Oracle E-Business Suite database from HP Itanium to a Cisco UCS x86 platform. The C3 system hosts Oracle E-Business Suite Release 11i along with integrated applications such as service contracts, service and sales management (SSM) and in-house Java applications, and Perl and other third-party custom applications.
C3 is a critical business system for Cisco IT, handling US$40+ billion in business operations. Migration to an x86 platform has posed many challenges for the IT staff and senior management. The migration also had to be aligned with the data center enterprise architecture roadmap and had to entail little interruption of the business.
The existing HP Superdome platform was not scaling sufficiently to keep up with business requirements.
Limitations of this traditional system included the following:
• The HP Superdome platform required considerable capital expenditures (CapEx) and operating expenses (OpEx).
• The traditional three-node vertically aligned architecture was not scalable, and the cost to add capacity was high (approximately US$2 to 3 million to add a node).
• Cisco IT had reached the 128-core limit for vertical growth on each node.
• There were frequent instances in which a single CPU failure would result in application outages, and failover and failback were very resource intensive, interrupting the business.
• Any hardware upgrade resulted in significant downtime and affected the business.
• There is uncertainty regarding future Oracle support on HP Itanium platform.
The following are few of the benefits that Cisco IT realized by migrating its critical E-Business suite application from HP Superdomes to Cisco UCS.
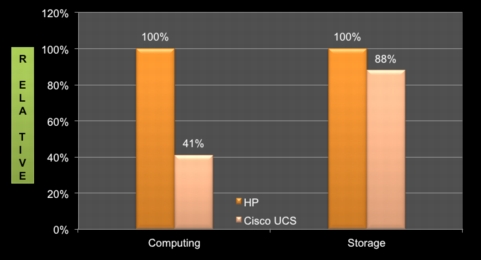
• Lowered its Capital and Operating expenses to the tune of 60%.
• Capitalized savings of around 300% in power and 400% in Floor Space.
• Scaled the system to almost 2 times the capacity of its predecessors.
• Moved from legacy vertically scaled model to horizontally scaling x86 models giving the ability to add more Cisco UCS nodes as the need arises.
• Eliminated application disruption due to single node failures.
• Separated online and offline batch processing jobs to minimize the impact of one on the other.
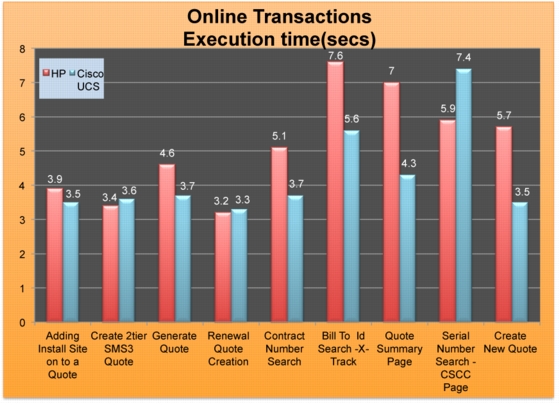
• Realized around 15 to 20% benefit in long running batch programs execution.
• Scaled up the Oracle RAC Interconnect to around 10gE (actual observed as 300-400 MBps) which earlier was limited around 150-200 MBps, thus increasing Oracle RAC interconnect performance and hence the application.
• Minimized application downtime through rigorous testing and planning.
• Introduced Virtual machines for the application form and web tiers, thus increasing server utilization, business continuity and IT efficiency.
This paper provides comprehensive details on how Cisco IT achieved this milestone.
Overview of Cisco UCS
Cisco UCS unites computing, networking, storage access, and virtualization resources into a single cohesive system. When used as the foundation for Oracle RAC, database, and ERP software, the system brings lower total cost of ownership (TCO), greater performance, improved scalability, increased business agility, and Cisco's hallmark investment protection.
The system represents a major evolutionary step away from the current traditional platforms in which individual components must be configured, provisioned, and assembled to form a solution. Instead, the system is designed to be stateless. It is installed and wired once, with its entire configuration-from RAID controller settings and firmware revisions to network configurations-determined in software using integrated, embedded management.
The system brings together Intel Xeon processor-powered server resources on a 10-Gbps unified fabric that carries all IP networking and storage traffic, eliminating the need to configure multiple parallel IP and storage networks at the rack level. The solution dramatically reduces the number of components needed compared to other implementations, reducing TCO, simplifying and accelerating deployment, and reducing the complexity that can be a source of errors and cause downtime.
Cisco UCS is designed to be form-factor neutral. The core of the system is a pair of Fabric Interconnects that link all the computing resources together and integrate all system components into a single point of management. Today, blade server chassis are integrated into the system through Fabric Extenders that bring the system's 10-Gbps unified fabric to each chassis.
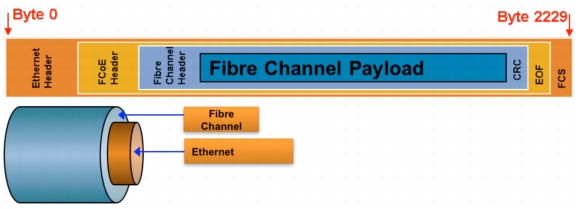
The Fibre Channel over Ethernet (FCoE) protocol collapses Ethernet-based networks and storage networks into a single common network infrastructure, thus reducing CapEx by eliminating redundant switches, cables, networking cards, and adapters, and reducing OpEx by simplifying administration of these networks (Figure 1). Other benefits include:
• I/O and server virtualization
• Transparent scaling of all types of content, either block or file based
• Simpler and more homogeneous infrastructure to manage, enabling data center consolidation
FCoE
Figure 1. FCoE Architecture
Fabric Interconnects
The Cisco Fabric Interconnect is a core part of Cisco UCS, providing both network connectivity and management capabilities for the system. It offers line-rate, low-latency, lossless 10 Gigabit Ethernet, FCoE, and Fibre Channel functions.
The Fabric Interconnect provides the management and communication backbone for the Cisco UCS B-Series Blade Servers and Cisco UCS 5100 Series Blade Server Chassis. All chassis, and therefore all blades, attached to the Fabric Interconnects become part of a single, highly available management domain. In addition, by supporting unified fabric, Fabric Interconnects support both LAN and SAN connectivity for all blades within their domain. The Fabric Interconnect supports multiple traffic classes over a lossless Ethernet fabric from a blade server through an interconnect. Significant TCO savings come from an FCoE-optimized server design in which network interface cards (NICs), host bus adapters (HBAs), cables, and switches can be consolidated.
The Cisco UCS 6140XP 40-port Fabric Interconnect that was used in the C3 design is a two-rack-unit (2RU), 10 Gigabit Ethernet, IEEE Data Center Bridging (DCB), and FCoE interconnect built to provide 1.04 terabits per second (Tbps) throughput with very low latency. It has 40 fixed 10 Gigabit Ethernet, IEEE DCB, and FCoE Enhanced Small Form-Factor Pluggable (SFP+) ports.
Fabric Extenders
The Cisco Fabric Extenders multiplex and forward all traffic from blade servers in a chassis to a parent Cisco UCS Fabric Interconnect from 10-Gbps unified fabric links. All traffic, even traffic between blades on the same chassis, is forwarded to the parent interconnect, where network profiles are managed efficiently and effectively by the Fabric Interconnect. At the core of the Cisco UCS Fabric Extender are application-specific integrated circuit (ASIC) processors developed by Cisco that multiplex all traffic.
Up to two Fabric Extenders can be placed on the blade chassis. The Cisco UCS 2104XP Fabric Extender, the one used for C3, has eight 10GBASE-KR connections to the blade chassis midplane, with one connection per Fabric Extender for each of the chassis's slots. This configuration gives each half-slot blade server access to each of two 10-Gbps unified fabric-based networks through SFP+ sockets for both throughput and redundancy. It has four ports connecting the Fabric Interconnect and offers:
• Connection of the Cisco UCS blade chassis to the Fabric Interconnect
• Four 10 Gigabit Ethernet, FCoE-capable SFP+ ports
• Built-in chassis management function to manage the chassis environment (the power supply and fans as well as the blades) along with the Fabric Interconnect, eliminating the need for separate chassis management modules
• Full management by Cisco UCS Manager through the Fabric Interconnect
• Support for up to two Fabric Extenders, enabling increased capacity as well as redundancy
• Up to 80 Gbps of bandwidth per chassis
Blade Chassis
The Cisco UCS 5100 Series Blade Server Chassis is a crucial building block of Cisco UCS, delivering a scalable and flexible blade server chassis.
Cisco UCS Manager
Cisco UCS Manager provides unified, embedded management of all software and hardware components of Cisco UCS through an intuitive GUI, a command-line interface (CLI), or an XML API. Cisco UCS Manager provides a unified management domain with centralized management capabilities and can control multiple chassis and thousands of virtual machines.
Cisco UCS B440 M1 and M2 High-Performance Blade Servers
The Cisco UCS B440 M1 and M2 High-Performance Blade Servers are full-slot, 4-socket, high-performance blade servers offering the performance and reliability of the Intel Xeon processor E7-4800 product family and up to 512 GB of memory. The Cisco UCS B440 supports four Small Form Factor (SFF) SAS and SSD drives and two converged network adapter (CNA) mezzanine slots for up to 40 Gbps of I/O throughput. The Cisco UCS B440 blade server extends Cisco UCS by offering increased levels of performance, scalability, and reliability for mission-critical workloads.
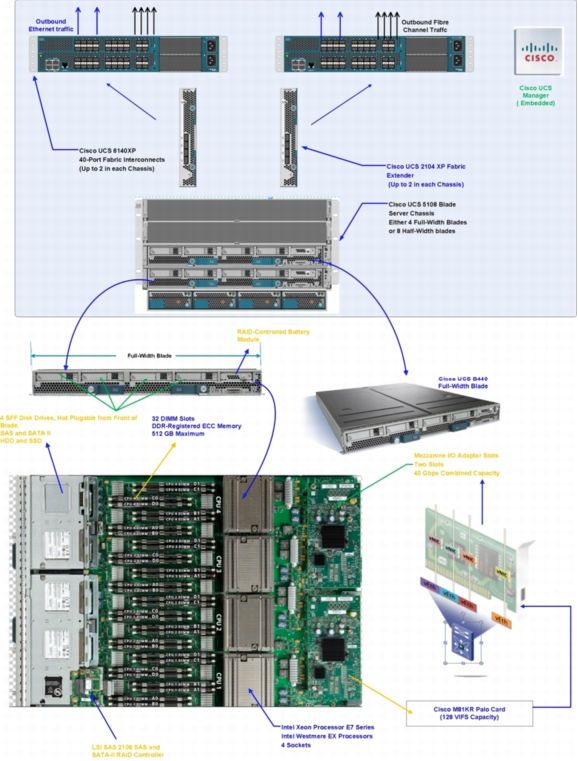
The Cisco UCS components are shown in Figure 2.
Figure 2. Cisco UCS Components
Cisco UCS Service Profiles
Cisco UCS resources are abstract in the sense that their identity, I/O configuration, MAC addresses and worldwide names (WWNs), firmware versions, BIOS boot order, and network attributes (including quality of service (QoS) settings, pin groups, and threshold policies) are all programmable using a just-in-time deployment model. The manager stores this identity, connectivity, and configuration information in service profiles that reside on the Cisco UCS 6100 Series Fabric Interconnects. A service profile can be applied to any blade server to provision it with the characteristics required to support a specific software stack. A service profile allows server and network definitions to move within the management domain, enabling flexibility in the use of system resources. Service profile templates allow different classes of resources to be defined and applied to a number of resources, each with its own unique identities assigned from predetermined pools.
Anticipated IT Benefits
IT hoped to gain these benefits:
• Hardware resiliency: Single points of failure (for example, multiple hosts, multiple chassis, network routes, and redundancy at each layer) are avoided.
• Application-connection load balancing with automated failover: All connections are load-balanced over at least two physical nodes within the Oracle RAC cluster, using Oracle RAC services as the logical layer for incoming connections. Each service has at least one identified failover node in the event of any database component failure. Failover of service to another node is automatic and transparent, with no business interruption from the loss of any single component (or in some cases multiple failures on the back-end Oracle database tier). No application restarts are needed to implement failover when the database node is unavailable. The main benefit is scalability through automated load balancing and availability through automated failover.
• Horizontal model: Fewer applications use each node or subset of nodes within the larger cluster. In the event of any kind of failure, the impact is reduced. In this model, failed components can be replaced while the remaining components handle the workload. This model also has the flexibility to scale through the addition of nodes or movement of services from overutilized nodes to underutilized nodes as needed.
• Workload distribution: By separating offline processing from online processing, the effects of performance impact on customers and partners are mitigated. In the past, offline processing has brought down entire nodes, affecting online processing. Online and Offline processing is segregated that maintain isolation from other critical business processes. This approach enables increased processing by a single application without negatively affecting other applications.
Based on analysis of FY11 support cases opened, at least 21 percent of the issues could have been avoided all together or the business impact could have been mitigated through load distribution and horizontal scaling.
A careful design with POCs and an implementation model with rollback strategies and with no or little negative effect on the business was required.
Challenges for the C3 Transformation Project
Project challenges included:
• Completion of an end-to-end design: from the database, servers, and switches to storage
• Conversion from HP UNIX Itanium (big endian) to Linux x86 64 (little endian)
• Conversion from 3-node Oracle RAC to 12-node Oracle RAC
• Implementation of Oracle 11.2.0.2 Automatic Storage Management (ASM) and Cluster Ready Services (CRS) stack
• Platform migration of 40 TB database with little downtime
• Services enablement and failover strategies
• Volume manager solution on Linux
• Complete computing and Cisco UCS design
• Implementation of networking switches and gateways with multiple paths
• Implementation of storage infrastructure for production, nonproduction, and test systems
• Backup, cloning, storage migration, refresh design, and optimization
C3 System Load Analysis
An analysis of the load for the C3 system is shown in Table 1.
Table 1. C3 System Load Analysis
Category
Count
Load
Notes
Online applications
141
49%
• All Java Virtual Machines (JVMs) connecting to C3
Business process integration and management (BPIM) applications
38
< 1%
Load placed by TIBCO JVMs
Administrative jobs
11
< 1%
Replication jobs
Total
402
100%
Design Methodology
Metrics and Data Collected to Supplement the Design
• Load and I/O metrics coming into C3 (for a 6-month period)
– Capture load and I/O statistics using the schema or OS user or execution module and align each connection with an application.
– Slice the data based on technology and data affinity (type of data consumed by connection).
– Create a load metrics ratio for mapping the hardware (transactions per second [TPS]).
– Create an I/O metrics ratio for mapping the hardware I/O throughput.
– Based on the data affinity, technology, TPS, and I/O throughput, group applications for Oracle RAC services.
– Align Oracle RAC services with hardware based on capacity benchmarks performed against hardware.
• Historical data
– Capture historical CPU utilization by node.
– Capture historical I/O throughput by node.
– Generate quarter-over-quarter growth estimates based on historical trends.
• Organic growth
– Generate estimate based known business projections and some factor for unknowns.
• Inorganic growth
– Generate estimates based on pending acquisitions.
• Operation improvements
– Optimize existing applications (focusing on known bottlenecks and challenges such as top SQL processes).
– Retire applications.
– Migrate applications to the new platform.
Design and Architecture Methodology Used
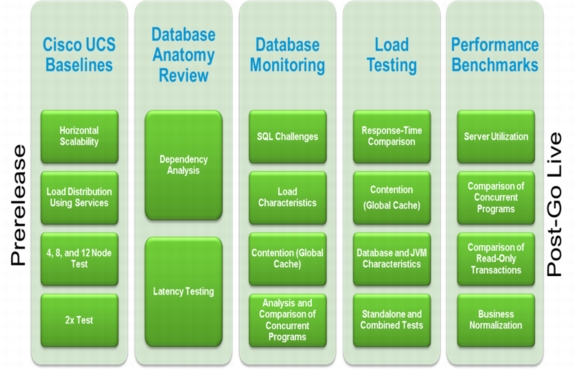
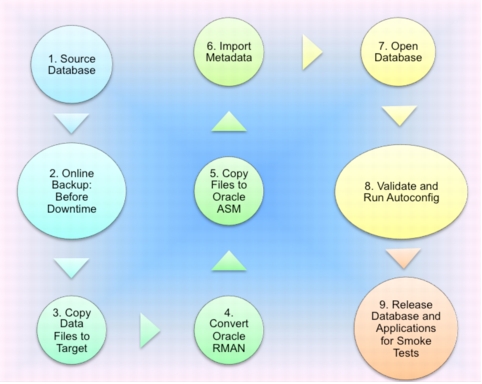
The following methodology was used for the C3 solution (Figure 3):
• Application profiling
– Captured consumption metrics (CPU and I/O) by application name and functional area
– Further categorized metrics by technology and application group (data affinity)
– Trended the data over six months
• Application services segmentation
– Calculated and analyzed load demands based on technology and application grouping
– Based on similar load demands, aligned corresponding applications with service segments
• Logical design
– Using service segments, historical growth trends, planned growth, and hardware benchmarks, calculated database nodes
– Aligned service segments with nodes, taking into consideration growth and failover
• Physical design
– Mapped logical design to the physical design, taking into consideration physical limitations (I/O, CPU, and storage)
– Planned POC to verify and validate design
Figure 3. C3 Transformation Approach to Validate Design
Capacity and Scalability Strategy Used
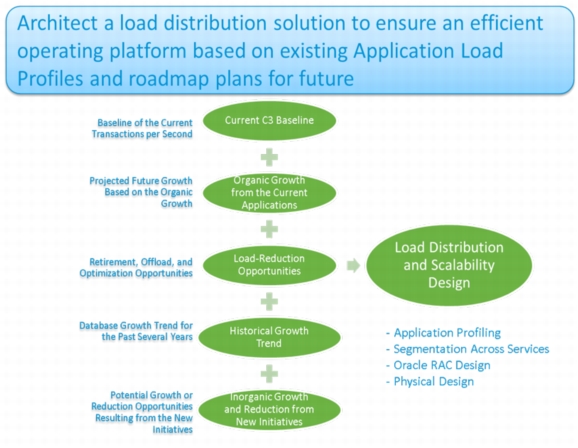
To estimate the capacity requirements, the current requirements for the database, including TPS and throughput in Mbps and I/O operations per second (IOPS), were captured, and then the organic and inorganic growth was added to arrive at the final design (Figure 4).
Figure 4. Capacity and Scalability Strategy
Overall C3 Architecture
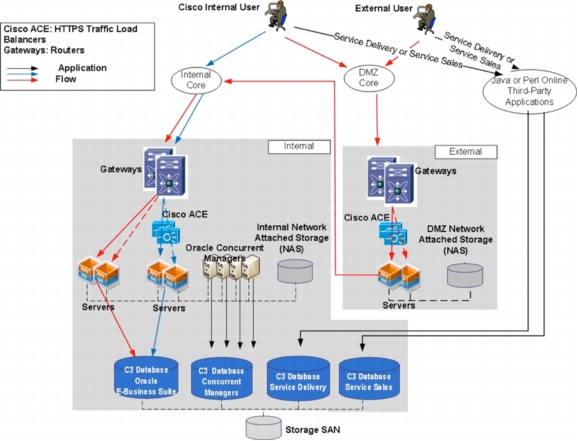
Figure 5 shows the overall architecture of C3 at a high level.
Figure 5. Overall C3 Architecture
C3 Architecture Evolution
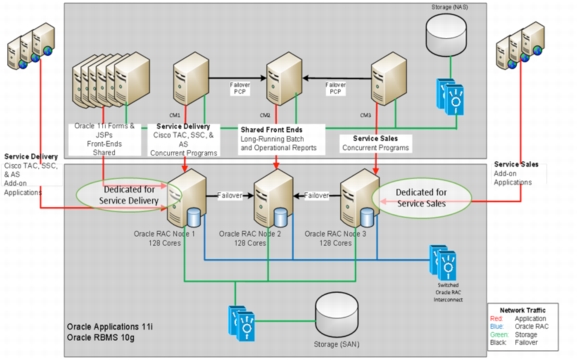
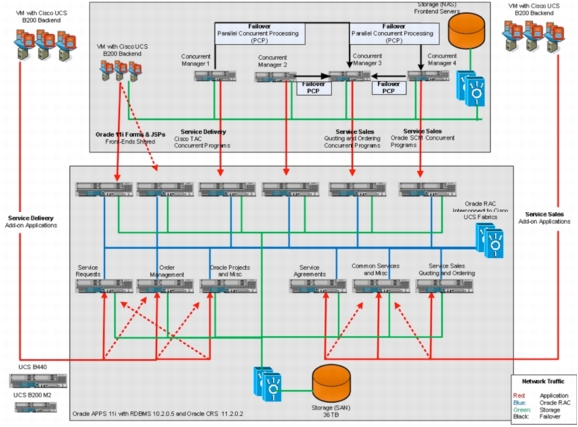
Figure 6 shows the existing design before migration, and Figure 7 shows the design after migration.
Figure 6. C3 Architecture Before Migration: Three HP Superdome Platforms
• Only Manual Load Balancing and Failover
• Single Point of failure in Cisco services
Figure 7. C3 Database Architecture after Migration: 12-Node Oracle RAC and Cisco UCS B440 M1 Servers
• Highly active, revenue impacting OLTP database
• Based on EBS 11i, 10g RDBMS and 11gR2 CRS ~ 200+ Add-on applications
• 12 Node RAC on Cisco UCS
• 32 Cores each Xeon 7500, 256 GB RAM, EMC SAN
• ~ 40 TB DB size
• Redo of 5 TB/day
• ~ 8000+ sessions from Conc. managers and JVM connections
• 6.5 GBps of IO throughput.
This document describes how different teams and subject-matter experts addressed different challenges and what strategies they followed to achieve the final design. The following sections provide a brief overview of the components designed, installed, and configured.
Oracle Database, E-Business Suite, and Service Contracts
The C3 Oracle RAC setup was complex, needing careful design and rigorous testing before the strategy used for deployment was validated. A separate POC was implemented to validate Oracle Release 11.2.0.2 suitability for Oracle RAC and ASM with the database on Oracle 10gR2 (Table 2).
Table 2. Technology Components
Technology Components
Oracle CRS stack
Oracle Release 11.2.0.2.4
Oracle ASM stack
Oracle Release 11.2.0.2.4
Oracle Relational Database Management System (RDBMS) stack
Oracle Release 10.2.0.5.5
Oracle ERP
Oracle Release 11i
Predesign Requirements
Information about Oracle requirements needs to be collected and validated (Table 3):
• The database has to remain on Oracle Release 10gR2 only because of few business application constraints.
• The business cannot upgrade Oracle E-Business Suite from Release 11i to Release 12 under the current constraints.
• The database has to be moved as is with little downtime or negative impact on the business.
Challenges on Oracle RAC Design
• Limitations and support for Oracle 10gR2 database with Oracle 11gR2 CRS along with Oracle RAC and ASM.
• Scalability, compute architecture and capacity required on UCS to meet the application requirements.
• Load balancing design, configuration and adoption of services model, options analysis and solution verification.
• Capacity planning, historical trending data analysis and future growth projections.
• Services model grouping strategy, distribution and scalability across UCS nodes (Oracle E-Business Suite, concurrent managers, custom applications, etc).
• Strategy and design of a N+1 architecture to minimize business impact due to component (hardware and software) failures.
• Load simulation, solution to test actual application load in new environment and failover testing strategy.
• Oracle RAC interconnect scalability, challenges and mitigations.
Challenges on Oracle ASM Design
• Volume manager solution for a 40 TB Database, ASM and other options analysis to determine best solution to meet reliability and scalability requirements on Linux.
• Oracle ASM adoption and design of functional as well as failover test cases.
• Oracle ASM integration with existing procedures such as backup, cloning, disaster recovery and internal reporting tools.
• ASM disk group design and spindle considerations to allow for instance refresh onto EMC and NetApp technologies.
• Instance refresh options with Oracle ASM and integration to existing Cisco IT processes.
• ASM AU tunable settings for data file and redo operations and implications on scalability and performance.
Table 3. Requirements Collected for Validation as Part of Oracle RAC and ASM Projects
Oracle RAC
Database
1. Validate Oracle RAC and ASM 11gR2 with the Oracle 10gR2 database.
2. Depending on the design criteria, extend POC to 8- or 12-node Oracle RAC.
3. Explore Oracle RAC server-side load balancing limitations when working along with services model.
4. What operation scripts exist for services failback, and what scripts must be developed?
5. Conduct destructive test cases to verify Oracle RAC stability with and without loads.
6. What new features of Oracle RAC can be used?
7. Are there any limitations in working with Oracle RAC 11gR2 with the Oracle 10gR2 database?
8. What if database is migrated to Oracle 11gR2 in the future?
9. Perform performance benchmark for a 2-node Oracle RAC and extend it to 8 or 12 nodes.
10. Verify capacity utilization using Oracle Real Application Testing with twice the capacity.
11. Verify services model, failover strategies, and operationalization.
12. Evolve the Oracle RAC code trees for cloning and standards and conventions.
Oracle ASM
Database
13. Do not co-host the database in the same disk group.
14. Make only minimal changes to existing database monitoring scripts.
15. Take ownership of Cisco ASM.
16. Separate Oracle Cluster Registry (OCR) and voting from data and redo disk groups.
Hosting
17. Clone multiple databases on the same host (nonproduction systems) and have up to 120 TB of storage per host. Identify any Oracle ASM limitations, the number of logical unit groups (LUNs) presented to the host, and the number of disk groups when 120 TB of storage is presented.
18. Work on tools to monitor and diagnose performance data.
19. Divide performance problems into categories such as database, host, storage, etc.
Migration
20. Should be able to move from one frame to another.
21. Should be able to move between heterogeneous systems such as EMC and NetApp.
22. Should be able to throttle I/O during migration.
23. Data consistency should be maintained with no or minimal impact during migration.
24. No data failures should occur if a LUN failure occurs during migration.
Backup and Refresh
25. Should be able to back up to both disk and tape
26. Should be able to back up, refresh, and duplicate from multiple hosts to multiple hosts in an Oracle RAC setup and use the CPU capacity of all the Oracle RAC hosts in the cluster.
27. Backup and refresh operations should be multithreaded.
28. The solution should meet existing service-level agreements (SLAs).
Storage
29. The solution should survive single-path or multipath failures, and the database should be recoverable.
30. The solution should be transparent to underlying technologies such as EMC Fully Automated Storage Tiering (FAST) and Virtual Provisioning.
31. The solution should be transparent to NetApp Deduplication and FlexClone technologies.
32. The solution should be flexible enough to allow tiering, information lifecycle management (ILM), solid state drives (SSDs), and other such future technologies being planned to be adopted in the future.
Oracle CRS and ASM 11.2.0.2 Installation
The standard methodology for installing Oracle CRS and ASM on each node was followed. Because of the number of nodes involved and the number of downstream systems such as testing, staging, and patching systems, a tar ball file was created as part of the installation that was later rolled out.
Few specific steps for installing Oracle CRS and ASM included the following:
• Oracle 11.2.0.2 requires a multicast setup. Details about the multicast setup requirements are provided in the Networking section under Multicasting for Cisco UCS Traffic of this document.
• The Oracle ASMLIB API was installed as part of the setup for simpler maintenance and to retain the LUN names after subsequent reboots. Details are provided in the Oracle ASM Install section of this document.
• After installing CRS, jumbo frames were enabled for private interconnect traffic. The changes required on the Fabric Interconnect and northbound switches are detailed in the Networking section under Jumbo Frames.
Oracle RAC installation steps included the following:
• Download and run cluvfy to verify that all hardware and networking requirements for installing Oracle CRS are in place.
• Extract the code tree for Oracle RAC and ASM created earlier. For details about how to create the code tree after the initial installation with Oracle Universal Installer (OUI), please see the relevant Oracle documentation.
• Modify the crsconfig parameters and run clone.sh. Appendix C provides insight into what crsconfig parameters were changed. Change the LUNs for OCR and the voting in the file appropriately for Oracle to create a disk group with these LUNs.
• Run rootcrs.pl on the master node followed serially by all other nodes for the Oracle CRS installation.
• Validate the installation by running cluvfy, ocrcheck, and crsctl health checks on all the nodes.
The following recommended Oracle ASM and RAC settings were used because of the solution's huge footprint and found optimal for Cisco IT setup.
• Check that the Oracle ASM listener is registered with Oracle CRS. Oracle ASM is a resource for Oracle CRS as well.
• Disable Oracle ASM Cluster File System (ACFS) modules if they are not being used.
• Create an audit destination directory on a local file system instead of the default value of ${ORACLE_HOME}/rdbms/audit.
• Modify the Oracle ASM parameters as follows:
– memory_target = 1025M
– sessions = 500
– Reset sga_target, sga_max_size, etc. according to metalink note 1279458.1.
The following parameters were found to be optimal while testing with the Cisco UCS B440 blade server for the given workload. These values may vary depending on workload characteristics.
db_writers = 8
log_archive_max_processes >= 4
gcs_server_processes = 8
parallel_max_servers = 64
redo_log_size = 2G
Tables 4 and 5 list the Oracle ASM disk group conventions used.
Table 4. Oracle ASM Disk Group Conventions Used
Oracle ASM Disk Group Type
Oracle ASM Disk Group Upper Limit
EMC LUN Size
NetApp LUN Size
Redundancy
Comments
Data
8704 GB
136 or 272 GB
544, 1088, or 1632 GB
External
• Increase in multiples of 8.5 TB maximum per disk group
• NetApp (nonproduction): For < 4.3-TB disk groups, precreate 2 TB minimum with four 544-GB LUNs; for 4.3- to 8.5-TB disk groups, precreate 8 TB minimum with eight 1088-GB LUNs; for > 8.5-TB disk groups, precreate 12.75 TB with eight 1632-GB LUNs
• EMC: Create actual number required in multiples of 4 LUNs; use 136-GB LUNs for < 1-TB disk groups, and 272-GB LUNs for >= 1-TB disk groups
Table 5. Additional Oracle ASM Disk Group Conventions Used
Disk Group ID
Disk Group Description
NetApp Deduplication Candidate
Oracle ASM
Single or Multiple Oracle ASM Disk Groups (per Environment)
Oracle ASM Disk Group Upper Limit (GB)
Production (EMC) LUNs (GB)
Non-production NetApp) LUNs (GB)
EMC and NetApp LUN Ratio
dgoracle
Oracle code tree
No
No
-
-
68
68
-
DT
Data
Yes
Yes
Multiple
13,056
136
544
4:1
272
1088
4:1
1632
6:1
RC
Redo and control file
No
Yes
Single
1024
8
8
1:1
RC_M
Mirrored redo and control file
No
Yes
Single
1024
8
8
1:1
AR
Archive
No
Yes
Single
17,408
136
544
4:1
272
1088
4:1
1632
6:1
PAR
Purge and archive
No
Yes
Single
17,408
136
544
4:1
272
1088
4:1
1632
6:1
FRA
Flash memory recovery
No
Yes
Single
17,408
136
544
4:1
272
1088
4:1
1632
6:1
CL
OCR and voting
No
Yes
Single
6
1
1
1:1
Observations while running Oracle 10g RDBMS with Oracle CRS 11g stack:
• While running an Oracle 10g database with Oracle RAC 11g, pin the nodes with the crsctl pin css command.
• Use always $ORACLE_HOME/bin/srvctl for registering the services. Do not use Oracle 11g srvctl to register an Oracle 10g service or the opposite.
Tables 6 and 7 summarize setup test cases.
Table 6. Destructive Test Cases Run on Cisco UCS Setup with Oracle RAC
Test
Activity
Expected Behavior
Status
Host failure
Let the system run stable under CPU, I/O, and interconnect stress tests. Reset the blade ungracefully.
Disconnection of a single blade should not cause a hang or delay in the Ethernet or SAN network due to reconfiguration. When the blade is up, the cluster should reconfigure without problems.
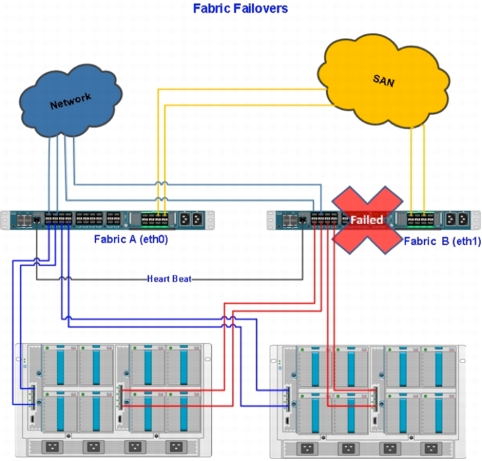
Fabric failure
Let the system run stable under CPU, I/O, and interconnect tests with approximately 90% of CPU and I/O utilization. Reboot Fabric A. Wait until Fabric A comes up and then reboot Fabric B.
No node or instance evictions should be observed. The traffic should failover to the other fabric. I/O throughput may degrade because of loss of one set of paths.
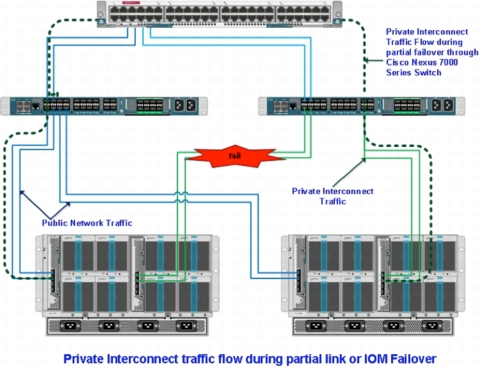
I/O module (IOM) failure
Run system load a/a and remove IOM 2 (chassis 2).
In the case of multiple chassis, the failure of IOM 2 (chassis 2), will cause the private network to go through a northbound switch such as a Cisco Nexus® 7000 Series Switch to return to healthy Fabric B and then reach IOM 2 (chassis 1) and hence blades on the other chassis. No node or instance evictions should be observed.
Private network failure
Run system stress load a/a. Disable Enable failover for Fabric Interconnect B and then reboot Fabric Interconnect B.
Nodes should be evicted from the cluster and reboot, and the master node should survive.
Public network failure
Run system stress load a/a. Disable Enable failover for Fabric Interconnect A and then reboot Fabric Interconnect A.
A private interconnect is available on Fabric B, and SAN connectivity exists. No interruption on the cluster should occur. Only Secure Shell (SSH) to the nodes will not work during the reboot.
Multiple-node and Oracle Cluster Synchronization Services (CSS) reconfiguration
Implement multinode power-on and failure during reconfiguration, with busy Oracle CRS threads.
1. Start with one or more nodes shut down.
2. Start the client workload.
3. Locate the oldest CRSD daemon.
4. Before the crs_* command actions return, run POWERON against various nodes using Linux KVM (Kernel Virtual Manager) console.
5. While reconfiguration is in progress, enter a RESET (hard failure) command against one or more active nodes (including the master) from the same remote console.
The node should be evicted from the cluster. Surviving instances should not be affected except for relocation of services and connection failover. When the node returns, the instances will restart.
Kill Oracle Cluster Synchronization Service Daemon (OCSSD) on the Oracle CRS Daemon (CRSD) and OCR master, with busy CRSD threads
1. Identify the background process identifier (PID) for the OCSSD whose CRSD has the earliest start time (OCSSD of the master node).
2. Run CHECK actions against the local instance resource and services on this node.
3. Enter kill -9 on the OCSSD PID.
The node reboots and should join the cluster successfully. Clusterwide I/O operations should continue uninterrupted without any cluster failures. Oracle Clusterware resources managed by the Oracle CRS master either go offline or failover to a surviving Oracle RAC node.
Delete and add nodes to the cluster
Delete a node (completely power off), remove entries from OCR, and then add a node to the cluster.
Time the whole operation.
Table 7. ASM Test Cases
Test
Activity
Expected Behavior
Status
Dropping an Oracle ASM disk from a disk group; repeat for rebalancing of various power limits
Drop an Oracle ASM disk either through SQL*Plus or the Oracle ASM command line.
Rebalancing should continue. Observe the impact on performance. No interruptions to business should occur.
Repetition of the previous test now undropping a disk
Enter the undrop command before rebalancing completes.
No interruption to business should occur.
Oracle ASM operational tasks such as removal of active database files
Enter the drop command for the database files.
The system should not allow a file to be dropped.
Unplanned Oracle ASM instance failures
Kill the Oracle ASM instance on a node.
No data loss is expected.
Validate cloned copy of a database importable on the same nodes (no disk group conflict)
Create a clone, use the renamedg and renamedisk commands, and import on the same hosts.
The disks will be imported with a different name to the Oracle ASM metadata, and after the database is renamed, a copy of the database should open on the same node as the parent.
Loss of mutitpath set across all nodes
Forcefully unmask one set of LUNs.
Loss of path should not cause any failures in the database. This test applies to data, redo operations, and OCR and voting disk groups.
Addition of new disks
Add a new set of disks.
Oracle ASM should discover the disks, and the LUNs should be added to the disk groups.
Tables 8 and 9 summarize Oracle service configuration.
Table 8. Oracle RAC Services Configured
Service Name
Primary Instance
Failover Instance
Application
DB_SRVC_PRJ
Instances 6 and 11
Instance 9
Oracle projects
DB_SRVC_MSC
Instances 9 and 11
Instance 6
Miscellaneous
DB_SRVC_QOT
Instances 10 and 12
Instance 8
Quoting
DB_SRVC_SAIB
Instances 8 and 10
Instance 12
Service agreements and installed base
DB_SRVC_OM
Instances 9 and 11
Instance 6
Order management
DB_SRVC_SR
Instances 6 and 9
Instance 11
Service requests
DB_SRVC_EBS
Instances 2 and 4
Instance 6
Oracle 11i forms and JVM
DB_SRVC_CM1
Instance 1
Instance 3
Service sales CM1 Oracle SCM (supply chain management) jobs
DB_SRVC_CM2
Instance 3
Instance 7
Service sales CM2: POM (Partner Opportunity Management, SOM (Service Opportunity Management), IB (Install Base), PA (Pending Automation), and SRM (Service Request Management) jobs.
DB_SRVC_CM3
Instance 7
Instance 5
Service sales CM3: Q&O (Quoting and Ordering) and service configuration
DB_SRVC_CM4
Instance 5
Instance 1
Service delivery CM4: CITS (Connected IT Services) jobs
DB_SRVC_OTH
Instances 2 and 11
Instance 10
Miscellaneous connections
Table 9. Services Configuration, Load Balancing, and Failover Simulation
Services configuration
• Standardized configuration of Oracle RAC services for custom applications as well as Oracle E-Business Suite forms, JVMs, and concurrent managers
• Enables monitoring of database performance based on service
• Use of single client access name (SCAN) for connecting to database; enables database node name to be transparent to client, allowing node additions and deletions without affecting applications
• Reconfiguration of services transparent to applications
Load balancing
Criteria: Help ensure high availability for applications maintaining data affinity.
Test hybrid load balancing (both workload based and server side).
Failover simulation
More than 30 applications in various categories have been tested, with transparent failover for most of the applications.
For all Oracle middle tiers, a smaller footprint Cisco UCS B200 Blade Server were used (Table 10).
Table 10. Oracle Middle Tier Services
Cisco UCS Blade Server
Number of Nodes
Bare Metal or Virtual
Forms and web nodes
Cisco UCS B200
4 (internal) and 2 (external)
Virtual
Concurrent managers
Cisco UCS B200
4
Bare metal
Custom applications
Cisco UCS B200
Many
Virtual
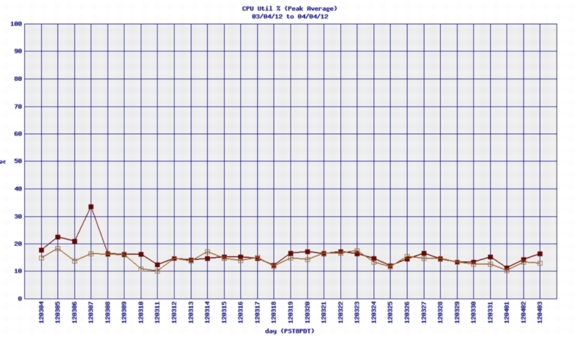
The old concurrent manager front-end nodes were configured with eight cores. Considering future growth, Cisco IT decided to keep the concurrent manager nodes on the physical server using the Cisco UCS B200 M2, providing 12 cores.
Current virtual machine configurations are limited to eight cores with VMware vSphere 5 being certified internally to enable additional capacity. However, the peak CPU utilization on the front-end concurrent manager nodes after the system went live was observed to be as low as 15 percent. After observing the utilization over a quarter-end period, Cisco plans to move the front-end concurrent manager nodes to virtual infrastructure as well.
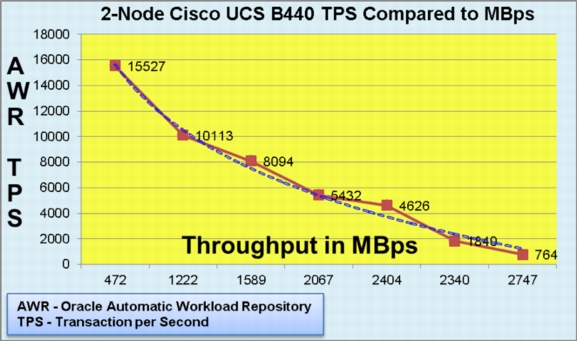
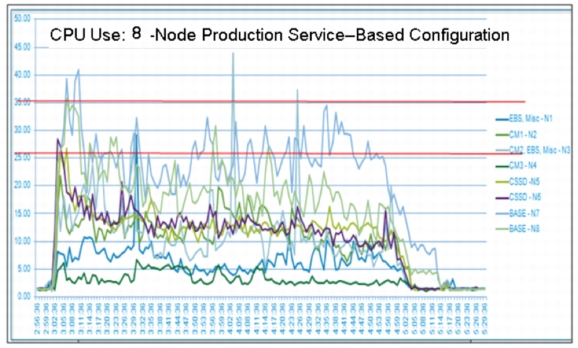
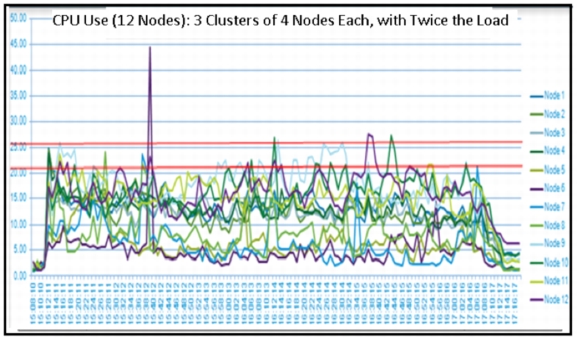
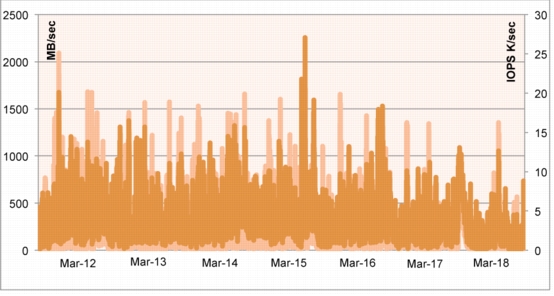
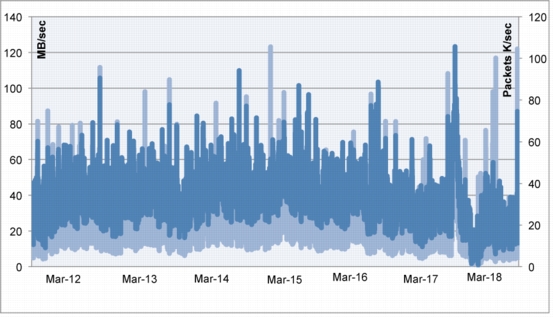
Two-Node Scalability and Performance Tests
To predict performance, CPU, I/O, and Fabric Interconnect behavior, tests were first conducted on a two-node Oracle RAC. This test was conducted to understand I/O behavior and Oracle RAC interconnect performance.
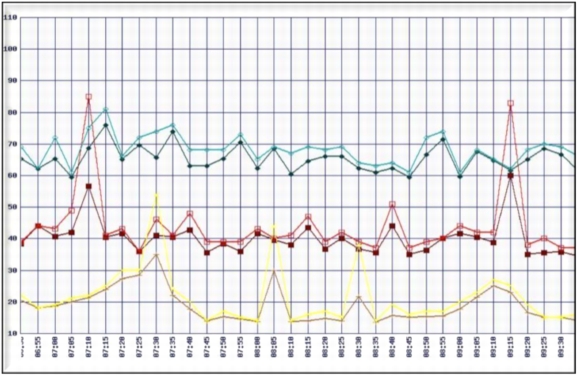
The values shown in Figure 8 were obtained in a controlled environment in which tools such as Swingbench, in-house scripts, and Oracle RAC scripts were run. The system carried 300 MBps of interconnect load while generating the desired throughput at various levels of transactions per second output. There were limitations on storage and Fibre Channel adapter ports as this was a standalone test setup and this test was conducted just to understand what needs to be done to support the C3 architecture.
Figure 8. I/O, CPU Behavior with Oracle RAC Interconnect
The test results yielded the following conclusions:
• Eight nodes may be needed for C3 and any further scale up for headroom or to accommodate any failures may require additional nodes.
• There was a need to understand the number of transactions per second and also the throughput in MBps from each service to segregate them and to design a healthier service failover methodology.
• Splitting the system into four discrete sets using RAC services (Oracle E-Business Suite, Concurrent Managers, Service Delivery, and Service Sales) within the same Oracle RAC cluster and using the services model and introducing the N+1 architecture resulted in a 12-node design.
Red Hat Linux Kernel
A standard Red Hat Enterprise Linux (RHEL) 5.5 kernel (Release 2.6.18-238) was used for the Oracle database. A few changes were made on top of the standard Linux kernel. These changes are discussed here.
Multipathing Software
EMC PowerPath 5.5 was used because Oracle ASM does not provide multipathing capabilities. EMC PowerPath is host-based software that provides intelligent I/O path and volume management for storage subsystems and EMC arrays and supports third-party arrays. However, it does not coexist with Linux multipath, and therefore Linux multipath had to be disabled.
EMC PowerPath also offers a number of load-balancing algorithms, including the well-known round-robin algorithm. However, with the EMC Symmetrix optimal policy that is available for EMC arrays, I/O requests are routed to paths that take into account path load and logical device priority. Thus, EMC PowerPath automatically adjusts data routing in real time for optimal performance.
In the event of I/O path failures, EMC PowerPath automatically redirects I/O traffic to the surviving path without any disruption of the application. It detects when the failed path comes back online and recovers automatically.
Oracle ASM RPMs were installed to manage Oracle ASM LUNs. Oracle ASMLib is an Oracle support library that operates between the storage and Oracle ASM. It provides a means for labeling, accessing, and managing disk drives from the operating system. It is similar to the multipath_bindings file in Linux multipath but stores information on the disks. However, Oracle ASM can function without Oracle ASMLIB and also can access the EMC PowerPath pseudo device directly.
Here are the steps for installing Oracle ASMLIB:
1. Install RPMs.
oracleasm-2.6.18-238.9.1.el5-2.0.5-1.el5.x86_64
oracleasm-support-2.1.5-3.el5.x86_64
oracleasmlib-2.0.4-1.el5.x86_64
2. Configure Oracle ASMLIB.
# /etc/init.d/oracleasm configure
Default user to own the driver interface [oracle]:
Default group to own the driver interface [dba]:
Start Oracle ASM library driver on boot (y/n) [y]:
Please note that the versions of RPM's used for Oracle ASM are specific to the Linux kernel version deployed. Same applies to kernel tuning parameters which were found optimal for C3 workload.
Cisco UCS and Computing Design
Table 11 lists the core components of the C3 design. Table 12 compares the HP Superdome and Cisco UCS B440 platforms.
Table 11. Core Technology Components of the Design
Operating System
Linux Kernel RHEL 5.5 2.6.18-238.9.1
Oracle ASM
Oracle ASMLIB 2.0.4
EMC PowerPath
Release 5.5
Computing nodes
Database: Cisco UCS B440 x 12 for database (12 active and 2 standby)
Concurrent managers: Cisco UCS B200
Forms and web: Cisco UCS B200 (virtual machines)
Fabric Interconnects
Cisco UCS 6140XP
Cisco UCS firmware version
Release 1.4
Fabric Extenders
Cisco UCS 2104XP
Blade server chassis
Cisco UCS 5108 Blade Server Chassis: 6 active and 1 standby
Number of blades per chassis
2 blades for database nodes (slots 5 and 7)
Table 12. Comparison of HP Superdome and Cisco UCS B440 Platforms
128 Gbps (EMC PowerPath automated balancing); 8 virtual host bus adapters (vHBAs) per node
Network throughput
Public network: 2 x 1 Gbps x 3
80 Gbps (8 paths to Cisco Nexus 7000 Series Switch)
Cluster interconnect
Network interconnect: Maximum throughput is 2 x 1 Gbps x 3
(5 Gbps-10 Gbps) per node x 12
CPU resiliency
CPU protection: Can be deconfigured in some scenarios; however, HP Superdome can go down in some situations
CPU failure will bring down server; significantly faster node-replacement process
Memory resiliency
MEM protection: Can be deconfigured in some scenarios; however, HP Superdome can go down in some situations
Error-correcting code (ECC) memory; significantly faster node-replacement process
Support
HP dedicated support on site; however, no spare HP Superdome capacity onsite, so greater impact of single-node failure
Cisco support, with spare capacity within Cisco UCS cluster, single-node failure has less impact
Figure 9 shows the main components of the Cisco UCS solution.
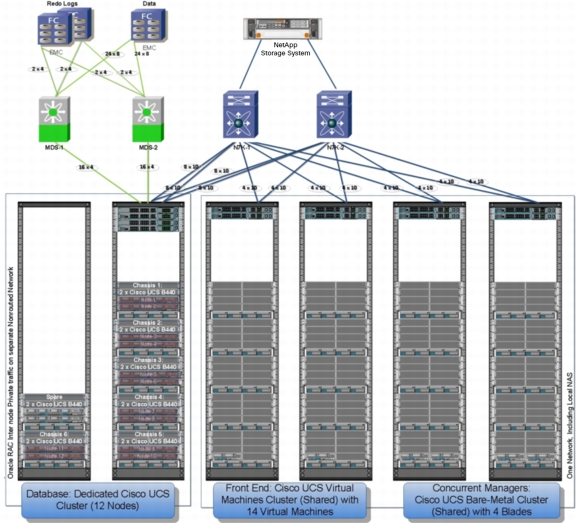
Figure 9. C3 Cisco UCS Solution Core Components
Figure 9 shows:
• Computing components
– Cisco UCS database cluster on dedicated Cisco UCS cluster
– Oracle concurrent managers on shared bare-metal Cisco UCS clusters
– Internal virtual machines on shared virtual Cisco UCS clusters
– (Virtual machines used for external connections not shown in the figure)
• Network components
– Cisco UCS Fabric Interconnects
– Cisco Nexus 7000 Series Switches (data center gateways)
• Storage components
– Block storage: Cisco MDS 9000 Family switches
– EMC Symmetrix VMAX frames: 3 total for C3 production
– File storage: Dual-head NetApp Storage System FAS3270
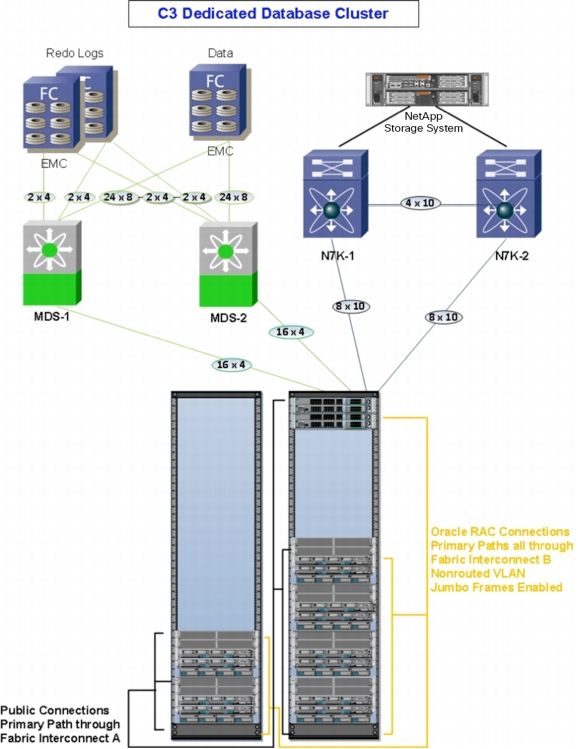
Figure 10 shows the Cisco UCS database node connectivity.
Figure 10. Cisco UCS Database Node Connectivity
For C3, a high I/O Cisco UCS database cluster design was selected, including:
• Two Cisco 6140XP Fabric Interconnects
• Six chassis (six active and one standby)
• Twelve Cisco UCS B440 M1 Blade Servers and two Cisco UCS B440 M1 Blade Servers on cold standby
Cisco UCS database cluster throughput at each Fabric Interconnect included:
• Fibre Channel (storage): 128 Gbps
• Ethernet (network): 160 Gbps
Fabric Interconnect oversubscription ratio (steady state):
• Fibre Channel: 128/12 = 10.66 Gbps per blade
• Ethernet: 160/12 = 13.33 Gbps per blade
Fabric Interconnect oversubscription ratio (single Fabric Interconnect failure):
• Fibre Channel: 64/12 = 5.33 Gbps per blade
• Ethernet: 80/12 = 6.66 Gbps per blade
Throughput in the event of Fabric Interconnect failure at remaining Fabric Interconnect:
• Fibre Channel throughput: 50 percent
• IP throughput: Northbound identical to steady state
• IP throughput: Southbound, Oracle RAC, and public traffic combined
• Program has requested jumbo frames for Oracle RAC interconnect traffic
– Increases performance, especially if system is stressed
– Jumbo-frame new design
– Jumbo-frame policy: Enable only as needed (typically database and storage related)
Virtual Machines and Bare-Metal Clusters
Webservers and Oracle application server virtual machines are provisioned on multiple shared VMware ESX and Cisco UCS clusters (Table 13). The Oracle concurrent managers are set up only on multiple shared bare-metal Cisco UCS clusters (Table 14). All the virtual machines are set up in multiple shared Cisco UCS clusters. All the virtual servers reside in multiple functional pools. For each pool, a Cisco Application Control Engine (ACE) load balancer distributes traffic among the multiple servers and also provides the needed resiliency in the event of a virtual server failure or other type of Cisco UCS software or hardware failure.
Table 13. Oracle Applications Front-End Web and Forms Servers
Oracle Applications front-end web and forms servers
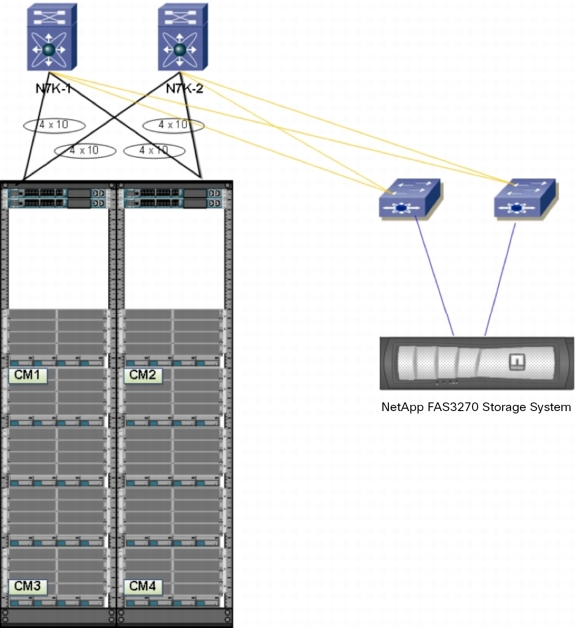
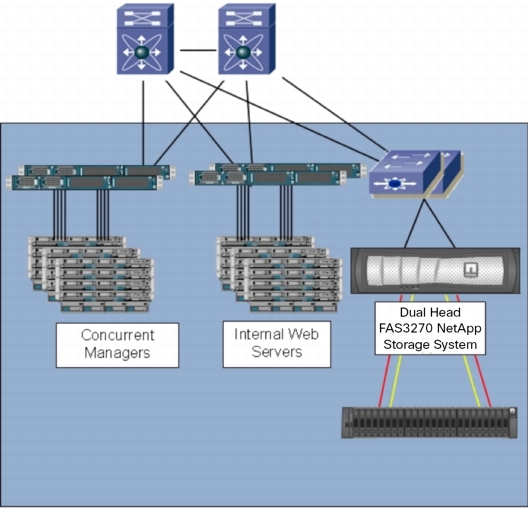
The four Oracle concurrent managers were set up on two Cisco UCS clusters (Figure 11).
Figure 11. Deployment of Oracle Concurrent Managers
Virtual NIC and Virtual HBA Configuration
Virtual NICs (vNICs) and virtual HBAs (vHBAs) were configured. Table 15 summarizes the production data frame.
Table 15. Production Data Frame
Production Data Frame xxxx (Each Set of 8 Front-End Adapters)
48 Front-end adapters
Front-end adapter set 1
Front-end adapter set 2
Front-end adapter set 3
Front-end adapter set 4
Front-end adapter set 5
Front-end adapter set 6
Chassis 1
Node 1
Node 2
Chassis 2
Node 3
Node 4
Chassis 3
Node 5
Node 6
Chassis 4
Node 7
Node 8
Chassis 5
Node 9
Node 10
Chassis 6
Node 11
Node 12
8 front-end adapters
8 front-end adapters
8 front-end adapters
8 front-end adapters
8 front-end adapters
8 front-end adapters
The C3 database was configured with a dedicated storage frame connected through 48 front-end adapter ports, with every seventh node sharing the same set of front-end adapter ports. Also, storage is configured with two groups of four HBA all-active paths on which:
• Odd-numbered LUNs use vHBA paths 1, 4, 5, and 8
• Even-numbered LUNs use vHBA paths 2, 3, 6, and 7
This approach helps ensure that each group of four paths is distributed evenly across SAN fabrics A and B and also distributed evenly across all four 10 Gigabit Ethernet FCoE ports on both Palo adapters (per Cisco UCS B440 blade) as shown in Table 16.
Table 16. vHBA Mapping and UCS Storage Allocation
Palo Adapter
Port
Fabric
vHBA Number
1
1
A
vHBA1
B
vHBA2
2
A
vHBA3
B
vHBA4
2
1
A
vHBA5
B
vHBA6
2
A
vHBA7
B
vHBA8
Cisco UCS Storage Allocation
LUNs (Sorted on Symdev)
vHBA Grouping (4x Multipaths per Set)
LUN-1
LUN-3
LUN-5
LUN-7
...
LUN-(n-1)
vHBA1
vHBA4
vHBA5
vHBA8
LUN-2
LUN-4
LUN-6
LUN-8
...
LUN-(n)
vHBA2
vHBA3
vHBA6
vHBA7
Multipath Set 1 (A-B-A-B)
Multipath Set 2 (B-A-B-A)
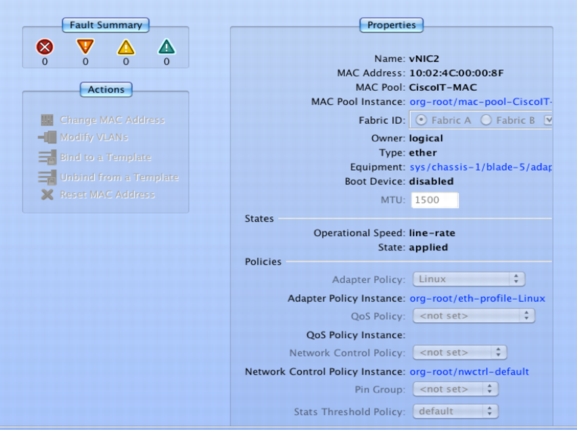
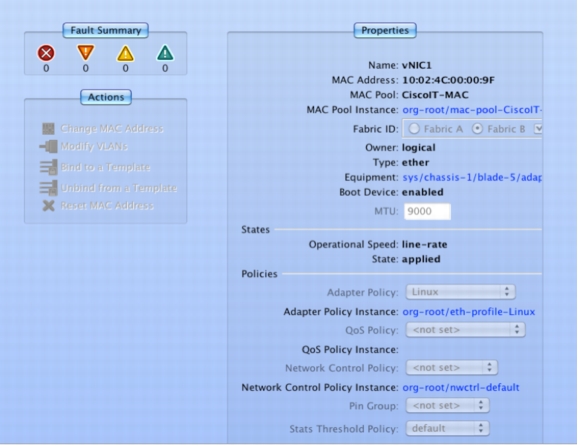
Similarly, two vNICs were configured per host, as shown in Table 17:
• vNIC 1 for the public network (client facing) with a default maximum transmission unit (MTU) of 1500 on Adapter 1 (Fabric A primary; failover to fabric B)
• vNIC 2 for the private network (Oracle interconnect) with an MTU the size of 9000 jumbo frames on Adapter 2 (Fabric B primary; failover to fabric A)
All nodes of the Oracle RAC cluster are configured to use Fabric B for the private interconnect, so all the interconnect traffic stays within the same fabric and has to flow out through network gateways across both fabrics only in the event of a chassis or IOM B-side failure.
Table 17. Cisco UCS B440 Blade Server with Dual Palo Adapters
Blade
Adaptor
Physical Port
Fibre Channel
Fibre Channel Fabric
Ethernet
Ethernet Fabric
Cisco UCS B440
1
1
vHBA1
A
vETH1
A -> B
vHBA2
B
none
-
2
vHBA3
A
none
-
vHBA4
B
none
-
2
1
vHBA5
A
vETH2
B -> A
vHBA6
B
none
-
2
vHBA7
A
none
-
vHBA8
B
none
-
Cisco UCS Network Design
Cisco IT uses the following conventions for Oracle RAC:
• An Oracle RAC subnet is dedicated to an Oracle RAC cluster. The RFC 1918 IP address space should be used from outside address block 10.0.0.0/12.
• The Oracle RAC subnet is not routable.
• Oracle 11g requires the use of multicast because of the use of one-to-many replications, status updates, and database updates. Therefore, local multicast traffic must be enabled for the Oracle RAC subnet. Address block 239.255.7.0/24 has been allocated for Oracle RAC. This address block can be reused because each Oracle RAC cluster is in a different subnet.
• The servers that send multicast traffic should be set up to send with a time-to-live (TTL) value of 1.
Overall Public and Private Node Setup
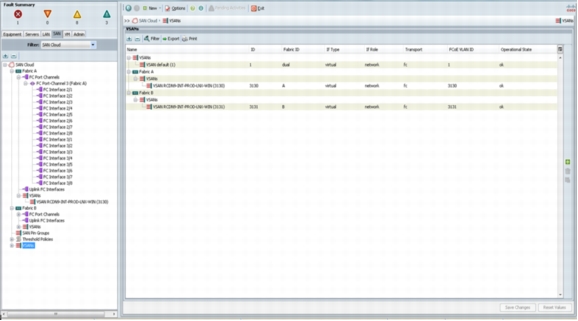
Figure 12 shows two of the six active chassis in the overall public and private node setup.
Figure 12. Two of the Six Active Chassis
On Cisco UCS northbound IP connections, each Cisco 6140XP Fabric Interconnect has two Port Channels consisting of four 10 Gigabit Ethernet links uplinked to the data center gateways totaling 160 Gbps of IP bandwidth from the Cisco UCS Fabric Interconnects to the Cisco Nexus gateways.
The networking setup is as follows:
Rack setup 1
Nonrouted VLAN
Nexus 7000 GW1:
interface Vlan729
no shutdown
name node1-node14rac:10.x.x.x/27
no ip redirects
ip address 10.x.x.a/27
ip arp timeout 1740
hsrp 1
preempt delay minimum 600
priority 105
forwarding-threshold lower 0 upper 0
ip 10.x.x.1
Public interface setup
interface Vlan385
no shutdown
no ip redirects
ip address a.a.a.a/25
ip arp timeout 1740
(routing protocol eigrp configuration show)
ip router eigrp 109
ip passive-interface
eigrp 109
hsrp 1
preempt priority 105
forwarding-threshold lower 0 upper 0
ip a.a.a.1
Rack setup 2
Nonrouted VLAN
Nexus 7000 GW2:
interface Vlan729
no shutdown
name node1-node14rac:10.x.x.x/27
no ip redirects
ip address 10.x.x.b/27
ip arp timeout 1740
hsrp 1
priority 100
preempt delay minimum 600
forwarding-threshold lower 0 upper 0
ip 10.x.x.1
Public-interface setup
interface Vlan385
no shutdown
no ip redirects
ip address a.a.a.b/25
ip arp timeout 1740
(routing protocol eigrp configuration show)
ip router eigrp 109
ip passive-interface
eigrp 109
hsrp 1
preempt priority 100
forwarding-threshold lower 0 upper 0
ip a.a.a.1
Two Cisco UCS 6140XP Fabric Interconnects were used in the high-I/O design. In the high-I/O design, a 160-Gbps uplink from the Cisco UCS cluster to the IP network was provided, and C3 needed a 128-Gbps connection to the storage network.
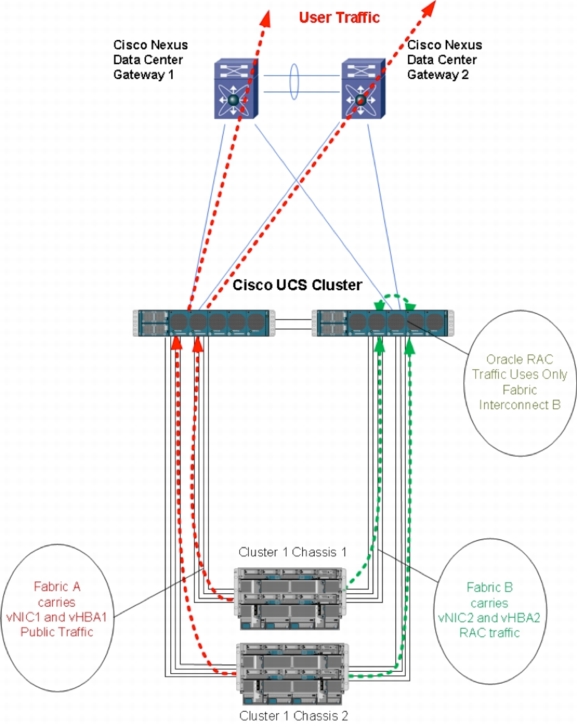
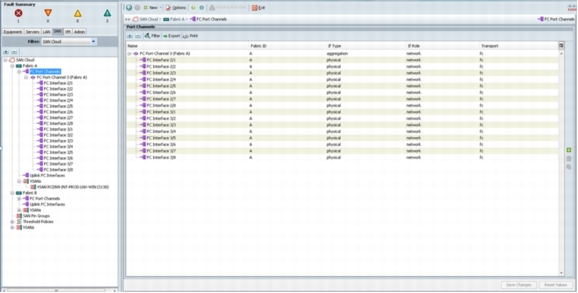
At the blade level, two vNICs were created; the public vNIC was pinned to Cisco UCS Fabric Interconnect A with failover enabled (Figure 13), and the private vNIC was pinned to Cisco UCS Fabric Interconnect B with failover enabled (Figure 14).
Figure 13. Public Network
Figure 14. Private Network
On Oracle RAC, private interconnect traffic does not travel northbound from Cisco UCS Fabric Interconnect B. This behavior provides two advantages:
• It results in very low latency for Oracle RAC traffic, in microseconds, because the Cisco UCS 6140 Fabric Interconnects are part of the Cisco Nexus 5000 Series.
• Oracle RAC traffic can be kept at the access-switch level, far away from the core of the network.
Only in the event of a Cisco UCS failure (for example, an IOM failure) could Oracle RAC traffic reach the data center gateways. This behavior was considered acceptable for a failure state.
Note: Because of the pinning setup, Cisco effectively has only 50 percent of the available Cisco UCS northbound (public) bandwidth. Although 160 Gbps is physically available, only 80 Gbps is effectively used in the Cisco setup for public traffic. However, the 80 Gbps is guaranteed during any kind of failure.
Multicasting for Cisco UCS Traffic
Because the traffic that needs to be multicast stays local to the Oracle RAC subnet, no special setup is required on the Cisco Nexus 7000 Series or Cisco UCS components.
vlan 729 (this is the Layer 2 interface)
ip igmp snooping querier 10.xxx.xxx.xxx
no ip igmp snooping link-local-groups-suppression
Jumbo Frames Setup
To increase performance for Oracle RAC communication, jumbo frames were enabled on the Oracle RAC interfaces. To help ensure optimal performance during steady-state and failure situations, jumbo frames need to be enabled on all of the following:
• Oracle RAC Linux OS RAC interface level
• Cisco UCS vNICs that have been set up for Oracle RAC connections
• Cisco Nexus 7000 Series interfaces connecting to the C3 Cisco UCS database cluster
The configuration for the Cisco Nexus 7000 Series Switch is as follows:
(global command, enabled by default)
system jumbomtu 9216
(configured on the Layer 2 PortChannels to the Cisco UCS cluster, plus Layer 2 crossover
link between GW1 and GW2)
interface port-channel xx
mtu 9216
Jumbo frames have to be enabled in Cisco UCS at the vNIC level for Oracle RAC interconnect. Please see the Cisco screen image in Figure 14 on how to setup Jumbo frames in Cisco UCS Manager.
Jumbo frames were not enabled on the public-network interfaces of the Oracle database cluster.
Cisco UCS Storage Design
C3 Storage Infrastructure
• Dedicated EMC storage frame
– Eight-engine EMC Symmetrix VMAX frame 0553
– 960 x 450-GB 15,000-RPM Fibre Channel drives
– EMC Symmetrix VMAX Enginuity Version 5875
– Array front-end adapters balanced across 12 database nodes
– Two single-engine EMC Symmetrix VMAX frames for redo log 1161/1166
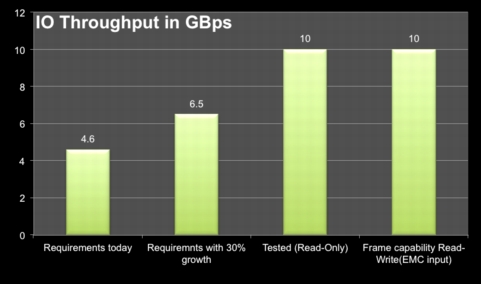
• Cisco Richardson Data Center SAN infrastructure upgraded to meet C3 load
– Fabric bandwidth increased
– Extensive load tests performed for validation
– Read I/O tested to maximum 10 GBps
• Dedicated NetApp array for C3 disaster recovery and nonproduction instances
– Oracle ASM disk groups round-robined across multiple high-availability NetApp clusters for improved performance and scalability
– NetApp FlexClone for database refreshes was used and deduplication requirement was reduced
NAS Components
The front-end Oracle Applications forms, web, and concurrent manager tiers have a dedicated dual-head Netapp NAS filer.
Figure 15 shows the NAS setup in the network. The NetApp storage systems reside in the same subnet as the Oracle concurrent managers and the internal Oracle Applications servers (web servers). Table 18 provides information about the NetApp storage systems.
Figure 15. NAS Setup
Table 18. Table 18. NAS Information for NetApp FAS3270AE with Two NetApp DS2246 (Forty-Eight 600-GB SAS)
Disk Type
RAID Group Size
Aggregate Size
600 GB (SAS)
21 + 2
~9 TB
SAN Components
EMC Symmetrix VMAX Overview
EMC Symmetrix VMAX specifications and configuration are summarized here and in Table 19.
All four arrays listed in Table 19 use EMC Symmetrix VMX Enginuity microcode 5875.198.148 and are configured for virtual provisioning. Server-to-array SAN connectivity employs a dual fabric edge-core-edge model using Cisco MDS 9513 Multilayer Directors running Cisco NX-OS Software Release 4.2.7e.
SRDF is used to copy production release-1 data and redo LUNs to bunker array (0416) release-2 backup LUNs. SRDF remote data facility groups (RDFGs) represent the intra-array configuration, allowing frame-to-frame LUN-level replication. Use of the SRDF backup strategy helps shift back-end array activity encountered during backups from the production array to the bunker array.
Table 20 shows the EMC Symmetrix VMAX engine director layout, and Table 21 shows the distribution of C3 database node front-end adapter ports.
Table 20. EMC Symmetrix VMAX Engine Director Layout
Engine
Director
Buildout
1
01/02
7
2
03/04
5
3
05/06
3
4
07/08
1
5
09/10
2
6
11/12
4
7
13/14
6
8
15/16
8
Table 21. C3 Database Node Front-End Adapter Port Distribution (EMC Symmetrix VMAX 0553)
Host Name
Front-End Adapter Group 1
Front-End Adapter Group 2
Node 1/7
01E:1
16E:1
01F:1
16F:1
03E:1
14E:1
01G:1
16G:1
Node 2/8
03F:1
14F:1
03G:1
14G:1
05E:1
12E:1
05G:1
12G:1
Node 3/9
07E:1
10E:1
07G:1
10G:1
08E:1
09E:1
08G:1
09G:1
Node 4/10
04E:1
13E:1
04F:1
13F:1
06E:1
11E:1
06G:1
11G:1
Node 5/11
02E:1
15E:1
04G:1
13G:1
02F:1
15F:1
02G:1
15G:1
Node 6/12
05F:1
06F:1
11F:1
12F:1
07F:1
08F:1
09F:1
10F:1
A total of 48 front-end adapter ports were distributed across the nodes. Each node had eight front-end adapter ports. Each front-end adapter port performed approximately 8000 IOPS. The front-end adapter ports were rotated; the first six nodes got the first unique set, and the second set of six nodes shared front-end adapters.
Table 22 shows the distribution of LUNs, and Table 23 shows sample LUN pathing for one node.
Table 22. LUN Distribution
Type
Array
Size
Use
Number of LUNs
RDF1+TDEV
553
272
Production data files
256
TDEV
2518
1
OCR and voting
3
TDEV
4316
1
OCR and voting
3
RDF1+TDEV
1161
8
Production redo
50
RDF1+TDEV
1166
8
Production redo
50
TDEV
553
68
Logical volume management (LVM)
5
Table 23. Sample LUN Pathing for One Node
Data
Serial Number
Device
Protection
MB
Paths
Front-End Adapter Ports
States
0553
15CB
RDF1+TDEV
278850
4
01E:1 01F:1 16E:1 16F:1
(RW RW RW RW)
0553
15D3
RDF1+TDEV
278850
4
01G:1 03E:1 14E:1 16G:1
(RW RW RW RW)
The remaining data LUNs on Node 1 are round-robined, using the path sets displayed in the Front-End Adapter Ports column (Table 24).
Table 24. Sample Related Array ACLX_DB Device Masking Definitions for Data LUN symdevs 15CB and 15D3 for Cisco UCS Node 1 on EMC Symmetrix VMAX 0553
Table 25 shows an example of LUN pathing for redo operations.
Table 25. Sample LUN Pathing for Redo
Redo
Serial Number
Device
Protection
MB
Paths
Front-End Adapter Ports
States
1161
02ED
RDF1+TDEV
8190
4
07E:0 07F:0 08E:0 08F:0
(RW RW RW RW)
1161
02F5
RDF1+TDEV
8190
4
07E:1 07G:0 08E:1 08G:0
(RW RW RW RW)
1166
032D
RDF1+TDEV
8190
4
07E:1 07F:0 08E:1 08F:0
(RW RW RW RW)
1166
335
RDF1+TDEV
8190
4
07F:1 07G:1 08F:1 08G:1
(RW RW RW RW)
The remaining redo LUNs on Node 1 are round-robined using the path sets displayed in the Front-End Adapter Ports column.
Table 26 shows an example of LUN pathing for backup operations.
Table 26. Sample LUN Pathing for Backup
Backup
Serial Number
Device
Protection
MB
Paths
Front-End Adapter Ports
States
0416
1BFD
RDF2+TDEV
278850
2
04F:1 13F:1
(WD WD)
0416
1C05
RDF2+TDEV
278850
2
05F:1 12F:1
(WD WD)
Backup LUNs are round-robined on path sets 01F:1/16F:1, 02E:0/15E:0, 03F:0/14F:0, 04F:1/13F:1, 05F:1/12F:1, 06F:0/11F:0, 07F:1/10F:1, and 08E:0/09E:0.
Note: Status is write deferred (WD).
Odd-numbered front-end adapter ports are on Fabric 1, and even-numbered front-end adapter ports are on Fabric 2.
Storage Pools
Tables 27 through 29 summarize storage pool layouts.
Note: Note: Pool types are SN = Snap, RS = Rdfa DSE, and TH = Thin.
Table 27. Layout of Thin Pools on Data Frame
Pool Name
Type
Device Emulation
Device Configuration
Total GB
Enabled GB
Used GB
Free GB
Full (%)
State
DEFAULT_POOL
SN
FBA
RAID-5 (3 + 1)
12,132
12,132
0
12,132
0
Enabled
FC_POOL
TH
FBA
2-way mirroring
129,841
129,841
115,093
14,745
88
Enabled
BCV_POOL
TH
FBA
RAID-5 (3 + 1)
57,413
57,413
56,643
770
98
Enabled
ARCH_POOL
TH
FBA
RAID-5 (3 + 1)
13,872
13,872
13,071
800
94
Enabled
Total GB
213,258
213,258
184,807
28,448
86
Table 28. Layout of Thin Pools on Redo Frame
Pool Name
Type
Device Emulation
Device Configuration
Total GB
Enabled GB
Used GB
Free GB
Full (%)
State
DEFAULT_POOL
SN
FBA
0
0
0
0
0
Disabled
FC_POOL
TH
FBA
2-way mirroring
22,096
22,096
1,734.8
20,361
7
Enabled
Total GB
22,096
22,096
1,734.8
20,361
7
Table 29. Layout of Thin Pools on Backup Frame
Pool Name
Type
Device Emulation
Device Configuration
Total GB
Enabled GB
Used GB
Free GB
Full (%)
State
DEFAULT_POOL
SN
FBA
RAID-5 (3 + 1)
18,836
18,836
4,020
14,817
21
Enabled
FC_POOL
TH
FBA
RAID-5 (3 + 1)
322,226
322,226
236,169
86.059
73
Enabled
OCM_POOL
SN
FBA
RAID-5 (3 + 1)
6,940
6,940
5,030
1,910
72
Enabled
REFRESH_POOL
SN
FBA
RAID-5 (3 + 1)
4,957
4,957
0
4,957
0
Enabled
C3_POOL
SN
FBA
RAID-5 (3 + 1)
19,827
19,827
2,977
16,850
15
Enabled
Total GB
372,786
372,86
248,196
124,592
66
Zoning
Production C3 nodes 1 to 12 were implemented using Cisco UCS B440 blade servers and Cisco Palo CNAs. There is a direct correlation between the Palo CNA vHBA number seen on the host and the physical adapter and port on the Cisco UCS B440 blade server.
The Cisco UCS design dictates that each port on the Palo adapter is attached to each Fabric Interconnect. The Cisco UCS B440, as a full-width blade server, has two CNAs by default.
Eight vHBAs were configured on each host. Hence, each 10-Gbps port (for a total of four ports per blade) on each adapter has two vHBAs of 4 Gbps each:
To help ensure redundancy, the four paths to each LUN were set up to use specific vHBA sets. LUNs were round-robined as follows:
• LUNs using vHBA Set 1 (vHBA 1, 4, 5, and 8) and Front-End Adapter Path Set 1 (01E:1/16E:1/01F:1/16F:1)
• LUNs using vHBA Set 2 (vHBA 2, 3, 6, and 7) and Front-End Adapter Path Set 2 (03E:1/14E:1/01G:1/16G:1)
This setup helps ensure that if an entire Cisco UCS B440 blade server adapter or port were to fail, no LUN would lose all of its paths.
Table 30 shows a zoning example for one Cisco UCS blade, and Table 31 shows zoning for vHBA Set 1 and 2.
Table 30. Zoning Example for One Cisco UCS Blade
Cisco UCS Adapter
Cisco UCS Ports
Number of vHBA
vHBA Worldwide Port Name (WWPN)
Fabric
VSAN
Path Set
Front-End Adapter
1
1
vHBA 1
20024c00000000cf
1
3130
1
01F:1
1
1
vHBA 2
20024c00000000af
2
3131
2
14E:1
1
2
vHBA 3
20024c000000008f
1
3130
2
01G:1
1
2
vHBA 4
20024c000000009f
2
3131
1
16E:1
2
1
vHBA 5
20024c00000000df
1
3130
1
01E:1
2
1
vHBA 6
20024c00000000ff
2
3131
2
16G:1
2
2
vHBA 7
20024c00000000ef
1
3130
2
03E:1
2
2
vHBA 8
20024c00000000bf
2
3131
1
16F:1
Table 31. Zones for vHBA Set 1 and 2
Zones for vHBA Set 1 (vHBA 1, 4, 5, and 8) = Front-End Adapter Path Set 1 (01E:1/16E:1/01F:1/16F:1)
zone name Z-UCS-LINUX-Node1_HBA0 vsan 3130
* fcid
0x5d00b4
[pwwn 20:02:4c:00:00:00:00:df]
[Node1_HBA0]
{UCS vHBA5, Fabric 1}
* fcid
0x5f0034
[pwwn 50:00:09:72:08:08:a5:01]
[VMAX0553-FA01EB]
zone name Z-UCS-LINUX-Node1_HBA1 vsan 3131
* fcid
0x5d00e6
[pwwn 20:02:4c:00:00:00:00:9f]
[Node1_HBA1]
{UCS vHBA4, Fabric 2}
* fcid
0x5f003e
[pwwn 50:00:09:72:08:08:a5:3d]
[VMAX0553-FA16EB]
zone name Z-UCS-LINUX-Node1_HBA2 vsan 3130
* fcid
0x5d00dd
[pwwn 20:02:4c:00:00:00:00:cf]
[Node1_HBA2]
{UCS vHBA1, Fabric 1}
* fcid
0x5f003f
[pwwn 50:00:09:72:08:08:a5:41]
[VMAX0553-FA01FB]
zone name Z-UCS-LINUX-Node1_HBA3 vsan 3131
* fcid
0x5d00e7
[pwwn 20:02:4c:00:00:00:00:bf]
[Node1_HBA3]
{UCS vHBA8, Fabric 2}
* fcid
0x5f0042
[pwwn 50:00:09:72:08:08:a5:7d]
[VMAX0553-FA16FB]
Zones for VHBA Set 2 (vHBA 2, 3, 6, and 7) = Front-End Adapter Path Set 2 (03E:1/14E:1/01G:1/16G:1)
zone name Z-UCS-LINUX-Node1_HBA6 vsan 3130
* fcid
0x5d00df
[pwwn 20:02:4c:00:00:00:00:ef]
[Node1_HBA6]
{UCS vHBA7, Fabric 1}
* fcid
0x5f0036
[pwwn 50:00:09:72:08:08:a5:09]
[VMAX0553-FA03EB]
zone name Z-UCS-LINUX-Node1_HBA7 vsan 3131
* fcid
0x5d00e5
[pwwn 20:02:4c:00:00:00:00:af]
[Node1_HBA7]
{UCS vHBA2, Fabric 2}
* fcid
0x5f003c
[pwwn 50:00:09:72:08:08:a5:35]
[VMAX0553-FA14EB]
zone name Z-UCS-LINUX-Node1_HBA4 vsan 3130
* fcid
0x5d00de
[pwwn 20:02:4c:00:00:00:00:8f]
[Node1_HBA4]
{UCS vHBA3, Fabric 1}
* fcid
0x5f0043
[pwwn 50:00:09:72:08:08:a5:81]
[VMAX0553-FA01GB]
zone name Z-UCS-LINUX-Node1_HBA5 vsan 3131
* fcid
0x5d00b4
[pwwn 20:02:4c:00:00:00:00:ff]
[Node1_HBA5]
{UCS vHBA6, Fabric 2}
* fcid
0x5f004a
[pwwn 50:00:09:72:08:08:a5:bd]
[VMAX0553-FA16GB]
The `*' indicates that it's an active zone in the zoneset.
Host SAN Connectivity Using N-Port Virtualization
Each of the 12 production Cisco UCS nodes has eight vHBAs implemented using Cisco Palo CNAs. Each Cisco UCS cluster sits behind a pair of Cisco 6140XP Fabric Interconnects. The Fabric Interconnects connect to the Cisco MDS 9513 Multilayer Director SAN fabric using N-port virtualization (NPV), which eliminates the need for the top-of-rack Cisco 6140XP Fabric Interconnects to be assigned individual domain IDs. This approach is desirable because domain IDs (minus reserved IDs) are limited to 239 in the fabric.
NPV virtualization allows multiple virtual N-port IDs to be assigned to a single N port.
Cisco's implementation of NPV supports two main features that make it desirable for implementing Cisco UCS clusters:
• F-port trunking allows multiple virtual servers implemented on a physical Cisco UCS server to belong to different VSANs and still share a common fabric uplink.
• An F-port PortChannel allows multiple N-port uplink ports to be bundled together into a single logical uplink port, facilitating load balancing and redundancy in the fabric.
If the link through which an NPV device originally logged into the fabric were to fail, the NPV device would not be forced to log back into the fabric as long as at least one surviving link remains in the channel. Any traffic that was in progress on the failing link must go through normal recovery mode, but the host will remain logged into the fabric.
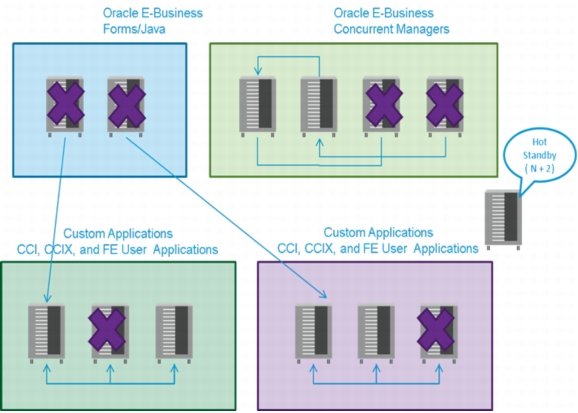
Oracle forms and web-tier database service nodes can failover to Java and Perl application database service nodes while the remedial action is taken. Four database nodes are allocated for concurrent managers. They have enough capacity and redundancy to failover among themselves. The custom Perl applications database service nodes are redundant as well, very similar to concurrent manager database nodes (Figure 18).
Figure 18. Oracle Database Node Failure and Recovery
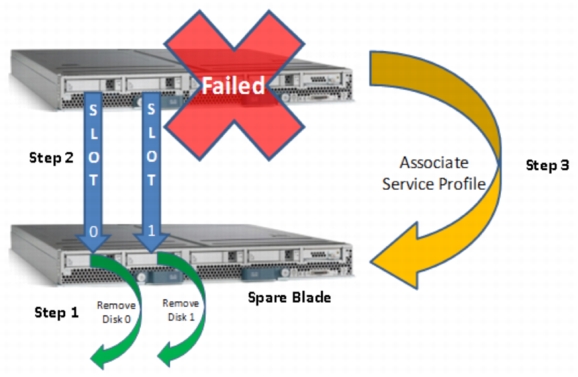
Cisco UCS Blade Failure and Recovery
To recover from Cisco UCS blade failure, follow these steps (Figure 19):
1. Disassociate the service profile.
2. Physically move the boot disks.
3. Associate the service profile.
4. Reboot.
5. Start and validate Oracle CRS and the database.
6. Relocate services as required.
Time to recover: approximately two hours.
Figure 19. Cisco UCS Blade Failure and Recovery
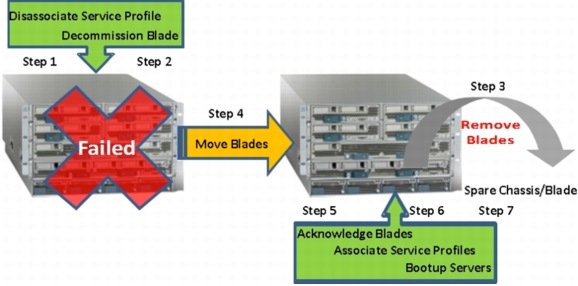
Cisco UCS Chassis Failure and Recovery
Follow these steps to recover a node if a chassis failure occurs in a real production environment (Figure 20):
1. Disassociate the service profiles of all the blades.
2. Decommission the blades.
3. Physically move the blade from the failed chassis to a new chassis (or reuse both spare blades as an interim operation).
4. Acknowledge the blades.
5. Associate the service profiles.
6. Boot the server.
7. Start Oracle CRS and the database.
8. Relocate services as required.
Time to recover: approximately two hours.
Figure 20. Cisco UCS Chassis Failure and Recovery
Cisco UCS Fabric Failure and Recovery
The following steps outline the process for recovering from a Cisco UCS fabric failure (Figure 21):
1. The Oracle RAC interconnect network VLAN 1 fails over transparently to Fabric A.
2. The system operates at 50 percent of its I/O capacity but with no business interruption.
3. Inform data center operations and Cisco UCS personnel that they need to fix the fabric failure.
4. Verify the storage SAN connections.
5. Verify the public and Oracle RAC interconnect connections.
Figure 21. Cisco UCS Fabric Failure and Recovery
Cisco UCS Fabric Extender and Partial Link Failure and Recovery
The following steps outline the process for recovering from a Cisco UCS Fabric Extender and partial link failure (Figure 22):
1. Business is not interrupted. The private network flows through the northbound switch.
2. Inform data center operations and Cisco UCS personnel that the link or IOM needs to be replaced.
3. Verify connectivity and traffic flow and resume work.
Figure 22. Cisco UCS Fabric Extender Failure and Recovery
Scalability and Performance Data
Oracle Real Application Testing
There was no easy way to validate the design with real-time workloads. Therefore, Cisco IT used Oracle Real Application Testing (RAT), which captures data from the production system and can play back this same data on a test system. This test helps collect near-real-time performance characteristics.
A separate test bed was set up for Oracle RAT. Production loads were captured during the peak periods and was played back on the test system. This process helped measure:
• CPU and memory characteristics during playback
• The behavior of Oracle RAC services during playback, including whether they failed over as expected and supported the load
• Any fine-tuning of SQL statements that will be required in the move from a 3-node Oracle RAC to a 12-node Oracle RAC setup
Methodology Used
Oracle RAT goals were to:
• Capture and replay the current C3 production load in the Cisco UCS environment
• Provide a fairly accurate and detailed database server performance comparison for the target Cisco UCS configuration
• Validate load distribution from the current 3-node deployment to the future 8- to 12-node deployment
Figure 23 shows a snapshot of the test.
Figure 23. Capture Snapshot and Playback
The Oracle RAT database replay function uses a number of user calls to indicate the capture and replay of statistics.
Complex PL/SQL introduces some discrepancies in the number of user calls:
• Total user calls captured (from Oracle Automatic Workload Repository [AWR]) was 88,490,051 from 87,640 sessions in a 2-hour period
• Replayable calls were 87,816,942 (missing 0.76 percent of calls)
Table 39 shows the data from Oracle RAT.
Table 39. Oracle RAT Data
Divergence Type
Iteration 1 (12 Nodes)
Iteration 2 (8 Nodes)
Iteration 3 (Two Times for 12 Nodes)
Count
% Total
Count
% Total
Count
% Total
Session failures during replay
54
0.00%
46
0.00%
49
0.00%
Errors no longer seen during replay
93,851
0.11%
93,711
0.11%
93,903
0.11%
New errors seen during replay
732,697
0.83%
739,512
0.84%
744,220
0.85%
Errors mutated during replay
2,052
0.00%
2,052
0.00%
2,052
0.00%
DML calls with different number of rows modified
177,054
0.21% of all calls
178,107
0.2% of all calls
177,103
0.2% of all calls
Select commands with different number of rows fetched
1,161,385
1.34% of all calls
1,167,848
1.33% of all calls
1,164,951
1.33% of all calls
User calls: Number of SQL calls (capture compared to replay) = 87,816,942
87,667,807
99.83%
87,468,891
99.60%
175,342,152
99.83%
Observations and Summary
• The average CPU use was 10 to 40 percent, depending on the test configuration.
– Cisco UCS CPUs are almost two times faster than Itanium CPUs.
• I/O rates were less than the production capture in some cases due to the following:
– The database buffer cache collected more than the production cache; more buffering probably lead to less I/O (production: 3 nodes x 12 GB = 36 GB; test: 12 nodes x 16 GB = 192 GB).
• The test did not have non database I/O (backups, archive log copy, compression, or disaster recovery redo shipping).
• Global cache traffic was similar to production traffic.
– No significant Oracle RAC global cache waiting was observed during online monitoring of the test.
Figure 24 shows the 12-node test, and Figure 25 shows the 8-node test.
Figure 24. 12-Node Test
Figure 25. 8-Node Test
A test using two times the load was also conducted to check the performance of the system. However, considering that caching occurred at every layer (identical SQL commands were used) from the buffer cache to the storage cache, Cisco adopted a more conservative approach than indicated by the values shown by Oracle RAT in the double-load test (Figure 26).
Figure 26. 12-Node Test with Twice the Workload
Jumbo Frames Testing
Table 40 summarizes the results of jumbo frames tests, and Table 41 summarizes the impact of reassembly on a single node.
Table 40. Jumbo Frames Tests and Results
Objective
Examine the performance improvement from an Oracle RAC private interconnect in a 12-node setup using jumbo frames (using IP traffic only, not Fibre Channel or storage-related traffic).
Benefits
The current HP environment led to reduced performance because jumbo frames were not enabled. The amount of C3 interconnect traffic is substantial. Based on Oracle recommendations, jumbo frames are expected to improve performance in interconnect traffic.
Test scope
Standard frame (eth1)
Understand performance improvement based on the use of jumbo frames for private networks.
Jumbo frame (eth1)
Establish a baseline in measuring network performance. Determine the benefits of using jumbo frames.
Jumbo frame (eth1) with jumbo frames enabled on the Cisco Nexus gateway
Enable hosts and network devices to support jumbo frames. Avoid fragmentation and performance degradation.
Results
Testing has shown that jumbo frames can enable a 30% performance gain with only a slight increase in CPU use.
Risks
Risk are low (because C3 Oracle RAC traffic is isolated). Risks are greater from configuration mistakes on interfaces other than Oracle RAC interfaces (for example, from erroneous enabling of jumbo frames on interfaces other than Oracle RAC interfaces).
Table 41. Impact on Reassembly Observed on a 40-Minute Test on a Single Node
Eth1 and Oracle RAC Interface
Segment Retransmitted
Total Reassemblies
Packet Receive Errors
MTU = 1500
27
15,625,257
0
MTU = 9000
45
592
0
The tests shown here were conducted by stressing the interconnect network to 400 MBps. The tests were then repeated on a 12-node cluster (Table 42).
Table 42. Jumbo Frame Test with 12 Nodes
Average per Node
12-Node Average
Test
MTU Size
%CPU Use
Net I/O KBps
Reassemblies
UDP Receive Errors
UDP Transmissions
Net I/O MBps
1
Host = 1500
1
Gateway = 1500
49
361331
226655768
0
88722924
4234
Gateway = 1500
Read IO Testing
A series of Oracle Orion tests (read-only tests) were conducted on the presented storage across all 12 nodes in the cluster to measure the end-to-end I/O capacity and throughput. Read-only tests were conducted across all of the LUNs and the nodes to identify the bottlenecks (Figure 27 and Table 43).
Figure 27. I/O Testing
Table 43. Observed Throughput Capacity Across the SAN Fabric
Storage Area
Available Throughput Today
C3 Go-Live Requirements (PEAK)
Storage Area
SAN fabric
160 Gbps
100 Gbps
(C3 58 Gbps + set database 22 Gbps + 20 Gbps other traffic)
126 Gbps
(C3 77 Gbps + set database 29 Gbps + 20 Gbps other traffic)
Post-Go-Live Cisco UCS Performance
This section shows the peak average CPU utilization across various nodes and service categories.
CPU, I/O, and Interconnect Metrics
Figures 28 through 32 show CPU, I/O, and interconnect metrics.
Figure 28. Peak Average Utilization Across All Nodes
Note: After the go-live date, the average CPU utilization was less than 40 percent across all nodes. The peak average for concurrent manager nodes was approximately 50 percent, and web, forms, and Perl applications were approximately 25 to 40 percent.
Figure 29. Oracle E-Business Suite (Database Nodes 2 and 4)
Figure 39. Service Delivery (Database Nodes 6, 9, and 11)
Figure 40. Service Sales (Database Nodes 8, 10, and 12)
Metrics for Concurrent Programs
Data for concurrent programs was collected over a period of one month, including the month end. Concurrent programs that ran less than 30 minutes improved by 15 percent (Figure 41). Long-running batch programs improved by almost 22 percent (Figure 42).
Figure 41. Concurrent Program Statistics 1: Cisco UCS Compared to HP
Figure 42. Concurrent Program Statistics 2: Cisco UCS Compared to HP
Concurrent Program Run-Time Details
Figures 43 through 45 show concurrent program run-time metrics.
Figure 43. Run-Time Snapshot of Concurrent Programs of Various Oracle E-Business Suite Modules
The faster CPU, increased total buffer cache across nodes, and performance fixes such as the tuning of custom SQL scripts identified during transition cycles, along with the implementation of Oracle RAC services and 12 node RAC setup on Cisco UCS, all seem to have helped increase the performance of online transactions and some of the batch concurrent programs.
Note that this data was collected just one month after the go-live date. Cisco has a few programs that still need to be tuned. Performance tuning is an ongoing exercise within Cisco IT and hopefully quarter and year-end data will reveal more details about performance benefits.
Migration from HP-UX Itanium to Cisco UCS x86 64-Bit Platform
This section discusses the platform migration attempted on the C3 system database. The source was HP-UX Itanium and the target was a Cisco UCS x86-based 64-bit Linux platform.
Many combinations of techniques are possible for platform migrations that may be unique to the database and hardware at the source and target. The case of only one database migration is presented here. This particular system was unique in its size for Cisco, and IT had to run several iterations to optimize the migration timings.
Readers of this section are strongly advised to use these instructions as a starting point instead of starting from the beginning without this guidance. The steps and optimization techniques outlined here may vary depending on the source and target database versions, downtime availability, Oracle application versions, metadata content compared to actual table data in the database, customizations performed on Oracle ERP systems, fragmentation in the database, hardware platforms, memory, CPU, I/O subsystem capacity, and other factors.
Hence, it is recommended to follow the steps after thoroughly understanding what was attempted and then tailor the guidelines presented here to suit a particular target environment for the optimal approach to migrate from HP to Cisco UCS
The requirements and scope of the migration included but not limited to the following.
• Minimal downtime
• Data consistency
• Fallback strategy in case of failure
• Capability to extend solutions across data centers
• Operability for Oracle ERP and for databases other than Oracle ERP
• Flexibility to consider different database versions between source and target
• Capability to work with the same or different endian platforms
Table 44 summarizes the migration techniques used in the Cisco implementation.
Table 44. Platform Migration Techniques
Migration Activity
Benefits
Negatives
1
Export and import
Suitable across platforms and versions
Single threaded and slow
2
Oracle Data Pump
• Multithreaded
• Suitable for medium-size databases
• Oracle 10g and later, but still slower over TTS and XTTS
• Limitation on XML and spatial data types
3
Transportable tablespace (TTS) database
• Faster and suitable for large databases
• Across database, cross-platform, but limited to same endianness
• Oracle 10g and later
• Application dependent: same character set, RDBMS version, and endianness
4
Cross-platform transportable tablespace (XTTS)
• Faster and suitable for large databases
• Tablespace level is cross-platform across endianness
• Oracle 10g and later
• Oracle certification dependent on Oracle application version; see metalink note 454574.1 about XTTS for applications
The TTS feature provides a faster means of bulk transferring data across different platforms and operating systems. Although the TTS database feature could have provided an easier approach for moving data, it is not supported across platforms with different endianness. However, Oracle Data Pump is much slower and includes several manual workarounds for the application.
Considering these factors, Cisco chose to use the XTTS option. Cisco observed by performing some tests on smaller databases of 4 to 5 TB that it is almost impossible to convert a 40 TB database to small endian from big endian with acceptable downtime with any of the other methods outlined here.
Use of the XTTS option involves the high-level steps shown in Figure 46 as described in the metalink note listed in Table 44.
Figure 46. Use of XTTS Feature for Bulk Transfer of Data
Several iterations of conversions were attempted to parallelize all of these operations to arrive at an optimal configuration and plan of records to reduce downtime while maintaining data consistency. The iterations were conducted with the following challenges in mind:
• How should the database be moved from the Cisco data center in San Jose to the Cisco data center in Texas online?
• Where should the Oracle Recovery Manager (RMAN) conversions be performed: on the source HP-UX platform or the target Cisco UCS platform?
• How should the copying of the data files to the target be parallelized? What is the weakest link: the source HP platform, target Cisco UCS platform, or storage platform?
• Can the source files be mounted on the target and a conversion attempted?
• How to parallelize Oracle RMAN taking advantage of the multiple nodes and what parameters need to be fine-tuned to achieve the downtime goal?
• Can the endian conversion and writing to Oracle ASM be performed simultaneously to save time?
• With 12 nodes in the database tier alone and multiple nodes in the middle tiers, can the autoconfig operation be parallelized?
• What reality checks can be performed on the database before it is released?
• How many storage copies, source nodes, and other hardware resources are needed, to reduce downtime?
Only the final optimized method is presented here. Answers to some of the preceding questions are included here:
• Cisco used EMC recover point solution to transfer the data files from San Jose data center on the HP-UX platform to the Texas data center on Itanium. This activity started almost a week before the go-live date to make sure that the files were synchronized, because of the size of the database. The final synchronization was performed after shutting down the database during planned downtime. Within almost one hour synchronization process was complete and the platform was ready for conversion.
• Oracle RMAN conversion can be performed on either the source or the target. Oracle RMAN just needs the source files and the target database files to be available on the same machine to perform the endian conversion. Oracle RMAN cannot perform the endian conversion while reading a file from a remote machine through SQL*Net. This restriction is a limitation of the current version of Oracle RMAN, which was used. Several options are available to address these limitations and challenges:
– Have a temporary staging area on the HP-UX source. Convert the data files to the staging area and push the files to Oracle ASM on Cisco UCS. Cisco was limited by the number of cores on the HP platform, and this model did not scale well. In addition, the files also needed to be pushed to Oracle ASM, and any parallel threads were limited by HBAs on the HP Superdomes.
– Mount the source files using the Network File System (NFS) protocol for Linux. Attempt Oracle RMAN conversion by directly reading the files from the NFS source area, performing the conversion, and pushing the files to Oracle ASM simultaneously in a single process. Although this option could be reasonable for smaller databases, it did not scale well for C3 database. The maximum throughput because of NFS client limitations was observed to be only around 400 to 500 MBps. The use of raw devices on the source target also posed limitations in mounting them as NFS and required that they first be copied.
– Copy the source files first to the Linux staging area. These then become the source for Oracle RMAN. Oracle RMAN will read the files and then convert and push the files to Oracle ASM. This option turned out to be promising. However, while parallelizing the work, Cisco observed that write I/O (copying from HP) and read I/O (Oracle RMAN conversion) in the staging area were contending.
On the basis of observations and experience, Cisco chose the final option. To circumvent the limitation of contending read and write operations, two separate mounts were created from two different frames. The data files were split manually, and while the second set was copied from the source, the first set was converted and pushed to Oracle ASM. This process resulted in an overall speed of approximately 4 GB per hour, thus reducing the overall copy and migration time to approximately 9 to 10 hours.
These processes are shown in Figure 47.
Figure 47. Database Platform Migration from HP Itanium to Cisco UCS Linux x86-64
Two storage frames for interim staging were chosen, each with a 20TB capacity (half the size needed on each). Both the storage frames were mounted on Cisco UCS servers along with Oracle ASM storage. Copying for the first set was initiated along with a metadata export process. Conversion of the first set was initiated after the copy operation was completed on frame 1. The second copy operation was initiated simultaneously on frame 2 while Oracle RMAN conversion happened on frame 1. This approach prevented the read-write contention (write operations from the dd command and read operations from Oracle RMAN). The import of metadata was initiated after the copy operation was completed.
Table 45 summarizes the timelines optimized for the 40 TB Oracle E-Business Suite database.
Table 45. Timelines Observed During C3 Go-Live
Activity
Time Taken in Hours
Comments
EMC recovery point synchronization from San Jose to Texas data center and validation of database
0.5
Database backup before migration and verification on HP server
1
Premigration activities such as resynchronization of domain indexes, purge of Oracle's OKC tables, and generation and preparation of XTTS scripts
1.5
Copying of data files to Cisco UCS
8
Oracle RMAN conversion
1
This is the spillover time from the preceding step, because copying and conversion were run simultaneously.
Import of metadata
5
Database auditing
2
Autoconfig on all 12 database nodes and 11 Front end nodes
13
Parallel autoconfig could not be run because of patch-set-level limitations. It wasn't on critical path as few of the activities continued.
Total time taken
32
Table 46 lists problem (bug) fixes applied on the source Oracle 10.2.0.5 and target Oracle 11.2.0.2.
Table 46. Bug Fixes Applied on Source Oracle 10.2.0.5 and Target Oracle 11.2.0.2
Bug Number
Details
1
4872830
XTTS patch for Oracle E-Business Suite
2
12790773
expdp bug for XTTS
3
13827123
impdp bug for XTTS
4
13888380
Post Go-Live patch applied on memory leak
You may have to check with Oracle as some of these might have been included in the latest patch sets.
Several steps were followed in the migration process, summarized in Tables 47 and 48. The master note is metalink document 454574.1.
Table 47. Endian Conversion Using Oracle RMAN
Before cutover
1
Apply patch 4872830 (password protected in metalink) and apply the patch on the appropriate nodes.
2
Apply patch 12790773 (expdp bug for XTTS).
3
Apply patch 13827123 (XTTS metadata import bug).
4
Initiate a recovery point and set up synchronization between San Jose and Texas data centers.
Cutover
1
Shut down all middle tiers and database listeners.
2
Identify concurrent programs in the pending status and hold.
3
Change job_queue_processes and aq_tm_processes to 0, and disable all cron jobs and black out in Oracle Enterprise Manager.
4
Perform final synchronization from San Jose HP server to remote-site HP server and open the database.
After cutover
1
Apply patch on 12790773 on Disaster Recovery (DR) sites Oracle home.
2
Run script to make sure you have sufficient free space in tablespaces.
3
Increase program global area (PGA) on DR site to a minimum of 2 GB.
4
Resynchronize domain indexes.
5
Rebuild FND_LOBS indexes.
Table 48. Transporting Tablespaces to Cisco UCS
Prepare interim database
1
Apply fixes discovered in earlier iterations such as any missing grants, tablespaces running out of space, defaults, and temporary tablespaces.
2
Create transport_set_violations on the source: exec dbms_tts.transport_set_check ('<tablespace name>')
3
Run auxttspre.sql (from the XTTS patch) to create several scripts to be used later. Apply the fixes in the log file generated for ctxsys, etc.
4
In the case of any custom tablespaces, reported violations that need to be fixed before proceeding.
5
Revalidate with auxttspre.sql and tablespace_tts_check and check for any violations.
6
Remove the rebuild index parameter for spatial indexes.
Prepare to export metadata
1
In the export script created by the XTTS patch, alter the following:
Shut down application processes if any are running.
3
Purge the recycle bin.
4
Grant the exempt access policy to the system (Oracle E-Business Suite has fine-grained policies for the tables).
5
Mark the tablespaces with the transportable set as read only: auxttsread.
Prepare to copy and convert
1
Run precreated scripts that will split the database files into multiple batches based on the optimization approach (copy on one frame and convert from the other) and generate the necessary dd scripts. A block size of 1 MB was found optimal in the testing process while using dd.
2
Get the dd scripts (to copy from HP to Linux). Have the Oracle RMAN conversion scripts and export scripts ready.
Run export
1
Export the transportable tablespace set on the source.
2
Export system tablespace schemas on the source.
3
Export global temporary tables on the source.
4
Revoke the exempt policy from the system.
Shut down database
Run DD and Oracle RMAN conversion
1
Run the dd command to copy the files from the source on HP Itanium to the target on the x86 64-bit platform. After several rounds of iteration, the following values were found optimal for Cisco IT architecture:
There were two HP nodes, each with 32 cores. The optimal number of threads for copying was found to be approximately 64.
Run the basic Oracle RMAN convert command for each data file. Four out of 12 nodes were used for endian conversion, and parallelism of 16 was used on each server.
CONVERT DATAFILE '<file 1 >', '<file 2 >', . . upto 4 TB of files (one batch) FROM PLATFORM 'HP-UX IA (64-bit)' FORMAT '+<DG1>/oradata/%N_%f.dbf' parallelism=16; 12:55 PM
Create target database
1
The target database is usually created before downtime by running aucrdb, which was created when auxttspre was run.
2
Run database preparation scripts and set up sys and system schemas. Install JVM and other required components as mentioned in the metalink note.
Import using DP
1
Modify the import parameter auimpxtts.
2
Bring down the listener on Cisco UCS.
3
Import the transportable tablespace set.
4
Change tablespaces to read-write mode.
5
Import global temporary tables.
6
Import procedural objects.
7
Import system tablespace schemas.
8
Implement any custom schema details that were discovered in earlier runs.
9
Startup listeners and databases.
10
Initiate backup.
Perform post-XTTS operations
1
Configure all the Oracle RAC services identified using srvctl or dbms_service.
2
Run autoconfig on all the database and middle-tier nodes.
3
Perform single sign-on (SSO) and identity management (IDM) registration.
4
Perform auditing. Prewritten scripts were run for the validation. These scripts compare the source and target over a database link and report any differences.
• Check object counts.
• Check object statistics.
• Check for any missing objects such as tables, indexes, constraints, jobs, queues, types, quotas, triggers, and sequences and take corrective action.
Compare the database administrator (DBA) directories along with permissions.
Prerelease Checklist
Prepare a checklist of activities such as the following prior to release of the system:
• Start web, form, and concurrent manager servers.
• Register the database and instances in Oracle CRS.
• Verify that the degree of parallelism for tables and indexes is same as in the source database and has not changed because of the migration activity.
• Register the targets if they are not in the Oracle Enterprise Manager grid control.
• Push the TNS entries of the servers globally (through Lightweight Directory Access Protocol [LDAP] if it is available) so that new addresses are available to all the clients.
• Make sure that the APPS and SYSADMIN passwords are changed through FNDCPASS.
• Enable Sarbanes-Oxley compliance setup steps, if any.
Return on Investment
Tables 49 through 51 provide information about the return on investment (ROI) offered by the C3 Cisco UCS solution for Oracle E-Business Suite.
Table 49. Total Power Consumption, Floor Space, and Other Metrics
C3 Configuration on HP Superdomes
Production
Configuration
kW
Tile
Total Storage, Network, and Consoles
Database production
3 HP Superdome SD64 Servers, each with 128 cores and 512 GB of memory
114*
11
120 total:
• 24 x 3 SAN
• 8 x 3 network
• 2 x 3 console
• 4 x 3 SCSI,
• 2 x 3 SD64 interconnect
Database (CSS and RU) production
1 HP Superdome SD32 Server with 28 cores and 128 GB of memory
19
1.5
30 total:
• 16 SAN
• 8 network
• 2 console
• 4 SCSI
Backup
2 HP Integrity RX3600 Servers
4
0.5
20 total:
• 12 SAN
• 4 network
• 4 console
Front-end production
19 total:
• 5 HP Proliant DL585 G2 Servers
• 14 HP Proliant DL380 G5 Servers
7.3
1.5
71 total:
• 19 x 2 network
• 19 x 1 console
• 2 x 1 cluster
• 4 x 2 backup
Total
144.3
14.5
241
*19 kVA per cabinet based on the HP spec sheet
Table 50. C3 Configuration on Cisco UCS
Production
Configuration
Number of Blades
Number of Chassis
kW per Chassis
Total Chassis kW
Tile
Total Storage, Network, and Consoles
Database Production
Cisco UCS B440 M1
12
6
2.147
12.882
2
48
Database Production
Cisco UCS B440 M1
4
1
2.774
2.774
0.5
12
Backup
Cisco UCS C460
4
4
1.79
7.16
0.5
28
Front end
Cisco UCS B200
8
1
3.75
3.75
0.5
12
Total
28
12
10.461
26.566
3.5
100
Table 51. Net Benefit with Cisco UCS Configuration
HP
Cisco UCS
Benefit
Power
144.3
26.566
543%
Tile
14.5
3.5
414%
Components
241
100
241%
Total Cost of Ownership
Figure 48 shows an estimate of CapEx and OpEx savings with Cisco UCS, showing its reduced TCO.
Figure 48. Analysis of CapEx and OpEx Savings
Assumptions made in the estimate include the following:
• SAN Tier 1 storage was used for production data, and SAN Tier 3 storage was used for nonproduction data and disaster recovery.
• Equipment costs included servers and storage. Network infrastructure costs were not included and were assumed to be similar for each configuration.
• Data center-as-a-service (DCaaS) included the cost of the data center infrastructure, utilities, operation, cabinets, and patching.
• As part of this transformation, few of the nonproduction disaster recovery instances were moved to Tier 3 storage from Tier 1. This is one of the reasons for the savings in storage costs.
• The software cost calculation takes into consideration various enterprise license agreements for the major system and management software.
What Cisco IT Could Have Done Better
The C3 migration was a high-priority project within Cisco IT that had its own resource and timeline constraints. There were several initiatives that IT wanted to consider but could not implement because of the constraints and limitations. These initiatives are included in the roadmap and will be implemented in later phases.
Boot over SAN
Boot over SAN provides one of the fastest ways to recover the system in the event of local disk and blade failures. A SAN LUN is configured as a boot disk and attached to the service profile of the node. In the event of such a failure, the service profile can be disassociated from the failed blade and reassociated with the new one, thus effortlessly carrying all the hardware profiles, such as universal user IDs (UUIDs), MAC addresses, worldwide node names (WWNNs), and worldwide port names (WWPNs), to the new blade. Boot over SAN requires only reassociation, and the details for bringing up the node and interface and other details remain the same, regardless of the underlying application (whether it is an Oracle RAC node or any other middle-tier application).
Using Hugepages
Use of hugepages for Oracle databases was considered but could not be implemented. Oracle Automatic Memory Management (AMM) was also not used for the database. This aspect of the project was postponed and will be taken up later in the test cycles.
Parallel Autoconfig
The parallel autoconfig feature could not be used because it needed an upgrade to the FND patch set in Oracle Applications. This feature could have saved at least 8 to 10 hours of overall downtime during the migration.
A Fibre Channel PortChannel was configured on the C3 Cisco UCS cluster. Two 64-Gbps fabrics delivered 128-Gbps Fibre Channel I/O capacity at peak loads, and 50 percent capacity during fabric or path failures.