What are the usage patterns of individual subscribers - how do they vary by time of day, subscriber group, or region? What applications are consuming the most bandwidth on your network? Are there subscriber segments ripe for new services?
Figure 1. Traffic Categorization Reports
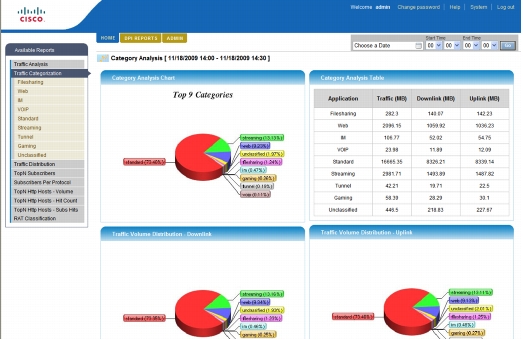
Figure 2. Reports Drilled Down by Individual Subscriber
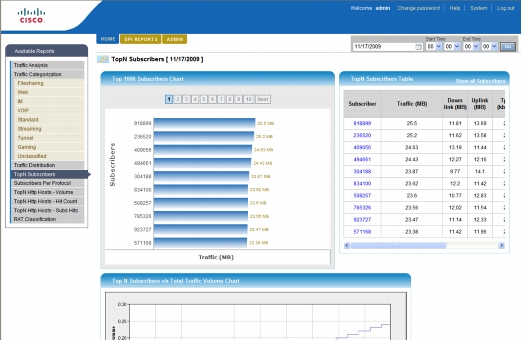
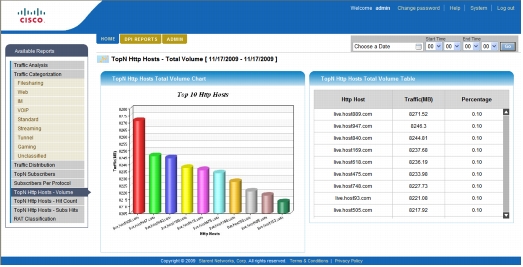
Figure 3. Ten Top HTTP Hosts Report
Cisco Mobility Unified Reporting System enables you to:
• Optimize network performance
• Introduce targeted services
• Plan infrastructure investments
Examples include:
• IMSI/MSISDN/APN - identify top subscribers utilizing the network based on their volume. Use Access Point Names (APNs) to view bandwidth utilization for a particular corporate group.
• Radio Access Technology (RAT) - identify if a subscriber is using a 2G network or 3G network and optimize services accordingly.
Optimize Network Performance
Examples include:
• View total data usage per subscriber
• Protocol distribution during the day - identify the busy hour
• Top user report can highlight heavy users and the need for fair usage policy adjustments
Introduce Targeted Services
Examples include:
• Number of subscribers that like a particular service, for example, gaming
• Top URLs browsed - create a premier service bundle, for example, a sports fan package
• Subscriber quota usage - identify up-sell target if subscriber is consistently going over quota
Plan Infrastructure Investments
For example, statistics show:
• Total volume per gateway
• Total bandwidth utilized per gateway
• Total number of subscribers per gateway
Figure 4. Gateway Statistics
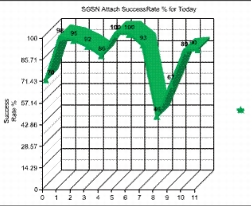
Figure 5. Key Performance Indicators
Report Type Examples
Protocol
• Per hour/day/week/month
• Global - per APN
• Volume distributions
• Sum over all subscribers
Subscriber
Data Usage
• Total volume per user for top N<1000 subscribers - by fixed intervals (minute, day, week, month)
• Total traffic versus traffic used by top N<1000 subscribers
• Per-protocol volume for unique subscriber for each of the top N<1000 subscribers
Subscriber per Protocol/Service
• Number of subscribers for each protocol type (number and percentage)
Device Type (IMEI):
• Number of subscribers for each device type
• Provides details on traffic classified by Radio Access Type such as GERAN, UTRAN, WLAN etc
Applications
P2P
• Throughput for P2P counters
• Connections, bandwidth, and hosts by protocol
• Total bandwidth
VoIP
• Average call duration
• Calls by protocol
• Minutes by protocol
• Bandwidth by protocol
Firewall
• Total denial-of-service (DoS) attacks
Gaming
• Bandwidth and hosts by protocol
• Total bandwidth
HTTP
• Services: URLs, host names, aggregation of URLs to common services, top N by host name
• Content type: Flash video, images, plain text, compressed data
In-line Services
• Reports on content filtering In-line Services
• Reports on firewall In-line Services
KPIs
• Daily/weekly/monthly
• Serving GPRS Support Node (SGSN) attach success rates
• Inter-SGSN Routing Area Update (RAU) attach success rate
• Iu interface throughput (Mbps) and utilization
• Intra-SGSN RAU attach success rate
• Packet Data Protocol (PDP) activation success
• Gr/Gn interface throughput (Mbps) and utilization
Conclusion
• Cisco Mobility Unified Reporting System - comprehensive set of statistics and customized reports
• Cisco inTracer - high-performance network troubleshooting and monitoring tool
• Cisco ASR 5000 Element Management System - protocol monitoring, session monitoring and auditing, and compilation of bulk statistics
For More Information