Contents
Integrating with Operations Manager and Service Monitor
Creating a Capacity Planning Home View
Creating a Trunk Capacity Trend Report
Create a Trunk Utilization SLA
Cisco Unified Service Statistics Manager Licensing
Introduction
Product Overview
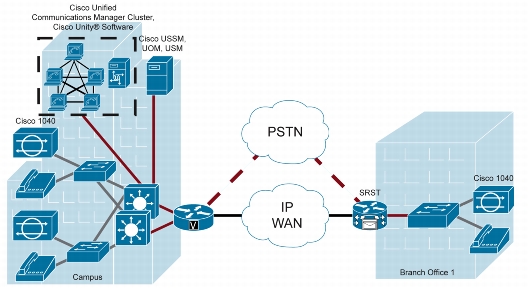
Figure 1. Deployment Example
Features and Benefits
• Integrates with and uses the data collection capabilities of Cisco Unified Operations Manager and Cisco Unified Service Monitor to harvest and consolidate Cisco Unified Communications statistics information from a variety of Cisco devices and systems, including Cisco Unified Communications Manager, Cisco Unified Communications Manager Express (formerly known as Cisco Unified Call Manager Express), Cisco Unity® software, Cisco Unity Connection, Cisco Unity Express, and Cisco IOS® Software-based voice gateways; the collected data stored in a consolidated database can be partitioned based on a variety of network, service, user, and business criteria for detailed analysis and reporting.
• Provides a variety of ready-made reports on key metrics including call volume, call quality, and resource utilization across the Cisco Unified Communications System. Cisco Unified Service Statistics Manager 8.5 provides a variety of reports for executive, operations, and capacity planning personnel. These include:
– Call volume, call duration, service quality, call completion, and mean opinion score (MOS) reports across multiple Cisco Unified Communications Manager clusters, with capabilities to get more information about specific clusters and time periods
– A variety of top-N reports based on calls, users, endpoints, and other entities in the Cisco Unified Communications deployment
– Gateway and trunk traffic and utilization reports over time, with capacity trending and capabilities to get more detailed information
– Call failure analysis reports over time, including cause code information
– Top-N upgrade and downgrade candidates reports for capacity planning and trending
– IP phone and inventory reports
– IP telephony testing reports, including IP SLA test results over time
– A variety of exception and operations reports, including most frequently dialed numbers, longest calls, calls to specified number, and more
– A variety of SLA reports, including SLA capacity trends, SLA compliance history, SLA executive summary, SLA health summary, and more
• Helps enable the user to personalize reports, customizing the content as well as the format and presentation of the reports.
• Facilitates the distribution of reports to executive, operations, and capacity planning personnel through email as well as a user-friendly web-based portal that features a customizable dashboard displayed when the user logs in. Users can specify the reports to be shown on their dashboard as well as the layout in a user-friendly manner. The product features intuitive navigation and detailed reporting from aggregate to fine levels.
• Provides powerful scheduling features, facilitating the generation and distribution of user-specified reports automatically at specific times.
• Facilitates the export of data and reports to external applications and users in a variety of formats, including HTML, PDF, and comma-separated value (CSV) file formats.
• Cisco Unified Service Statistics Manager 8.5 adds the following new reports:
– Device pool-based reports
– Route group utilization reports
– Session Initiation Protocol (SIP) trunk in call volume reports
– Call Admission Control (CAC) location bandwidth reports
– Erlangs and Common Channel Signaling (CCS) added for capacity planning
Service Statistics Workflow
Figure 2. Cisco Unified Service Statistics Manager Workflow
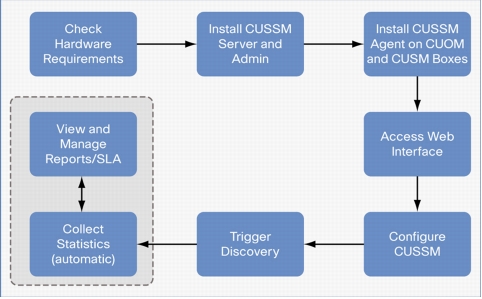
• Service Statistics Manager server: The primary component of Service Statistics Manager. It hosts the database and web interface. It is responsible for talking to remote Service Statistics Manager agents and gathers data from Cisco Unified Operations Manager and Cisco Unified Service Monitor.
• Service Statistics Manager agent: Sends data to the Service Statistics Manager server for data mining. Required to be running in all Cisco Unified Operations Manager and Cisco Unified Service Monitor servers.
• SSM web user interface: Primary user interface for viewing reports, graphs, and SLAs and for administering the dial plan, call quality, and so on.
• SSM administration console: Java console for administering users, groups, and agents. Uses Java Remote Method Invocation (RMI) to communicate with the Service Statistics Manager server. A maximum limit of four instances of the administration console can be installed and used to manage Service Statistics Manager.
Preinstallation Tasks
Server Requirements
• The hardware configuration needed to operate Cisco Unified Service Statistics Manager at different scalability levels and the client requirements are detailed in the Quick Start Guide for Cisco Unified Service Statistics Manager 8.5 available at http://www.cisco.com/en/US/products/ps7285/prod_installation_guides_list.html.
Postinstallation Tasks
Integrating with Operations Manager and Service Monitor
• This section assumes that installation procedures as specified in the Quick Start Guide (installation guide) have been completed.
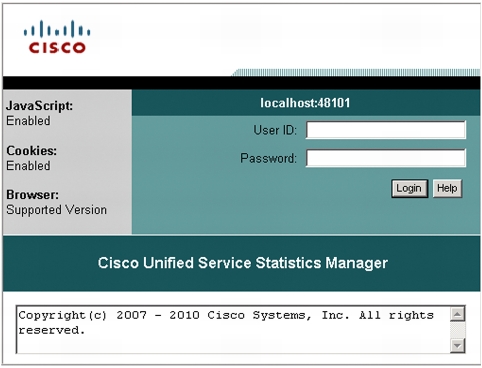
1. Log in to the Cisco Unified Service Statistics Manager GUI through http://<hostname>:48101, where hostname is the name of the machine running SSM. See Figure 3.
Figure 3. Log In to Cisco Unified Service Statistics Manager
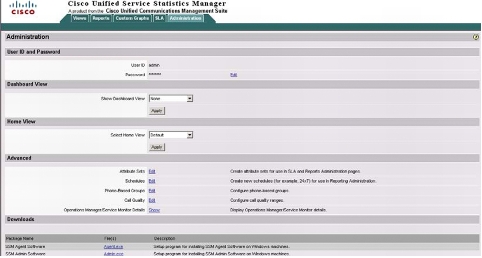
2. Then click Administration > Show (in the Advanced section - see Figure 4).
Figure 4. Click Show in the Advanced Section
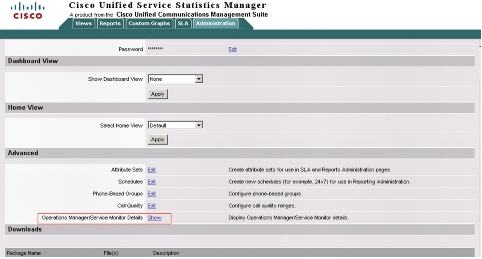
Figure 5. Enter the Operations Manager Server Name, Username, and Password and Click Discover
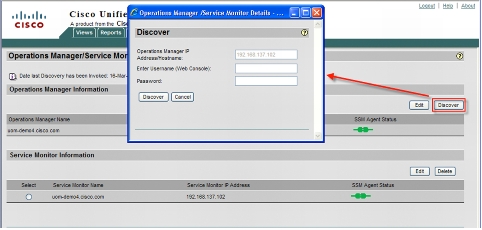
3. Enter the IP address of the Operations Manager server, username, and password. See Figure 5.
4. Click Discover.
Administration Tab
Figure 6. Functions in the Administration Tab
User Scenarios
Creating a Capacity Planning Home View
1. Click the Create button.
2. Enter Capacity Planning Home in the View Title field.
3. Click Add Reports.
4. Select the reports for this view.
Figure 7. Creating a Capacity Planning Home View
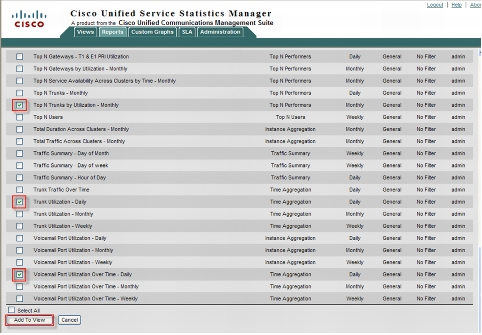
5. Click Add to View after selecting the reports.
Figure 8. Click Finish to Add the Reports
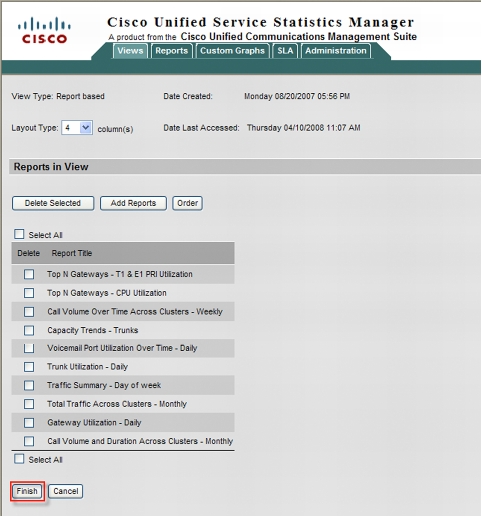
6. Click Finish (see Figure 8).
Figure 9. To View Details, Click the Appropriate Graph or Title
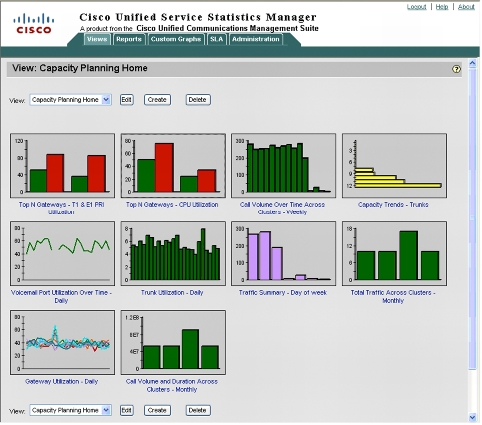
Capacity Trend Reports
Creating a Trunk Group
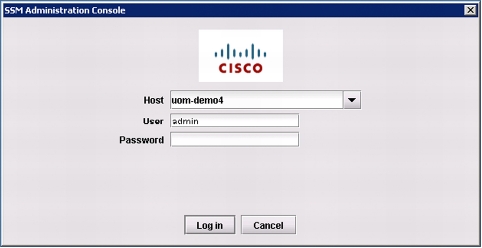
1. Launch the console from Start > Programs > Cisco Unified Service Statistics Manager > Cisco Unified Service Statistics Manager Admin (Figure 10) and log in (Figure 11).
Figure 10. Launch the Administration Console
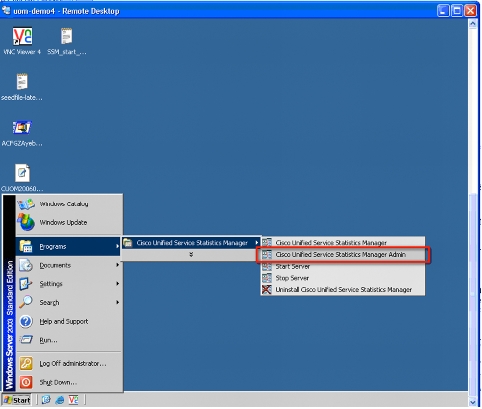
Figure 11. Log In
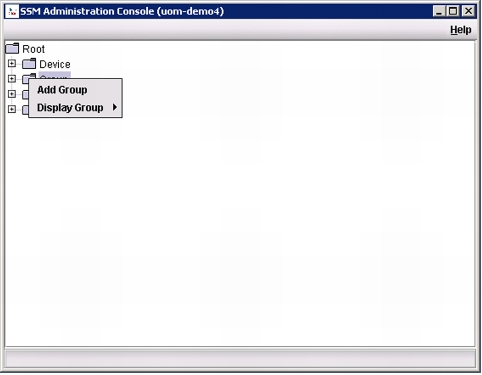
2. Right-Click Group > Add Group (see Figure 12).
Figure 12. Click Add Group
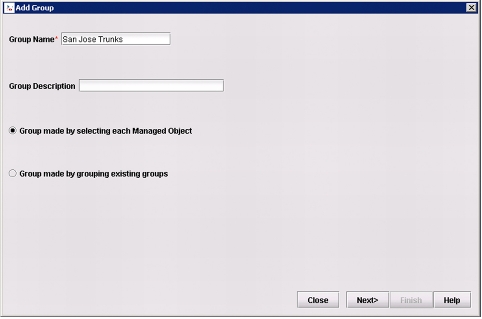
3. Enter the group name (Figure 13).
Figure 13. Add the Group Name
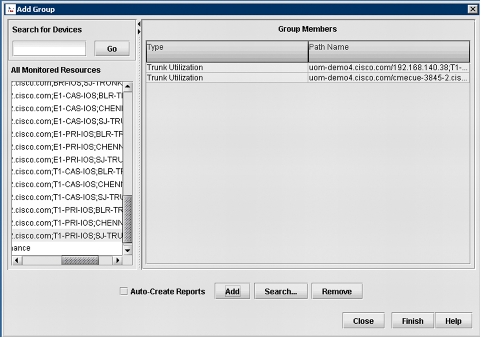
4. Expand the All Monitored Resources tree to Trunk Utilization. Select the trunks in the San Jose group and click Add (Figure 14).
Figure 14. Click Add to Add the Resources
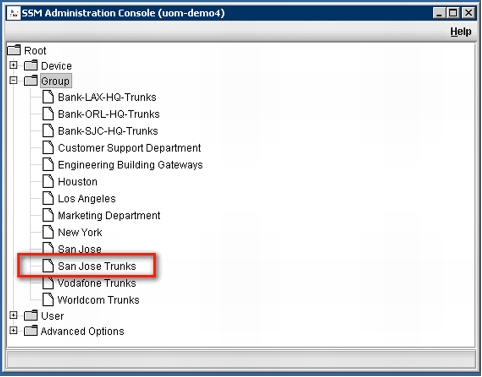
5. Click Finish.
Figure 15. Creating a Trunk Capacity Trend Report
Creating a Trunk Capacity Trend Report
1. Select the Reports tab and click Create (see Figures 16 and 17).
Figure 16. Creating a Capacity Trends Report

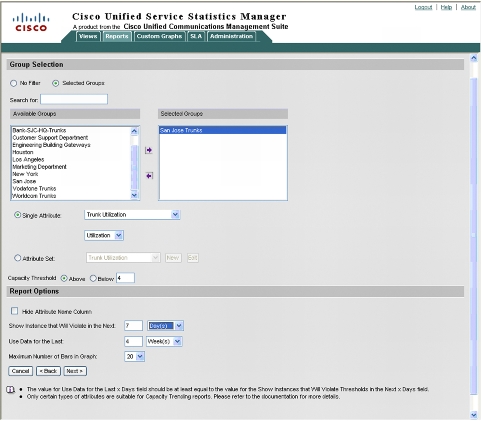
2. Click the Selected Groups option.
3. Highlight San Jose Trunks and move to Selected Groups.
4. Click the Single Attribute option.
5. Select Trunk Utilization and Utilization from the drop-down lists.
6. Enter the Capacity Threshold.
7. Select the appropriate time duration for the "Show Instance that will violate in the next:" and "Use data of the last:" options.
8. Click Next (see Figure 18).
Figure 17. Choosing Report Options
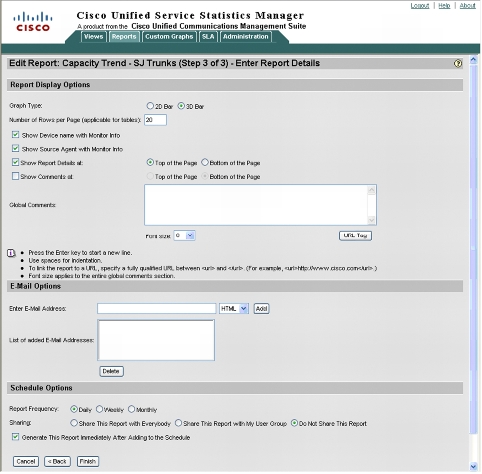
9. Select the 3D Bar radio button for the Graph Type.
10. Select the "Show Device name with Monitor Info", "Show Source Agent with Monitor Info", and "Show Report Details at:" check boxes.
11. Select the "Generate This Report Immediately After Adding to the Schedule" check box.
12. Click Finish.
Figure 18. Enter Report Details
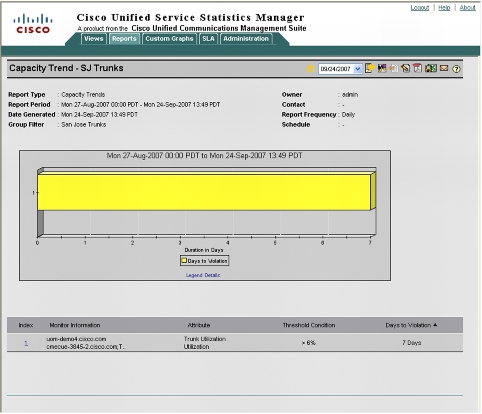
13. Click the Capacity Trend report from the Reports table (Figure 19).
Figure 19. The Capacity Trend Report for San Jose Trunks
SLA Creation
Modify/Create Attribute Set
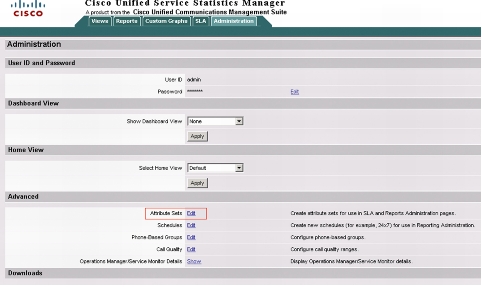
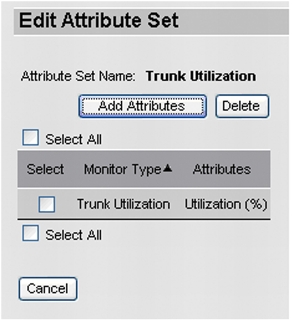
1. In the Administration tab, select the Edit option for Attribute Sets (Figure 20).
Figure 20. Edit the Attribute Sets
2. Click Add or Edit an existing attribute, for example, System Utilization.
3. Add attributes (Figures 21 and 22).
Figure 21. The Attribute Set Administration Dialog Box
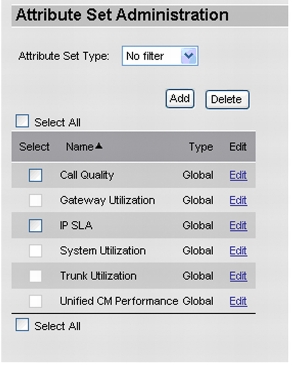
Figure 22. The Edit Attribute Set Dialog Box
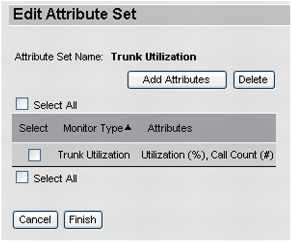
4. Select Trunk Utilization and click Next.
5. Select the Call Count attribute and click Next (Figures 23 and 24).
Figure 23. Select Trunk Utilization
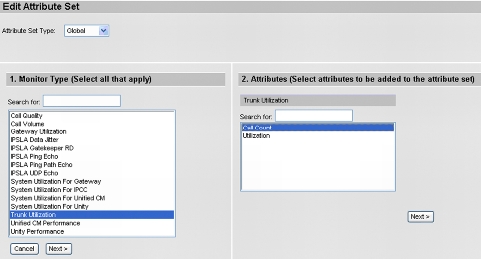
Figure 24. Select the Call Count Attribute
Create a Trunk Utilization SLA
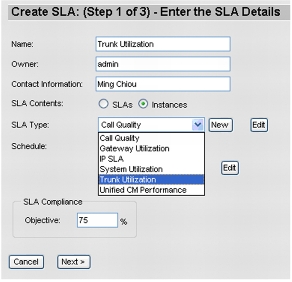
1. On the SLA tab, click SLA Administration > Add.
2. Enter the name and contact information, then select Trunk Utilization from the SLA Type drop-down list and fill in 75% for the SLA Compliance Objective (Figure 25).
3. Click Next.
Figure 25. Entering the SLA Details
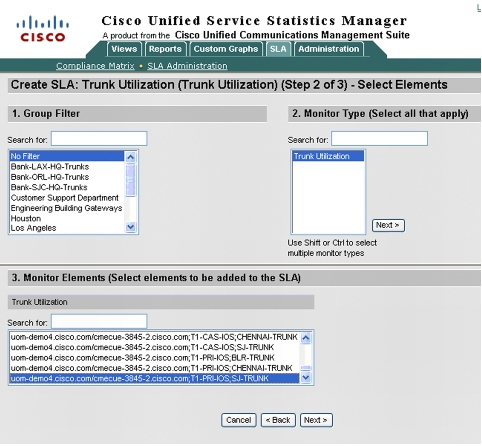
4. Select the trunks to monitor and click Next (Figure 26).
Figure 26. Select the Elements to Monitor
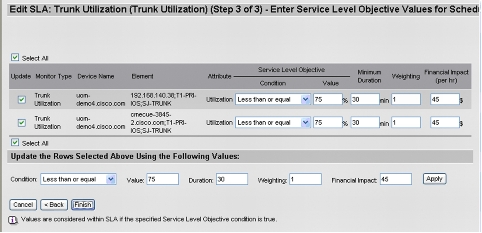
5. Select all or individual trunks, enter the condition parameters, and click Apply and Finish (Figure 27).
Figure 27. Enter the Service-Level Objective Values
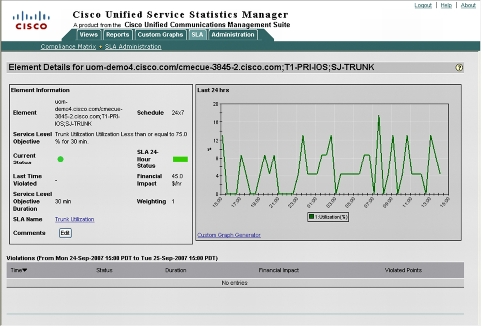
6. The Trunk Utilization SLA is created; to view it, click Compliance Matrix (Figures 28 and 29).
Figure 28. Click Compliance Matrix to View the Trunk Utilization SLA
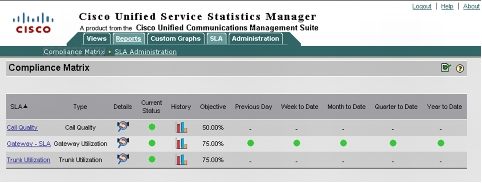
Figure 29. Details for the Trunk Utilization SLA
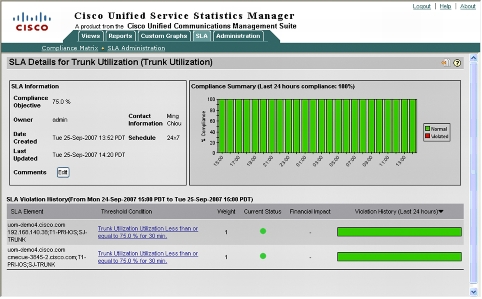
7. Click one of the Threshold Condition links to see more details (Figure 30).
Figure 30. The Threshold Condition Links Provide More Details
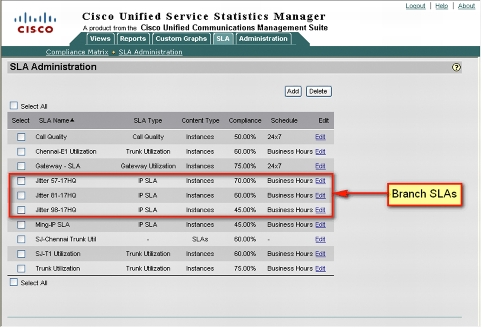
Super-SLA
Figure 31. Branch SLAs
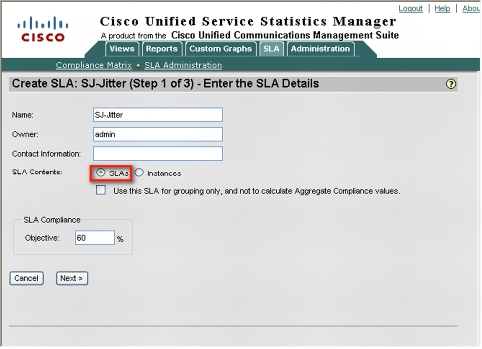
1. Click Add in SLA Administration to create the regional SLA (Figure 32).
Figure 32. Enter the SLA Details
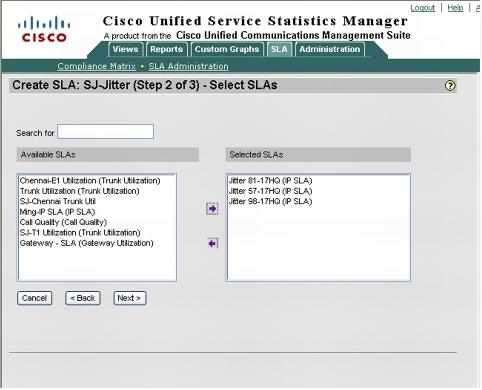
2. Select the three branch SLAs from the list and click the top arrow (Figure 33).
Figure 33. Select the SLAs
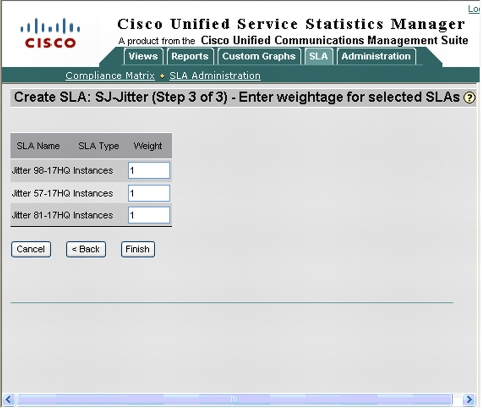
3. The weight can be changed, or you can accept the default setting; click Finish (Figure 34).
Figure 34. Enter a Weight for the Selected SLAs
4. The newly created SLA is shown in the SLA Administration table (Figure 35).
Figure 35. The SLA Administration Table
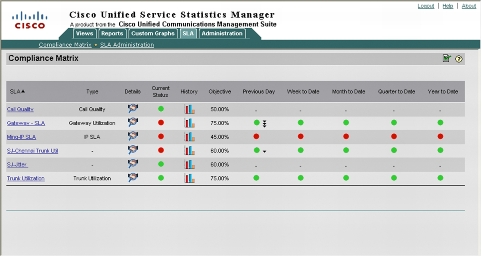
5. Click the Compliance Matrix to view the status of the SLAs. The table will display only the SJ-Jitter SLA since the branch SLAs have been rolled up into SJ-Jitter (Figure 36).
Figure 36. The Compliance Matrix
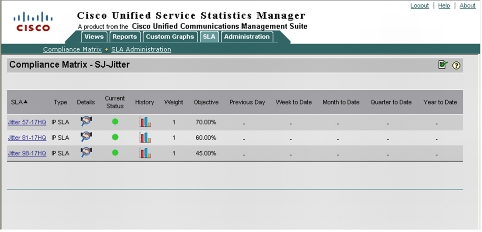
6. View the branch SLAs by clicking SJ-Jitter in the list of SLAs (Figure 37).
Figure 37. The Branch SLAs
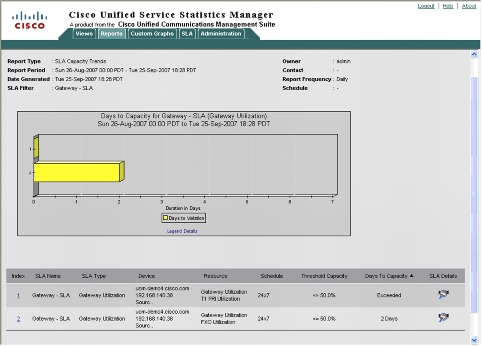
SLA Capacity Trends
Figure 38. SLA Capacity Trends Report
Troubleshooting
Note: Cisco Unified Service Statistics Manager collects data from Cisco Unified Operations Manager and Cisco Unified Service Monitor. Ensure Operations Manager and Service Monitor (optional) is running first and operational prior to troubleshooting Service Statistics Manager.
Installation Failing
• Service Statistics Manager Installer automatically checks for system requirements prior to the start of installation. This is to help ensure that the target server complies with Service Statistics Manager's minimum system requirements.
• The TCP ports listed in Table 1 are in use by Service Statistics Manager and must be available and exempted from firewall inspections.
Table 1. TCP Ports Used by Service Statistics Manager
Logon Failure
• Check whether Cisco Unified Operations Manager is reachable from Cisco Unified Service Statistics Manager. Try launching the Operations Manager web interface from Service Statistics Manager server, that is, open a browser to http://CUOM:1741.
• Check whether the Service Statistics Manager agent is running in the remote Operations Manager server. Windows Control Panel > Services > Agent must be running.
• Check whether the Operations Manager admin password has been changed. To synchronize the Operations Manager password with Service Statistics Manager, run <Install Directory>\pw\pronto\bin\ runjava scripts.ssm.UpdateOMPassword. The script will ask for the new Operations Manager password. Then restart Service Statistics Manager from Start > Programs > SSM > Stop/Start shortcuts.
• Check the Service Statistics Manager log file at \pw\pronto\logs\ProactiveNet.log. If the log file shows multiple SSL handshake errors, run this script at \pw\pronto\bin\ConfigureSSMToSSLOM <CUOM_IP_Address>. Then restart Service Statistics Manager.
Autodiscovery
• Make sure that the Operations Manager IP address and password are correct and that the Service Statistics Manager agent is running on that remote Operations Manager server.
• If Monitor Types are not getting created, make sure Performance Polling is enabled in Operations Manager. On how to enable performance polling in Operations Manager, refer to http://www.cisco.com/en/US/partner/docs/net_mgmt/cisco_unified_operations_manager/2.3/user/guide/cfgPT.html#wp1546763.
• If call volume and call quality monitors are not getting created, check whether Service Monitor is configured in Operations Manager > UC Management tab > Service Monitor.
• If new devices are added in Operations Manager or Service Monitor, make sure to rerun discovery from Service Statistics Manager.
• To further troubleshoot autodiscovery issues, enable Service Statistics Manager detailed logging by running the following in the command line: pw debug -p jserver -s SSMAutoDiscovery. Log files will be stored in the \pw\pronto\logs\Debug folder.
Data Collection Failure
• Check whether Service Statistics Manager processes are still running. Run \CUSSM\serverstatus.bat. If Service Statistics Manager processes are not in the running state (that is, are stopped), you may restart Service Statistics Manager.
• Check whether Operations Manager and Service Monitor are operational. Try rediscovering Operations Manager and make sure discovery succeeds.
Cisco Unified Service Statistics Manager Licensing