Contents
About Cisco Unified Operations Manager
Managing Cisco Unified Communications Manager
Recommendations on Performance Monitoring
Recommendations on Events for Notification Service
Introduction
About Cisco Unified Operations Manager
• Cisco Unified Communications Manager
• Cisco Unified Communications Manager Express
• Cisco Unity®
• Cisco Unity Express
• Cisco Unified Contact Center
• Cisco Unified Contact Center Express
• Cisco Unified Presence Server
• Cisco Emergency Responder
• Cisco Unified MeetingPlace® Express
• Cisco gateways, routers, switches, and IP phones
Managing Cisco Unified Communications Manager
• The IP address or hostname
• The SNMP read-only credentials
• The HTTP credentials: You only need credentials with read-level access to http://<server-name>/ccmadmin. For information on how to create a read-only Cisco Unified Communications Manager user account, see the User Guide for Cisco Unified Operations Manager 2.1, located on Cisco.com at http://www.cisco.com/en/US/products/ps6535/products_user_guide_list.html.
• Why Does a Device Go into the Partially Monitored State?
• Why Does a Device Go into the Unreachable State?
Figure 1. Entry Point for Managing Cisco Unified Communications Manager
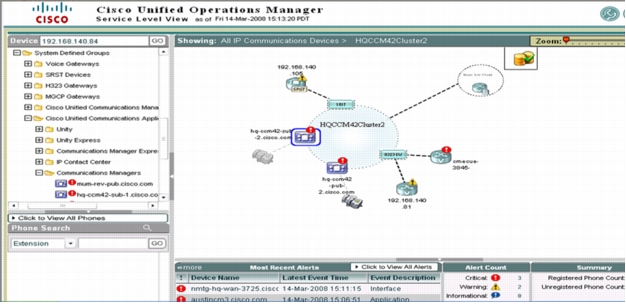
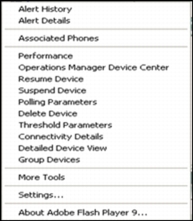
Figure 2. List of Context-Sensitive Tools
Basic Health Monitoring
Table 1. Basic Health Monitoring
Fault Monitoring
Table 2. Fault Monitoring
|
Fault Condition |
Event Details |
|
CPU pegging |
CpuPegging Event Description: This event occurs when the percentage of CPU load on a call processing server is over the configured percentage for the configured period of time. This event is generated based on polling RTMT precanned counters. To view the threshold, select Administration > Polling and Thresholds > Thresholds > RTMT. Default Polling: 30 seconds Default Threshold: Not Applicable Recommended Actions: Check Cisco Unified Communications Manager Windows Task Manager or Real Time Monitoring Tool to verify CPU high utilization. The most common reason for this event is that one or more processes are using excessive CPU space. The event has information on which process is using the most CPU. Once the process is identified, you may want to take action, which could include restarting the process. It is helpful to check the trace setting for that process. Using the detailed trace level is known to take up excessive CPU space. Also check for events such as the Code Yellow event, and launch Operations Manager synthetic tests such as Dial Tone Test to see if there is any impact on call processing. If so, you may want to take more drastic measures, such as stopping nonessential services or scheduling a restart of Cisco Unified Communications Manager service during off hours. For more details, go to the following links: http://www.cisco.com/en/US/products/sw/voicesw/ps556/products_tech_note09186a00808ef0f4.shtml http://www.cisco.com/en/US/products/sw/voicesw/ps556/products_tech_note09186a00807f32e9.shtml |
|
Insufficient hard disk space |
LogPartitionHighWaterMarkExceeded Event Description: This event indicates that the percentage of used disk space in the log partition has exceeded the configured high water mark. This event is generated based on polling RTMT precanned counters. To view the threshold, select Administration > Polling and Thresholds > Thresholds > RTMT. Default Polling Interval: 30 seconds Default Threshold: Not Applicable Recommended Actions: Log partition usage can be monitored from the RTMT "Disk Usage" precan page. It shows up as Common Partition. Check trace settings and also check for core dump files. Please note that core dump files are fairly large. Typically, a core dump file is 200 MB-300 MB in size, but it can also be 1 GB or 2 GB. Please note that once the log partition disk usage goes above the high water mark threshold, Cisco Log Partition Monitoring Tool (LPM) will start deleting files to put log partition disk usage under the low water mark threshold. Since LPM may delete the trace/log/core dump files you want to keep, it is very important to act when you receive a LogPartitionLowWaterMarkExceeded alert. You can use Trace and Log Central (TLC) to download files and delete them from the server. LogPartitionLowWaterMarkExceeded Event Description: This event indicates that the percentage of used disk space in the log partition has exceeded the configured low water mark. This event is generated based on polling RTMT precanned counters. Default Polling Interval: 30 seconds Default Threshold: Not Applicable Recommended Actions: See LogPartitionHighWaterMarkExceeded. LowInactivePartitionAvailableDiskSpace Event Description: This event indicates that the percentage of available disk space in the inactive partition is lower than the configured value. This event is generated based on polling RTMT precanned counters. To view the threshold, select Administration > Polling and Thresholds > Thresholds > RTMT. Default Polling Interval: 30 seconds Default Threshold: Not Applicable Recommended Actions: Since there are no user-manageable files in Inactive Partition, check the alert threshold. If the threshold is at the Cisco default, then contact the Cisco Technical Assistance Center (TAC) for guidance. LowActivePartitionAvailableDiskSpace Event Description: This event indicates that the percentage of available disk space in the active partition is lower than the configured value. This event is generated based on polling RTMT precanned counters. To view the threshold, select Administration > Polling and Thresholds > Thresholds > RTMT. Default Polling Interval: 30 seconds Default Threshold: Not Applicable Recommended Actions: Some of the symptoms of low active disk space are: • CCM Admin page does not operate correctly.
• BAT does not operate correctly.
• RTMT does not operate correctly.
Since there are no user-manageable files in Active Partition, check the alert threshold. If the alert threshold is at the Cisco default, then contact Cisco TAC for guidance. LowAvailableDiskSpace Event Description: This event indicates that the percentage of available disk space is lower than the configured value. This event is generated based on polling RTMT precanned counters. To view the threshold, select Administration > Polling and Thresholds > Thresholds > RTMT. Default Polling Interval: 30 seconds Default Threshold: Not Applicable Recommended Actions: Check the available disk space percentage and delete unnecessary files. |
|
Insufficient virtual memory |
LowAvailableVirtualMemory Event Description: This event occurs when the percentage of available virtual memory is lower than the configured value. This event indicates that the available virtual memory is running low. This event is generated based on polling RTMT precanned counters. To view the threshold, select Administration > Polling and Thresholds > Thresholds > RTMT. Default Polling Interval: 30 seconds Default Threshold: Not Applicable Recommended Actions: Check Cisco Unified Communications Manager Windows Task Manager or the RTMT tool to verify insufficient memory. This event may be due to a memory leak. It is important to identify which process is using excessive memory. Once the process is identified, if you suspect a memory leak (for example, if the memory usage for a process increases continually, or a process is using more memory than it should), you may want to restart that process. LowSwapPartitionAvailableDiskSpace Event Description: This event occurs when the percentage of available disk space of the swap partition is lower than the configured value. This event indicates that available swap partition is running low. Please note that the swap partition is part of virtual memory. Therefore, low available swap partition disk space also means low virtual memory. This event is generated based on polling RTMT precanned counters. To view the threshold, select Administration > Polling and Thresholds > Thresholds > RTMT. Default Polling Interval: 30 seconds Default Threshold: Not Applicable Recommended Actions: When you receive this event, you should find out how much swap space and virtual memory are still available. You should also find out find out which process is using the most memory. This event may be due to a memory leak. Once you determine that there is a memory leak and virtual memory is running low, you may want to restart the service after saving the necessary troubleshooting information. Please consult the Cisco TAC for further information. |
|
System fan is down or degraded |
FanDown Event Description: This event indicates that a required fan is not operating correctly. The event is based on processing the SNMP trap cpqHeThermalSystemFanFailed received from monitored Cisco Unified Communications Managers. Default Threshold: Not Applicable Recommended Actions: Check the status of the reported fan and contact Cisco for hardware replacement. FanDegraded Event Description: This event indicates that an optional fan is not operating correctly. The event is based on polling or processing the SNMP trap cpqHeThermalSystemFanDegraded received from monitored Cisco Unified Communications Managers. Default Threshold: Not Applicable Recommended Actions: Check the status of the reported fan and monitor for recurrence. |
|
System chassis temperature is high |
TemperatureHigh Event Description: This event is generated if a temperature sensor's current temperature exceeds the relative temperature threshold. Default Polling Interval: 4 minutes Default Threshold: 10 percent Recommended Actions: Verify that environmental temperatures are set up optimally. Check other events, such as FanDown or FanDegraded, to verify that fans are operating normally. If fans are not operating normally, you should contact Cisco for hardware replacement. |
|
System temperature sensor is down or degraded |
TemperatureSensorDown Event Description: This event indicates that the server's temperature is outside of the normal operating range and the system will be shut down. The event is based on processing the SNMP trap cpqHeThermalTempFailed received from monitored Cisco Unified Communications Managers. Default Threshold: Not Applicable Recommended Actions: Verify that environmental temperatures are set up correctly. Identify the reported temperature sensor location (ioborad/cpu) and verify status. Check other events, such as FanDown or FanDegraded, to verify that system fans are operating normally. Contact Cisco for hardware replacement, if needed. TemperatureSensorDegraded Event Description: This event indicates that the server's temperature is outside of the normal operating range. The event is based on polling or processing the SNMP traps cpqHeThermalTempDegraded received from monitored Cisco Unified Communications Managers. Default Threshold: Not Applicable Recommended Actions: Identify the reported temperature sensor location (ioborad/cpu) and verify status. Check other events, such as FanDown or FanDegraded, to verify that system fans are operating normally. Contact Cisco for hardware replacement, if needed. |
|
System power supply is down or degraded |
PowerSupplyDown Event Description: Power supply state is down. Default Polling Interval: 4 minutes Default Threshold: Not Applicable Recommended Actions: Check the status of the reported power supply and contact Cisco for hardware replacement if the primary power supply is down. PowerSupplyDegraded Event Description: Power supply state is degraded. Default Polling Interval: 4 minutes Default Threshold: Not Applicable Recommended Actions: Check the status of the reported power supply and monitor for recurrence. |
|
A critical application stops running |
ServiceDown Event Description: This event is generated when one of the critical services (any of the services in the Detailed Device View) is not running. The problem could be due to someone manually stopping the service. If you intend to stop the service for a long period of time, disabling monitoring for the service is highly recommended and is needed to avoid this alert. Go to Service Level View > Detailed Device View, select the specific service, and change the managed state to False. Default Polling Interval: 30 seconds Default Threshold: Not Applicable Recommended Actions: Identify which services are not running. You can start the service manually from the Administrator Service Control page. Also, check to see if there are any core files. Download the core files, if any, as well as service trace files. |
|
Cisco Unified Communications Manager has entered a Code Red state (call throttling) |
Code Red Event Description: This event indicates that Cisco Unified Communications Manager has remained in a Code Yellow state for an extended period and cannot recover. This event is generated by monitoring the syslog messages received from Unified Communications Manager. Default Polling Interval: Not Applicable Default Threshold: Not Applicable Recommended Actions: When Cisco Unified Communications Manager enters a Code Red state, the Cisco Unified Communications Manager service restarts, which also produces a memory dump that may be helpful for analyzing the failure. Generally, repeated call throttling events require assistance from the Cisco TAC. Cisco Unified Communications Manager SDI and SDL trace files record call-throttling events and can provide useful information. The TAC will likely request these trace files for closer examination. |
|
Cisco Unified Communications Manager has entered a Code Yellow state (call throttling) |
Code Yellow Event Description: This event is generated when Cisco Unified Communications Manager has initiated call throttling due to an unacceptably high delay in handling incoming calls. This event is generated by monitoring the syslog messages received from Unified Communications Manager. Default Polling Interval: Not Applicable Default Threshold: Not Applicable Recommended Actions: While this event generates, check process CPU usage and memory usage. Check for call bursts and an increased number of registered devices (phones, gateways, and so on) generated. Continuously monitor to see if Cisco Unified Communications Manager is out of the Code Yellow state. You can launch synthetic tests such as the Dial Tone Test to check for any impact on call processing. To try to circumvent the possibility of a Code Yellow event, consider the possible causes of a system overload, such as heavy call activity, low CPU availability to Cisco Unified Communications Manager, routing loops, disk I/O limitations, disk fragmentation, and so on, and investigate those possibilities. For more information, go to http://www.cisco.com/en/US/docs/voice_ip_comm/cucm/admin/5_1_3/ccmfeat/fsclthrt.html. |
|
Active link between CTI Manager and Cisco Unified Communications Manager is down |
CTILinkDown Event Description: Operations Manager generates a CTILinkDown event when the Cisco Unified Communications Manager performance counter CcmLinkActive indicates that the total number of active links from CTI Manager to all active Cisco Unified Communications Managers in the cluster is zero. This event indicates that CTI Manager has lost communication with all Cisco Unified Communications Managers in the cluster. Default Polling Interval: 4 minutes Default Threshold: Not Applicable Recommended Actions: CTI Manager maintains links to all active Cisco Unified Communications Managers in the cluster. Investigate to determine if the CTI Manager service is running, if Communication Managers in the cluster are running, or whether a network problem exists. |
|
Drive down on server |
DataPhysicalDiskDown Event Description: Hard drive failure event on Cisco Unified Communications Manager. Default Polling Interval: 4 minutes Default Threshold: Not Applicable Recommended Actions: Contact Cisco for hardware replacement. |
|
Subscriber in cluster experienced failure when replicating to publisher database |
DB Replication Failure Event Description: DBReplicationFailure event is generated when there is a Communications Manager database replication failure. This event is generated based on polling RTMT precanned counters. Default Polling Interval: 30 seconds Default Threshold: Not Applicable Recommended Actions: Monitor syslog for IDSEngineCritical syslog messageClassID of 30-39, which indicates a replication problem. This message will have more detailed information on the cause of the event. IDS Replication Failure (for Communications Manager version 5.0, 5.1.1, and 5.1.2) Event Description: IDSReplicationFailure event is generated when there is a Communications Manager database replication failure. This event is generated by monitoring the syslog messages received from CCM. This implementation works for CCM versions 5.0, 5.1.1, and 5.12. Default Polling Interval: Not Applicable Default Threshold: Not Applicable Recommended Actions: Monitor syslog for IDSEngineCritical syslog messageClassID of 30-39, which indicates a replication problem. This message will have more detailed information on the cause of the event. |
|
Local Communications Manager lost communication with the remote Communications Manager |
SDL Link Out Of Service Event Description: This event indicates that the local Cisco Communications Manager has lost communication with the remote Communications Manager. This event is generated by monitoring the syslog messages received from CCM. Default Polling Interval: Not Applicable Default Threshold: Not Applicable Recommended Actions: Investigate why the remote Communications Manager is not running or whether a network problem exists. |
|
Web service is down |
CCMHttpServiceDown Event Description: This event indicates that HTTP service cannot be used to communicate to all Cisco Unified Communications Managers in the cluster. This might be due to one or both of the following: The web service for all Cisco Unified Communications Managers in the cluster is down. The credentials (HTTP username, password) for at least one of the running web services were not found or are incorrect. Default Polling Interval: 4 minutes Default Threshold: Not Applicable Recommended Actions: Verify that all Cisco Unified Communications Managers are accessible through the web service with the credentials provided in Operations Manager. Provide the correct username and password if the credentials are wrong. You might need to restart the web server if web service is down. Make sure that Cisco Unified Communications Managers are patched to protect against viruses. |
|
Authentication failure in login attempt |
Authentication Failed Event Description: This event occurs when there is authentication failure in a login attempt. This event is generated by monitoring the syslog messages received from Unified Communications Manager. Default Polling Interval: Not Applicable Default Threshold: Not Applicable Recommended Actions: Check security logs for further details, and investigate the source of the failed login attempts. |
|
Gateway port unavailability or out-of-service issue |
HighAnalogPortUtilization Event Description: Percentage utilization of an analog port has exceeded one of the following: • Cisco Unified Communications Manager Analog Port Utilization Threshold
• FXS Port Utilization Threshold
• FXO Port Utilization Threshold
Note: You must enable polling for Voice Utilization Settings to monitor this event. Default Polling Interval: 4 minutes Default Threshold: 90 percent Recommended Actions: Use this event to assess whether you should install additional resources. When the event is generated, check event details and identify which resource has exceeded the threshold. Use the performance graph to monitor resource utilization in real time over the past 72 hours, which will help you determine if you need to add resources. |
|
Media list exhausted |
Media List Exhausted Event Description: This event indicates that all available media resources defined in the media list are busy. This event is generated by monitoring the syslog messages received from Unified Communications Manager. Default Polling Interval: Not Applicable Default Threshold: Not Applicable Recommended Actions: Install additional resources to the indicated media resource list. This event indicates a network failure or device failure. |
|
Hardware failure |
Hardware Failure Event Description: This event indicates that a hardware failure has occurred in Communications Manager. This event is generated by monitoring the syslog messages received from Unified Communications Manager. Default Polling Interval: Not Applicable Default Threshold: Not Applicable Recommended Actions: Check the RTMT Syslog Viewer for further details. |
|
Number of registered phones, gateways, and media devices increased/decreased |
Number Of Registered Phones Dropped Event Description: This event occurs when the number of registered phones in the cluster dropped more than the configured percentage between consecutive polls. This event is generated by monitoring the syslog messages received from Unified Communications Manager. Default Polling Interval: Not Applicable Default Threshold: 10 percent Recommended Actions: Phone registration status must be monitored for sudden changes. If the registration status changes slightly and readjusts quickly over a short time frame, it could indicate a phone move, addition, or change. A sudden smaller drop in the phone registration counter could indicate a localized outage; for instance, an access switch or a WAN circuit outage or malfunction. A significant drop in registered phone level requires immediate attention from the administrator. PhoneUnregisteredThresholdBased Event Description: This event indicates that the selected phone-based notification group's phones unregistered count is more than the Unified Communications Manager-based event threshold. Default Polling Interval: 4 minutes Default Threshold: 5 Recommended Actions: See Number Of Registered Phones Dropped. PhoneUnregistered Event Description: This event indicates that the selected phone-based notification group's phones unregistered count is less than the Unified Communications Manager-based event threshold. Default Polling Interval: 4 minutes Default Threshold: 5 Recommended Actions: See Number Of Registered Phones Dropped. |
|
Route loop over H323 trunk |
ICT Call Throttling Event Description: This event occurs when Cisco Communications Manager has detected a route loop over the H323 trunk. As a result, Unified Communications Manager has temporarily stopped accepting calls for the indicated H323 device. This event is generated by monitoring the syslog messages received from Unified Communications Manager. Default Polling Interval: Not Applicable Default Threshold: Not Applicable Recommended Actions: Remove route loop. |
|
Cisco DRF Failure |
Cisco DRF Failure Event Description: This event indicates that the DRF backup or restore process encountered errors. The event is generated by monitoring the syslog messages received from Unified Communications Manager. Default Polling Interval: Not Applicable Default Threshold: Not Applicable Recommended Actions: Verify whether /common/drf has the required permission and enough space for the DRF user. Check the application logs for further details. |
|
Core dump file found |
Core Dump File Found Event Description: This event indicates that a core dump file has been found in the system, which indicates a service crash. The event is generated by monitoring the syslog messages received from Unified Communications Manager. Default Polling Interval: Not Applicable Default Threshold: Not Applicable Recommended Actions: Use RTMT Trace and Log Central to collect the new core files and the corresponding service's last trace log files. Run gdb to get the back trace of each core file for further debugging. From the Communications Manager Service Control page, you can verify whether the service was restarted successfully. If not, start it manually. |
|
MGCP high port utilization (T1 CAS/T1 PRI/E1 PRI/BRI/E1 CAS) |
HighDigitPortUtilization Event Description: The percentage of utilization of a digital port has exceeded one of the following: • BRI Channel Utilization Threshold
• T1 PRI Channel Utilization Threshold
• E1 PRI Channel Utilization Threshold
• T1 CAS Channel Utilization Threshold
Note: You must enable polling for Voice Utilization Settings to monitor this event. Default Polling Interval: 4 minutes Default Threshold: 90 Recommended Actions: Use this event to assess whether you should install additional resources. When this event is generated, check event details and identify which resource has exceeded the threshold. Use the performance graph to monitor the resource utilization in real time over the past 72 hours and determine if you need to add additional resources. |
|
Cisco Unified Communications Manager high resource utilization (MTP, MOH, conference, transcoder) |
HighResourceUtilization Event Description: This event indicates that a certain specified type of resource has exceeded one of the following: • MOH Multicast Resources Active Threshold
• MOH Unicast Resources Active Threshold
• MTP Resources Active Threshold
• Transcoder Resources Active Threshold
• Hardware Conference Resources Active Threshold
• Software Conference Resources Active Threshold
• Conferences Active Threshold
• Conference Streams Active Threshold
• MOH Streams Active Threshold
• MTP Streams Active Threshold
• Location Bandwidth Available Threshold
Note: You must enable polling for Voice Utilization Settings to monitor this event. Default Polling Interval: 4 minutes Default Threshold: 90 percent Recommended Actions: Use this event to assess whether you should install additional resources. While this event is generated, click the event ID to view event details and identify which resource has exceeded the threshold. Use the performance graph to monitor the resource utilization in real time over the past 72 hours to determine if you need to install additional resources. |
|
CDR-related issue |
CDR Maximum Disk Space Exceeded Event Description: This event indicates that the CDR (Call Detail Record) files' disk usage exceeded the maximum allocation. Some undelivered files have been deleted. This event is generated by monitoring the syslog messages received from Unified Communications Manager. Default Polling Interval: Not Applicable Default Threshold: Not Applicable Recommended Actions: Perform the following checks: • Check for too many undelivered CDR files accumulated due to some condition.
• Check network link status.
• Verify that the billing server is operational.
• Verify that the SFTP Server on the billing server is running and accepting requests.
• Verify that the CDRM Configuration for billing servers is correct, under Serviceability > Tools.
• Check to determine if CDR files maximum disk allocation is too low, under Serviceability > Tools.
• Check the CDR Repository Manager trace, under /var/log/active/cm/trace/cdrrep/log4j.
CDR Agent Send File Failed Event Description: This event indicates that the CDR agent cannot send CDR files from the Unified Communications Manager node to the CDR node within the cluster. This event is generated by monitoring the syslog messages received from Unified Communications Manager. Default Polling Interval: Not Applicable Default Threshold: Not Applicable Recommended Actions: Do the following: • Check network link status.
• Verify that the CDR node (first node in the cluster) is running.
• Verify that the CDR Repository Manager is activated on the first node.
• Check the CDRM Configuration, under Serviceability > Tools.
• Check the CDR agent trace on the specific node where the error occurred.
• Check the CDR Repository Manager trace.
• Check to determine whether the Publisher is being upgraded. If the CDRAgentSendFileFailureContinues event is no longer present, the condition is corrected.
CDR File Delivery Failed Event Description: This event indicates that FTP delivery of CDR files to the outside billing server failed. This event is generated by monitoring the syslog messages received from Unified Communications Manager. Default Polling Interval: Not Applicable Default Threshold: Not Applicable Recommended Actions: Perform the following checks: • Check network link status.
• Verify that the billing server is running.
• Verify that the SFTP Server on the billing server is running and accepting requests.
• Verify that the CDRM configuration is correct, under Serviceability > Tools.
• Check the CDR Repository Manager trace.
CDR High Water Mark Exceeded Event Description: This event indicates that the high water mark for CDR files has been reached, and some successfully delivered CDR files have been deleted. This event is generated by monitoring the syslog messages received from Unified Communications Manager. Default Polling Interval: Not Applicable Default Threshold: Not Applicable Recommended Actions: See CDR Maximum Disk Space Exceeded. |
|
Thread counter update stopped |
Thread Counter Update Stopped Event Description: This event indicates that the current total number of processes or threads has exceeded the maximum number of tasks. This situation could indicate that some process is leaking or has thread leaking. System access must stop thread counter update to avoid CPU pegging, and only provide process counter information for up to the maximum number of processes. This event is generated by monitoring the syslog messages received from Unified Communications Manager. Default Polling Interval: Not Applicable Default Threshold: Not Applicable Recommended Actions: Check the alert detail for the process that has the highest number of threads and the process that has the most instances. If the process has an unusual number of threads or process instances, save the trace for the service and perhaps restart the service. Make sure to download trace files associated with the service. |
|
SOAP not reachable |
SOAPNotReachable Event Description: A device experienced Simple Object Access Protocol (SOAP) connectivity failure while polling. SOAP attributes will not be polled. Default Polling Interval: 4 minutes Default Threshold: Not Applicable Recommended Actions: A Cisco Unified Communications Manager device experienced SOAP communication failure with the management application. Restart IIS Admin Service and Cisco RIS Data Collection on Communications Manager. |
|
System version mismatched |
SystemVersionMismatched Event Description: This event occurs when there is a mismatch in the system version among all servers in the cluster. This event is generated by monitoring the syslog messages received from Unified Communications Manager. Default Polling Interval: Not Applicable Default Threshold: Not Applicable Recommended Actions: Make sure that all servers in the cluster are running the same system version. |
|
Unknown Publisher |
UnknownPublisher Event Description: This event indicates that the Publisher is not known to Operations Manager. This event is generated based on polling RTMT precanned counters. Default Polling Interval: 30 seconds Default Threshold: Not Applicable Recommended Actions: Check if Publisher is managed by Operations Manager. |
|
Route List Exhausted |
Route List Exhausted Event Description: This event indicates that all available channels define in the route list are busy. This event is generated by monitoring the syslog messages received from Unified Communications Manager. Default Polling Interval: Not Applicable Default Threshold: Not Applicable Recommended Actions: Check the RTMT Syslog Viewer for verification and further details. This event should be used to assess whether additional routes should be added in the indicated route. |
|
Server Unreachable |
ServerUnreachable Event Description: This event indicated that the host is not reachable through RTMT polling. This event is generated based on polling RTMT precanned counters. Default Polling Interval: 30 Seconds Default Threshold: Not Applicable Recommended Actions: Investigate if the indicated host is running and whether a network problem exists. |
|
D channel out of service |
D Channel Out Of Service Event Description: This event indicates that the MGCP D channel is out of service. This event is generated by monitoring the syslog messages received from Unified Communications Manager. Default Polling Interval: Not Applicable Default Threshold: Not Applicable Recommended Actions: Check the status of the indicated D channel in the indicated gateway to verify whether it is out of service and investigate the root cause. |
|
RTMT data missing |
RTMTDataMissing Event Description: This event indicates that the Publisher is known to Operations Manager. However, a query to RTMT resulted in error for all the nodes in the cluster. This event is generated based on polling RTMT precanned counters. Default Polling Interval: 30 seconds Default Threshold: Not Applicable Recommended Actions: Investigate if all the nodes in the cluster are running and whether a network problem exists. |
Polling and Thresholds
Table 3. Polling Settings
Table 4. Threshold Settings
Performance Monitoring
• Resource usage (CPU, memory, MTP resources, transcoder resources, MOH Multicast/Unicast resources, hardware/software conference resources, location bandwidth available, CTI links active)
• Call statistics (active calls)
• Trunk statistics (trunk usage at DS0 level, port usage, gateway statistics)
• Registered devices (hardware phones, MGCP gateways, analog devices)
Synthetic Tests
• Phone Registration Test: Opens a connection with the selected Cisco Unified Communications Manager and registers a simulated IP phone. The test passes if the phone registration is successful.
• Dial Tone Test: Simulates an off-hook state to the Cisco Unified Communications Manager and checks for receipt of a dial tone. The test passes if it receives a dial tone signal from the Cisco Unified Communications Manager.
• End-to-End Call Test: Initiates a call to a second simulated or real IP phone. The test passes if it registers, goes off-hook, and places the call. There is a ring indication and the destination phone goes off-hook to accept the call.
Step 1. Launch and log in to the Cisco Unified Communications Manager Administration page.
Step 2. From the Cisco Unified Communications Manager Administration page, select Device > Add a New Device.
Step 3. From the Device Type drop-down menu, select Phone. Click Next.
Step 4. Select Cisco 7960 as the phone type for the simulated phone. Click Next.
Step 5. In the Phone Configuration page, enter a MAC address between 00059a3b7700 and 00059a3b8aff. The tool automatically fills in the Description field. Other required fields are the Device Pool and Button Template. Use the defaults. Click Insert.
Physical Connectivity
Logical View
Device Troubleshooting
Device Administration
Recommendations on Monitoring Important Cisco Unified Communications Manager Components with Operations Manager
Recommendations on Performance Monitoring
CPU Usage
Virtual Memory and Physical Memory Usage
Hard Disk Status and Usage
High-Temperature Condition
Number of Active Phones
Gateway Registration (MGCP)
Calls in Progress
Calls Active
Calls Attempted
Calls Completed
PRI Channels Active
Port Status (FXO, FXS)
Active Conference (Hardware/Software)
Available Conference Resources
Active Transcoding Resources
Available Bandwidth of a Location
Recommendations on Events for Notification Service
Events Associated with CPU
CpuPegging
Events Associated with Virtual Memory
LowAvailableVirtualMemory
LowSwapPartitionAvailableDiskSpace
Events Associated with Hard Disk
LogPartitionHighWaterMarkExceeded
LogPartitionLowWaterMarkExceeded
DataPhysicalDiskDown
LowAvailableDiskSpace
LowInactivePartitionAvailableDiskSpace
LowActivePartitionAvailableDiskSpace
Events Associated with High Temperature
TemperatureSensorDown
TemperatureHigh
Events Associated with Power Supply
PowerSupplyDown
Events Associated with Fan
FanDown
Database-Associated Events
DB Replication Failure
IDS Replication Failure (for Communications Manager versions 5.0, 5.1.1, and 5.1.2)
Critical Service-Associated Events
ServiceDown
Events Associated with Resource Availability
HighResourceUtilization
• MOH Multicast Resources Active Threshold
• MOH Unicast Resources Active Threshold
• MTP Resources Active Threshold
• Transcoder Resources Active Threshold
• Hardware Conference Resources Active Threshold
• Software Conference Resources Active Threshold
• Conferences Active Threshold
• Conference Streams Active Threshold
• MOH Streams Active Threshold
• MTP Streams Active Threshold
• Location Bandwidth Available Threshold
Note: You must enable polling for Voice Utilization Settings to monitor this event.
Media List Exhausted
Route List Exhausted
Events Associated with Digital Port Utilization
HighDigitPortUtilization
• BRI Channel Utilization Threshold
• T1 PRI Channel Utilization Threshold
• E1 PRI Channel Utilization Threshold
• T1 CAS Channel Utilization Threshold
Note: You must enable polling for voice utilization settings to monitor this event.
Events Associated with System Performance
Code Yellow
Core Dump File Found
Others
Hardware Failure
Number Of Registered Phones Dropped
CDR Agent Send File Failed
Cisco DRF Failure
CDR Maximum Disk Space Exceeded
ServerUnreachable
D Channel Out Of Service
Reports
Events Report
Phone Status Report
Other Phone Reports or Displays
All CTI Application Reports
Inventory Analysis
Route List Report