This document discusses a software-defined networking (SDN) approach to network traffic monitoring and visibility using and proposes the use of standard Top of Rack (TOR) switches as matrix switches. This approach uses OpenFlow along with Cisco XNC which provides new ways to use general switching devices as fully functional network traffic monitoring switches without the limitations observed in some conventional approaches that exists today.
Challenge
Ethernet networks have traditionally been built in a static way. Typically, after the system is cabled and powered, depending on size and scale, it is extremely difficult to make changes, especially without accurate and complete documentation and planning. Customization of the network has largely been an overlay, with configuration of specific device features to build, create, and maintain massively scalable Ethernet fabrics. When something in the network goes wrong and troubleshooting and monitoring become essential to the state of the business, network administrators have a number of options to choose from to help keep business functioning as usual.
Why Matrix Switches?
To understand the need for matrix switches, consider some of the methods commonly deployed in the data center to monitor network traffic and flows.
Hubs
For a long time, hubs were used for network monitoring in the Ethernet segment. The use of hubs to monitor network data traffic presents numerous fundamental problems. The most notable problem is that hubs forward all traffic on all ports to all other ports. Hubs also increase the total size of the collision domain, preventing the network from operating efficiently. In contrast, a network switch reduces this domain by learning MAC addresses connected to each physical interface and therefore can forward traffic destined for those ports respectively. The end nodes connected to the switch do not all see all traffic on other devices, and they each receive only the frames that they are intended to receive. In general, hubs also support only half-duplex and 10- and 100-Mbps transfer speeds.
Cisco Switched Port Analyzer
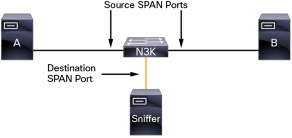
The Cisco® Switched Port Analyzer (SPAN) feature was introduced on switches to address the fundamental difference between switches and hubs. When a hub receives a packet on one port, the hub sends a copy of that packet from all ports except the one on which the hub received the packet. The switch builds a Layer 2 forwarding table on the basis of the source MAC addresses of the various packets that the switch receives. After this forwarding table is built, the switch forwards traffic destined for a MAC address directly to the corresponding port. To be able to monitor traffic on the switches, the SPAN feature is needed (Figure 1).
Figure 1. Cisco SPAN
SPAN uses the following terminology:
• Ingress traffic: Traffic that enters the switch
• Egress traffic: Traffic that leaves the switch
• Source (SPAN) port: A port that is monitored with the SPAN feature
• Source (SPAN) VLAN: A VLAN whose traffic is monitored with the SPAN feature
• Destination (SPAN) port: A port that monitors source ports, usually ports with a sniffer connected
SPAN, however, also has limitations. In most common hardware switching architectures that exist today, a single application-specific circuit (ASIC), or multiple ASICs grouped together to build a switching fabric, forward packets at the hardware level, and very little data-plane information is sent to the CPU. Even modular chassis today have adopted the distributed forwarding model; however, when the software needs to tell the hardware to duplicate and redirect packets as in the case of SPAN, that process consumes additional CPU cycles. As a result, the number of SPAN and port monitoring sessions that can be configured on the switch is limited. Number of factors affect network device performance when using SPAN:
• Process of sending packets to the CPU and forwarding them to their destinations
• Basic monitoring of the interface
• Volume of SPAN traffic (even more crucial on a 10 Gigabit Ethernet network)
Network Taps
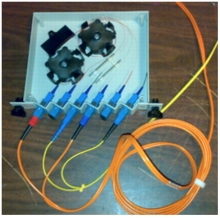
Another method of packet monitoring uses physical hardware taps. These network taps can be extremely useful in monitoring traffic because they provide direct inline access to data flowing through the network. In many cases, it is desirable for a third party to monitor the traffic between two points in the network. If the network between points A and B consists of a physical cable, a network tap may be the best way to accomplish this monitoring. The network tap has at least three ports: an A port, a B port, and a monitor port. A tap inserted between the A and B ports passes all traffic through unimpeded, but it also copies that same data to its monitor port, enabling a third party to listen (Figure 2).
Figure 2. Network Tap
Taps have a number of benefits:
• They can handle full-duplex data transmission.
• They are nonobtrusive and not detectable by the network, with no physical or logical addressing.
• Some support full inline power with the capability to build a distributed tap.
Whether you are trying to gain visibility into the server-to-server data communication at the edge or virtual edge of your network or to provide a copy of traffic to the intrusion prevention system (IPS) appliance at the Internet edge of your network, you can use network taps nearly anywhere in the environment. However, this deployment can add significant costs and operation complexities, introducing cabling challenges in a large scale environment.
The Solution: Cisco Monitor Manager
An alternative solution to help with monitoring and troubleshooting tasks in the data center is a device that is especially designated to allow the aggregation of multiple taps and that also connects to multiple monitoring systems. This solution is referred to as a matrix switch. Matrix switches link all the monitoring devices directly to specific points in the network fabric that handle the packets that need to be observed.
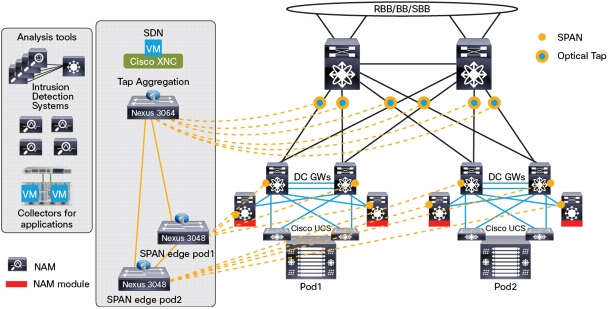
In Figure 3, the Cisco Nexus® 3000 Series Switch is connected to various points in the network at which packet monitoring is advantageous. From each network element, SPAN ports or optical taps can be used to send traffic flows directly to this matrix switch. The matrix switch itself is directly connected to all the tools used to monitor the events in the network fabric. These monitoring devices include remote monitor (RMON) probes, application firewalls, IPS devices, and packet sniffer tools.
With the Cisco Monitor Manager solution, customers have the flexibility to use more than one Cisco Nexus 3000 Series Switch connected in any topology according to the monitoring needs. Monitoring devices can also be connected to any of the Cisco Nexus 3000 Series Switches.
Figure 3. Matrix Switch Solution with Cisco Monitor Manager
Cisco Extensible Network Controller with Cisco Monitor Manager
Cisco's approach provides an alternative to the static matrix network and current solutions for network tapping and monitoring. It also introduces an SDN approach into the data center in a nonintrusive way. By using the power of OpenFlow and the Cisco Extensible Network Controller (XNC), the network administrator can dynamically program the matrix switch with a configuration that allows traffic to enter the matrix switch on a certain set of ports connected to the network elements. The administrator can also apply a number of actions, based on match criteria, when the traffic egresses the switch toward the numerous monitoring tools. After the SPAN or optical tap traffic reaches the matrix switch, the administrator can use OpenFlow and the programming capability of Cisco XNC to apply a variety of actions to the switch.
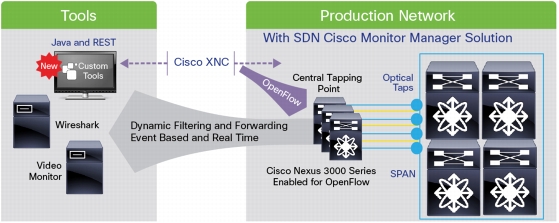
The Cisco Monitor Manager application allows one or more Cisco Nexus 3000 Series Switches enabled for OpenFlow to be combined to provide a fully functional monitoring network. When this system is coupled with the power of Cisco XNC, the end user has a fully distributed monitoring network that works as one logical device, with the capability to change the filtering and forwarding rules dynamically. Additionally, because Cisco XNC supports common programmable interfaces, network operators can write applications to detect and capture unique traffic according to administrative requirements or very specific business logic. This solution thus allows unique and important traffic patterns to flow directly to the analysis tools in real time. With the elasticity and ease of use of the complete monitoring solution, Cisco Monitor Manager and Cisco XNC can provide greater business agility through a cost-effective and scalable approach for traffic monitoring (Figure 4).
Figure 4. Cisco XNC with Cisco Monitor Manager
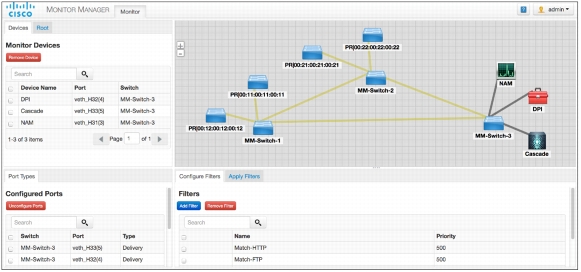
With Cisco XNC and the Cisco Monitor Manager application, administrators can perform actions such as creating filters to match specific traffic and redirect those to one or more tools. This can be achieved using GUI (Figure 5) or using REST API.
• Filter just HTTP or FTP traffic with specific destination IP address and port information.
• Replicate packets from a single input source port to multiple egress ports where tools are connected.
• Tag traffic that matches a filter criteria with a specific VLAN ID for easy service identification.
All these features can be very attractive to organizations that have or require some type of monitoring solution today. As the size and scale of these enterprises grow, more SPAN ports and more taps will be required. Consequently, the matrix switch packet monitoring use case has been gaining popularity as the industry realizes its elasticity and its potential savings in time, money and resources as a solution for observing network traffic.
Figure 5. Cisco Monitor Manager Interface
Today, with the current general availability release version of the Cisco XNC and the Cisco Monitor Manager application, you can build a solution that addresses scalability requirements and that can be cost effective compared to traditional approaches.
Features of the Cisco SDN Solution with Cisco XNC and Cisco Monitor Manager
Table 1 presents the main features of Cisco XNC with Cisco Monitor Manager.
Table 1. Cisco Monitor Manager Features
Cisco XNC with Cisco Monitor Manager Network Application Features
Functional Area
Feature Description
Configuration
GUI
Cisco XNC with the Monitor Manager application provides a web-based GUI for management of all configurations and functions. The GUI provides access features, including:
• Topology and device management and assignment of port type
• Mapping of the ports to the end monitoring or analysis tools
• Configuration of filters to match traffic according to business needs
• Set up of traffic flows from network edge ports to tool delivery ports
• Event logging and troubleshooting
• RBAC user and role management
Northbound API
The Cisco XNC and Monitor Manager REST-based API provides access to all functions that can be performed through the GUI.
Traffic Delivery (Basic)
One-to-one connection
Establish a one-to-one connection from an edge network port to a tool delivery port across the network with no oversubscription.
One-to-many connection
Establish a one-to-many connection from an edge network port to multiple tool delivery ports.
Many-to-one connection
Establish a many-to-one connection from multiple edge network ports to a single tool delivery port.
Combination
One-to-one, one-to-many, and many-to-one connections can be established for different flows at the same time in the same monitored network.
Port-speed adaptation
One-to-one, one-to-many, and many-to-one connections can be established between ports with different speeds. For instance, a 40-Gbps port can deliver traffic to a 10-Gbps tool port to allow use of traditional tools over high-speed production networks interfaces.
Failure resiliency
In the event of path failure, each flow is automatically rerouted to an alternative path by the controller. If rerouting is not possible, an event is logged.
Traffic Delivery (Advanced)
Packet filtering
Traffic forwarding is based on the full flow specification, allowing detailed traffic filtering to limit the traffic to the delivery port to just what is strictly necessary.
VLAN tag rewrite
The original VLAN tag can be changed from the edge port to the delivery port either through the filter mechanism or by tagging at the edge port.
VLAN tag insertion
An additional VLAN tag can be added to the original packet to be delivered, to allow a tool to identify the origin of the traffic.
Network Design
Multilevel design
Cisco XNC with the Cisco Monitor Manager application can support multiple Cisco Nexus 3000 Series Switches connected in any topology. Analysis and monitoring devices can be connected anywhere in the topology. Typical tapping network architectures are:
• Two- or three-level networks (edge, distribution layer [optional], and core) in which the delivery ports are connected to the core switches
• Nonblocking leaf-and-spine architectures, in which both the edge and the delivery ports are connected to the leaf switches
Port-type assignment
Ports must be designated as edge tap or SPAN (input) or delivery (output) ports to be used for configuring network connections. This feature, in combination with RBAC, increases network security.
Inter-Switch Links (ISLs)
Ports that connecting switches are self-discovered and do not require additional type configuration. ISLs can use individual ports or PortChannels.
Load balancing
Data paths are evenly spread across available equal-cost links.
Loop prevention
Built-in logic prevents creation of network loops. This feature supports one-to-one, one-to-many, many-to-one, and many-to-many connection policies.
Scalability
Cisco XNC supports a large-scale monitoring network. Monitor Manager with Cisco XNC can support up to 40 switches and 2000 edge and delivery ports per instance.
High availability
Cisco XNC supports high availability through active-active clustering. In Cisco XNC Release 1.0, up to five instances can be part of the same cluster.
Security and Operations
Role-based access control (RBAC)
Each individual port can be exclusively assigned to one or more user groups.
Logging
Cisco XNC provides system logs as well as user audit logs. In addition, it supports different logging levels depending on system needs.
Path rerouting to guarantee delivery
If traffic is critical, data loss can impair compliance. In this case, if a failure occurs, the data flow is automatically rerouted using alternate network path to prevent data loss and to meet compliance requirements.
Cisco Monitor Manager Components
Cisco XNC and Cisco Monitor Manager application
Minimum system requirements:
• 64-bit Linux operating system (Fedora/Ubuntu/Redhat)
• 8 GB of RAM, 6-core CPU, and 40 GB of free space in the partition in which the controller will be installed