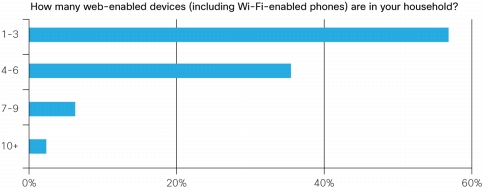
• Forty-three percent of U.S. homes have four or more online devices, up from 32 percent over the last 18 months
• Forty-two percent of broadband users do not know their downstream speed; 54 percent do not know their upstream speed
• Thirty-eight percent have contacted their Internet provider and 26 percent have had a technician visit due to "slow" connection issues
• Most slow connection issues remain unresolved or go away without a clear understanding of the original cause
• Forty-three percent have experienced an Internet outage at least once a month and 17 percent at least once a week
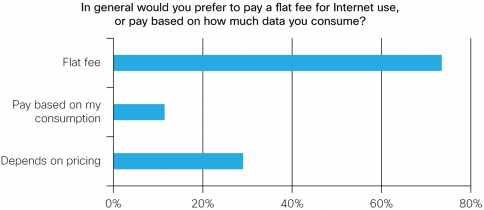
• Flat-fee broadband plans are heavily preferred; only 7 percent prefer usage-based billing
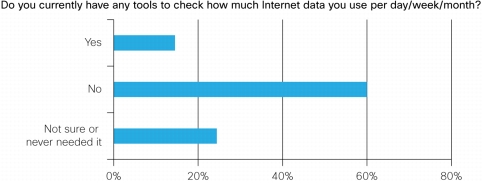
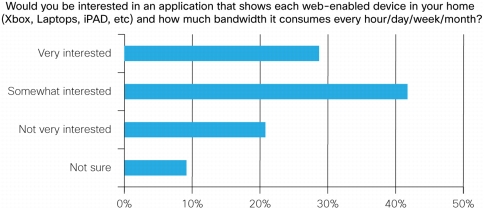
• Less than 14 percent have access to tools to check data consumption. More than 70 percent are interested in having access to such tools
Introduction
The rapid growth of Internet-connected devices in the home is changing the way broadband services are consumed. In the past 18 months, the percentage of households with four or more devices accessing the web increased from 32 to 43 percent. At the same time, the amount of bandwidth consumption per home is growing and is expected to grow to four times the current amount by 2015. The growth in mobile smartphones and tablets represents the fastest growing sector of connected devices, and offloading data traffic to WiFi networks is further driving the growth of home networking.
This increased utilization across multiple devices creates a new set of challenges for broadband providers. First, it increases the cost to set up and support these more complex home networks, compared to the traditional "one PC" home. Second, it creates contention within the home network for a shared resource - the broadband pipe. Finally, it increases overall demand for bandwidth, which in turn adds core capacity cost to the service provider.
The Cisco Prime™ Home application and device management platform1 was brought to the market to address issues related to the first problem, specifically the experience of setting up, maintaining, and adding valued applications to the managed home network, and is in widespread deployment today. This white paper will address the second problem of perceived performance and bandwidth contention, and will touch on the service providers' response to the third issue - usage-based billing and bandwidth caps.
Methodology
The Bandwidth Consumption and Broadband Reliability study was conducted by Portable Insights through an online, 31-question survey of 402 random participants across the country. Several thousand candidates were screened in order to get a balance of demographics and to help ensure that each candidate met the minimum requirements of having broadband service to his or her home and an influence on purchasing decisions in the household.
Key Topics
The Bandwidth Consumption and Broadband Reliability research addressed three focus areas:
• Consumer response to performance issues such as speed and outages
• Troubleshooting performance and potential cost reductions using new support tools
• Acceptance of usage-based billing models and consumer impact
Connected Home Trends
In past studies, Cisco established trends relating to devices in the home and willingness to pay for value-added applications. This study reviewed the key metrics illustrated in Figures 1 through 4.
Figure 1. The Number Of Homes with Four or More Online Devices (The Last Three Categories Combined) Has Grown to 43 Percent, Up from 32 Percent When Last Surveyed in May 2010
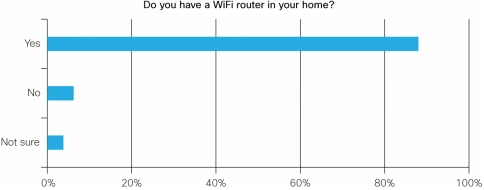
Figure 2. Most Broadband Users Now Have a Router in Their Home. Previous Surveys Established That About Half Are Purchased at Retail and the Other Half Are Provided by Their ISP
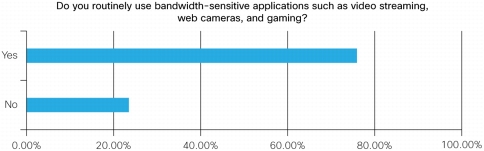
Figure 3. The Trend Toward Higher-Bandwidth Internet Traffic Is Not Surprising, and Is Supported by Other Recent Studies
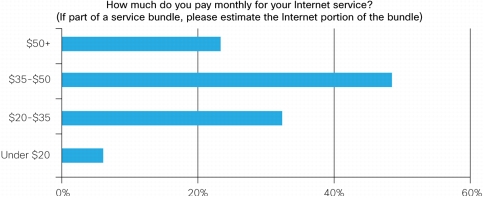
Figure 4. Broadband Service Is Still a $20-50 Monthly Investment for Most Americans
Speed and Performance
The Bandwidth Consumption and Broadband Reliability study investigated a common issue in the connected home, the perceived "slow connection." As streaming content and real-time applications become more common in the home, users have a higher sensitivity toward intermittent connectivity, poor video quality, and generally slow connection issues. This section reveals the current state of these issues for the typical broadband user.
Average Downstream and Upstream Speeds
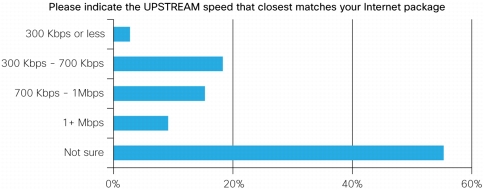
The distribution of downstream and upstream speeds across all respondents is not surprising; however, the largest response was in the "not sure" category. This may have an impact on the ability to market new speed tiers and relieve contention amongst devices in the home network. See Figures 4 and 5.
Figure 5. Forty-Two Percent Are Unsure of Their Downstream Speed
Figure 6. Fifty-Four Percent Are Unsure of Their Upstream Speed
Speed Test
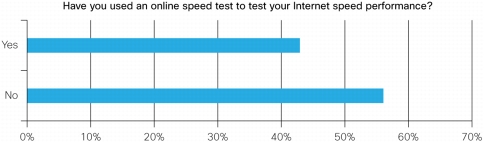
Many consumers use online speed tests to validate their expected service package. The data points illustrated in Figures 7, 8, and 9 look at how speed test results can affect perception.
Figure 7. Forty-Three Percent Have Used an Online Speed Test to Test Their Internet Speed
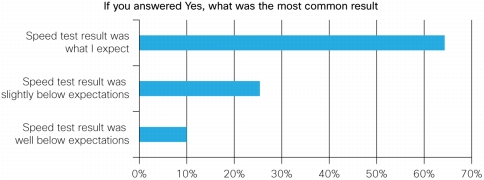
Figure 8. Most of the Time The Speed Test Results Meet Expectations, But 25 Percent of the Time Results Are Below, and 10 Percent of the Time Results Are Well Below Expectations
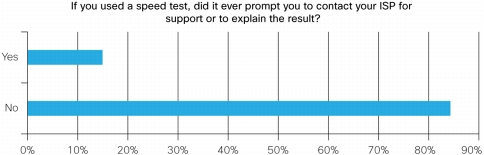
Figure 9. Fifteen Percent of Users Have Called Their ISP Based on a Speed Test Result. Better Education and Clarity on Speed and Performance Expectations Could Present Savings for the Service Provider
Slow Connections
Users often experience a perceived slowness with their broadband connection, though are unsure what to attribute it to and how to resolve the problem. The series of data points illustrated in Figures 10 through 14 focus on these problems and potential for improvement.
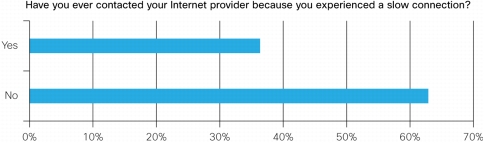
Figure 10. Thirty-Eight Percent of Users Have Called Their Internet Provider Due to a Perceived Slowness of Their Internet Connection, Regardless of the Cause
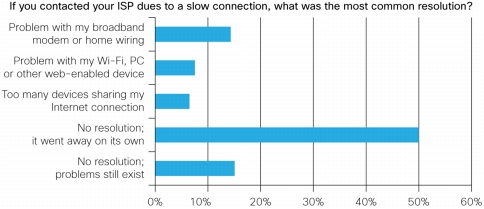
Figure 11. There's No Clear Leading Cause of Slowness Issues, and Half of the Time the Cause Is Never Determined. Surprisingly 17 Percent Report That Problems Still Exist, Which Could Be Due to Any of the Other Listed Causes
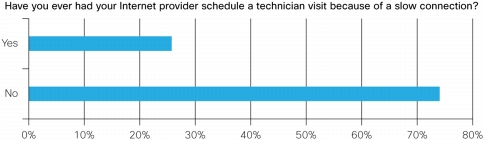
Figure 12. Twenty-Six Percent of Broadband Users Have Had a Technician Visit Them Due to Slow Connection Issues. Considering the Cost for a "Truck Roll" and the Average Revenue per User, This Presents a Significant Financial Impact for Service Providers
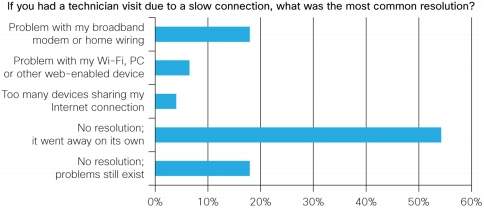
Figure 13. In Cases Where a Technician Was Dispatched to Fix Slowness Issues, the Distribution of Causes Is Very Similar. Partly This Is Due to a Number of the Calls Referenced in Figure 8 Resulting in Technician Visits, So the Results Are Somewhat Duplicated. However It Is Shown That Even Having a Technician Onsite Does Not Result in a Clear Understanding of Perceived Slowness
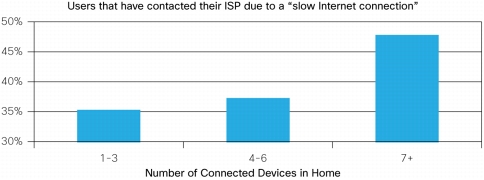
Figure 14. By Cross-Referencing Responses, It Is Shown That the Number of Devices in the Home Is an Indicator of Likelihood to Experience Slow Connection Issues. As the Number of Devices Increases in the Future, Slow Connection Issues Will Increase
Internet Service Outages
Frequency of Outages
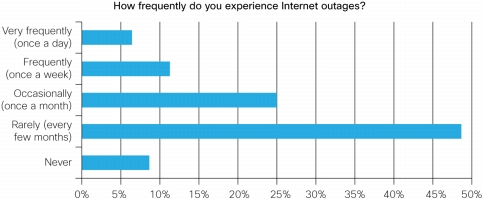
Cisco found that 7 percent of broadband users deal with daily outages, 11 percent weekly, and 25 percent monthly. Since respondents were asked to indicate only one frequency, the combined daily/weekly/month rate means that 43 percent of all broadband users deal with outages at least once a month. See Figure 15.
Figure 15. Seven Percent of Survey Respondents Experience Daily Outages, 11 Percent Weekly, and 25 Percent Monthly. Combined, 43 Percent Experience Outages at Least Monthly
Dealing with Outages
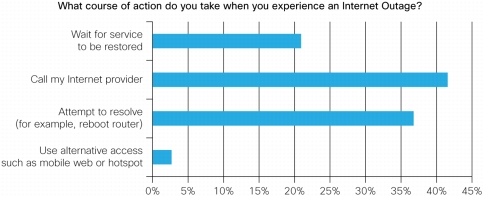
When faced with an outage, users react in a variety of ways. Most likely it results in a call to the service provider. Using mobile broadband or shared hotspots remains a seldom-used alternative to restoring service. See Figure 16.
Figure 16. When Experiencing an Outage, 21 Percent of Survey Respondents Wait for Service to Be Restored, 41 Percent Call Their Provider, and 36 Percent Attempt to Resolve It on Their Own. Only 2 Percent Resort to an Alternative Means of Internet Access
Churn Impact
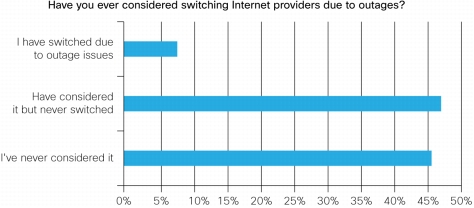
Internet outages are a contributing factor to churn; however, it does not appear to be the only factor. With 46 percent having considered switching due to outages, service providers should continue work in reducing and effectively communicating outage situations. See Figure 17.
Figure 17. Seven Percent Have Switched Service Providers Due to Internet Outages. Forty-Seven Percent Have Considered It But Not Switched, and 45 Percent Have Not Considered It
Consumption-Based Billing and Usage Monitoring
Many service providers have implemented broadband usage caps, and others have moved or are in the process of moving toward a usage-based billing model. The Bandwidth Consumption and Broadband Reliability study covers the consumer impact of such a model. See Figures 18 through 22.
Figure 18. Generally Speaking, Broadband Users Are Clearly Comfortable in a Flat-Fee Model
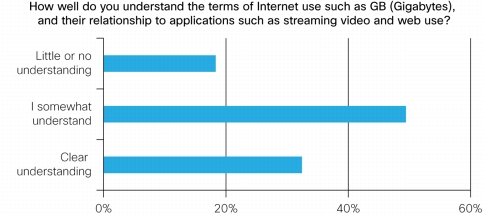
Figure 19. Without a Clear Understanding of the Terms of Measurement (That Is, Cell Phone Minutes), Managing Consumption and Understanding Contention Issues Will Be a Challenge. This Data Indicates That Most Users to Not Have a Clear Understanding
Figure 20. Most Broadband Users Do Not Have Access to Tools to Help Manage Internet Usage, or If They Do, Do Not Know How to Use Them
Figure 21. There Is Clearly Demand for Tools That Help Enable Consumers to See The Bandwidth Usage in Their Home, Both in the Aggregate and for Each Individual Device. Such Tools Can Help Understand Monthly Consumption, and Also Troubleshoot Bandwidth Contention Issues Within the Home Network
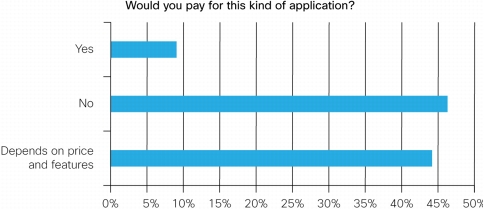
Figure 22. Generally Speaking, Such Tools Could Potentially Be Monetized As Consumer Apps, Though They Are More Likely to Be Accepted and Used As Part of the Internet Service
Conclusions
The Bandwidth Consumption and Broadband Reliability study reveals some interesting trends and new challenges emerging in the home network. Some general conclusions can be drawn from this data:
• The home network continues to grow in complexity, with more devices consuming richer applications
• This growth creates resource contention with in the home, which drives support calls and technician truck rolls
• Consumers generally do not have ways to understand and resolve issues on their own, nor can they track and manage their broadband consumption
The changing landscape of consumer devices, applications, and content delivery will no doubt continue to put pressure on service providers to deliver reliable service. Combining this with the desire to move toward a usage-based billing model would seem to indicate the need for better consumer education and support tools beyond what is currently available. Cisco believes that service providers should embrace technologies that promote a better understanding of consumption, contention, and performance for the end user. The result will be a better overall experience for the broadband user, and a reduced operational cost for the providers.
Appendix
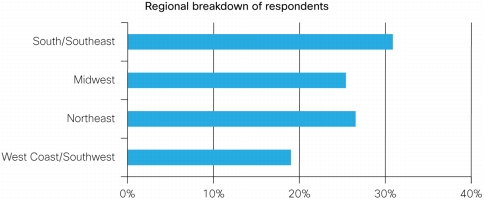
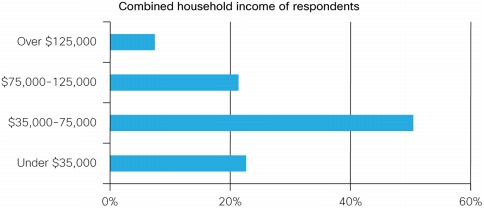
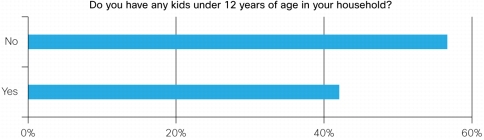
Demographic Distribution
Below are the Cisco survey demographics:
1The Cisco Prime Home solution was formerly ClearAccess ClearVision. ClearAccess was acquired by Cisco in May 2012. The research referred to in this document was commissioned by ClearAccess in support of the original product.