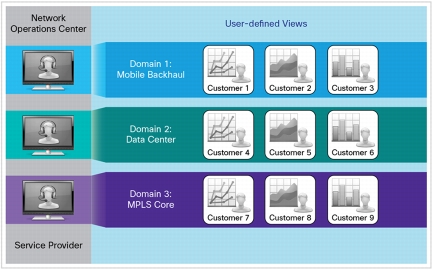
Cisco Prime™ Performance Manager provides the ability for operators (referred to as users throughout this document) to define and organize any combination of network performance data in the form of graphs, charts, and other formats. It allows users to customize their views to quickly identify and communicate network performance issues to a particular group of customers. The general concept of this capability is illustrated in Figure 1.
Figure 1. User-Defined Views General Concept
A simple use case for this capability would be as follows:
A small telco owns some fiber in the ground and sells some capacity to a big wireless service provider to backhaul traffic from its cell towers to the mobile switching centers. Through user-defined views, the small telco can offer its wireless customers access to data that are specific to their network segment only.
Technical Overview
A User-Defined View Example
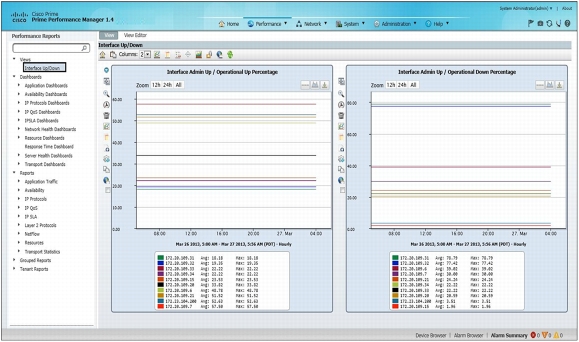
Operators can take any of the nearly 12,000 graphs in Cisco Prime Performance Manager and arrange them into a view of their choice. Each graph can be set to a specific level and data filter. An example of a customized and filtered view could consist of the following:
• Top 10 interface utilization graphs for all Gigabit Ethernet interfaces in the network
• Device names starting with <device name> and interface aliases starting with <customer name>
• Interface utilization greater than 50 percent
• Last 7 days of 5-minute samples
• Stacked column graph
The operator can save the view and can reference it at any time for the latest statistics. See Figure 2.
Figure 2. A User-Defined View Example
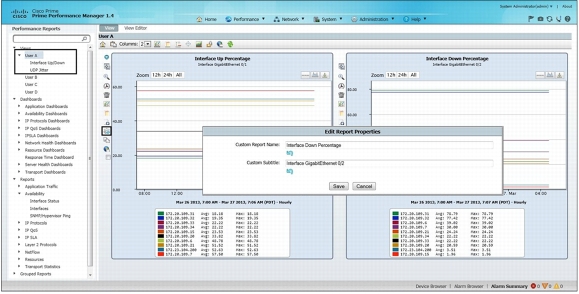
Arranging and Organizing User-Defined Views
Users can create and arrange views in a paradigm similar to email folders. Depending on the specific need, users can create folders and nest them in a hierarchy. Users can copy and paste the graphs into the views, move and position them between views, and reorder them. Views can also be easily labeled and organized as illustrated in Figure 3.
Figure 3. Organizing Views
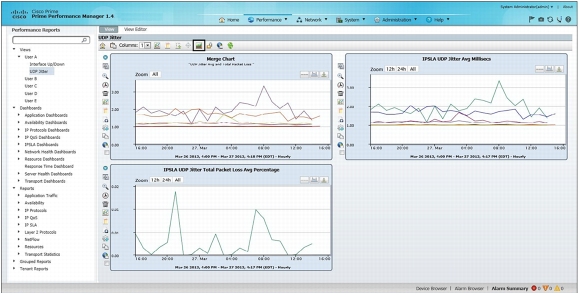
Merging Graphs and Comparative Metrics
Users can merge data from two or more graphs into a single graph. This is used to perform comparisons across multiple metrics for the same time periods. For example, a user might want to see if there was a spike in utilization at the same time the number of user sessions spiked. This kind of information is valuable when assessing the association between the data sources and their impact on the network performance. See Figure 4.
Users can also view long-term performance trends by comparing graphs for the same specific metric over various time periods, such as hourly, daily, weekly, and monthly.
Figure 4. Merged Graphs
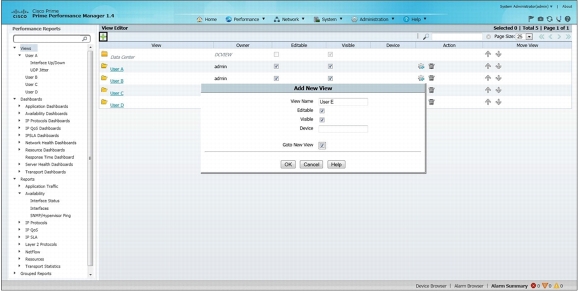
View Settings and Accessibility
Views provide a flexible method of organizing the performance data that is used regularly or that has been configured for a specific use with filters in the way that best meets the needs. Each user can create as many views as needed to support efficient data monitoring. The user views are stored on the gateway and can be viewed based on the setting defined by the user. Views can be set to be private, public, or group. See Figure 5.
You can also include a specific device in the view. To search for a device, begin typing the device name in the field, which opens a list of matching results from which you can select the device that you want. Then you can select the check box to open the view immediately. When you add a device to the view during setup, the view automatically includes access to all of the data for that device, such as device details, events and alarms, and device reports and dashboards.
Figure 5. View Settings
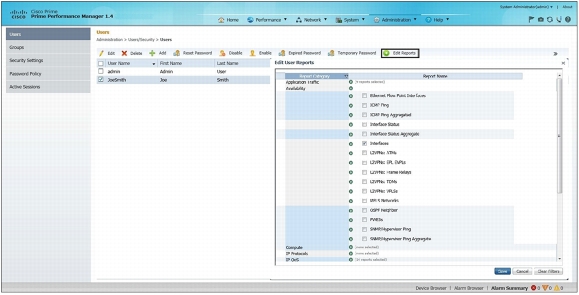
Extended Capabilities
Cisco Prime Performance Manager today allows network operations center (NOC) administrators to define report category and data filters and make them accessible to specific users. Anytime a user logs in, the user will only be able to see certain report categories and only certain filtered data in that category of reports.
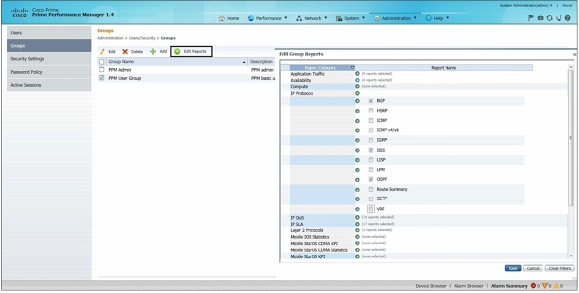
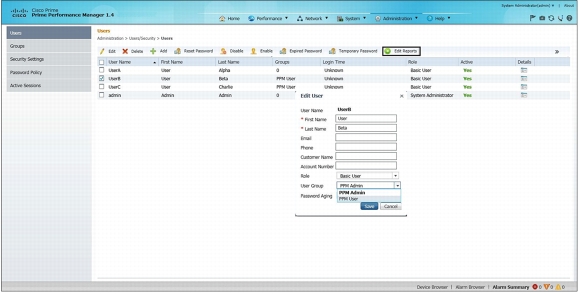
NOC administrators can create a "customer-facing portal," which includes:
• Creation of user groups
• Ability to edit user groups (for example, remove or add specific users)
• Ability to apply report categories and data filters to a particular user group
• Linkage of user views to user groups with the following choice of settings for Views and Edits:
Visible:
– Private - Viewable only by creator or level 5 admins
– Public - Viewable by any user
– Group - Viewable only by users who are members of a specific user group or list of user groups
Editable:
– Private - Editable only by creator or level 5 admins
– Public - Editable by any user
– Group - Editable only by users who are members of a specific user group or list of user groups
Refer to Figures 6-8 for snapshots of reports, user groups, and user information.