Contents
Installation and Configuration of the Data Center NAM
Configuring the SPAN Data Source
Configuring NetFlow Export on the Remote Branch Router (Optional)
Configuring NetFlow on Cisco IOS Routers
Configuring the NetFlow Data Source on the NAM
Configuring NetFlow Reports on the NAM
Using SPAN and NetFlow to Identify Business-Critical Applications
Creating a Baseline of Application Performance
Real-Time Reports for Evaluating Application Performance
Historical Reports for Evaluating Application Performance
Configuring Response Time Reports for Impact Analysis
Configuring Conversation Throughput Reports for Impact Analysis
Configuring NAM-WAAS Integration
Configuring WAAS to Send Flow Information to NAM
Configuring the WAAS Data Source in NAM
Configuring WAAS Monitored Servers in NAM
Configuring Response Time Reports for WAAS Impact Analysis
Configuring Conversation Throughput Reports for WAAS Impact Analysis
Generating WAAS Before and After Reports
Abstract
Figure 1. Cisco NAM Provides End-to-End Application Performance Visibility in WAAS Environments
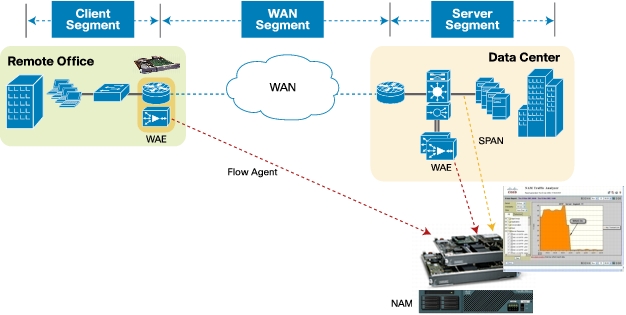
Note: The details of WAAS installation, setup, and testing are not covered in this document.
Installation and Configuration of the Data Center NAM
Initial NAM Configuration
1. Log in or session to the NAM using root as the username and root as the password.
2. Enter the following commands to enable IP access:
3. Connect to the NAM IP address using a web browser and log in using the web username and password you have selected.
4. Go to Setup > Preferences and change the Data Displayed in value to Bits.
Configuring the SPAN Data Source
1. Click Setup > Data Sources > SPAN > Create
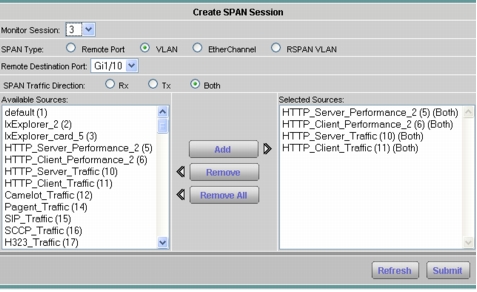
Select the appropriate SPAN type, SPAN destination, SPAN direction, and available SPAN sources (Figures 2 and 3).
Figure 2. Creating a SPAN Session on the NAM-2-250S
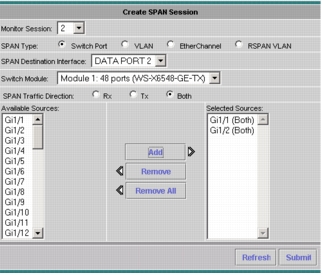
Note: On the NAM appliance the SPAN destination will be the port on the managed device that is connected to the NAM appliance.
Figure 3. Creating a SPAN Session on the NAM 2200 Series Appliance
2. Click Setup > Monitor and make sure that Core Monitoring and Response Time Monitoring are selected for the SPAN data source (Figures 4 and 5).
Figure 4. Setting Up Core Monitoring Functions
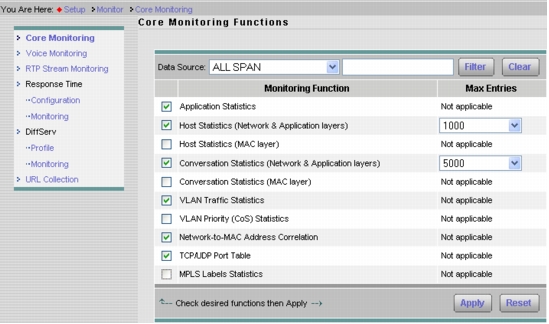
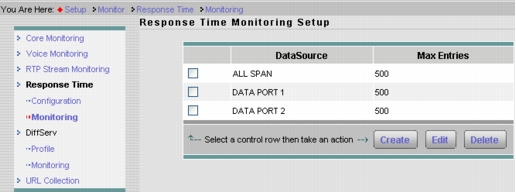
Figure 5. Setting Up Response Time Monitoring
3. You can now go to Monitor > Overview and other monitor screens to analyze the SPAN session's traffic to the NAM. We will cover this in greater detail later in the guide.
Configuring NetFlow Export on the Remote Branch Router (Optional)
Configuring NetFlow on Cisco IOS Routers
Note: The User Datagram Protocol (UDP) port number must be set at 3000.
Configuring the NetFlow Data Source on the NAM
1. From Setup > Data Sources > NetFlow > Listening Mode, click Start (Figure 6).
Figure 6. NetFlow Listening Mode
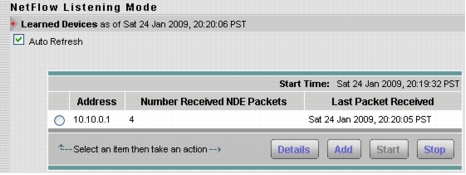
2. When you see the IP address or addresses, select and add the device or devices, and provide the SNMP read community string. Checking the Create Data Source check box will create a NetFlow data source for that device with an aggregate of flows received from all NetFlow-enabled interfaces.
3. Test for connectivity and the SNMP community string from Setup > Data Sources > NetFlow > Devices, then click Test.
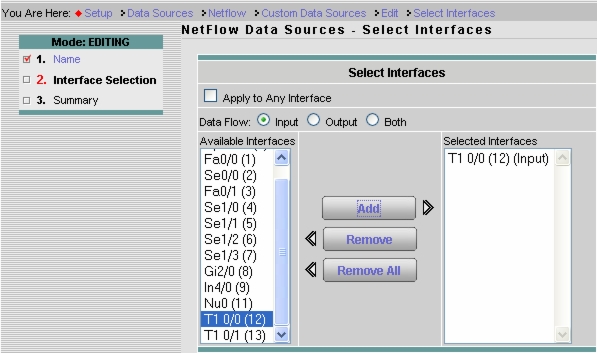
4. To add a custom data source with just selected interfaces, select Setup > Data Sources > NetFlow > Custom Data Sources. Select a NetFlow device, provide a name, and click Next. Add the WAN interface to monitor in this data source (Figure 7), click Next, review the settings, and click Finish.
Figure 7. Selecting the WAN Interface for NetFlow Monitoring
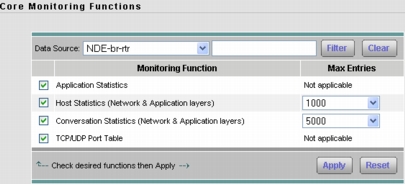
5. Next, go to Setup > Monitor > Core Monitoring and select the desired data sources with a prefix NDE as the NetFlow data source and enable the collections (Figure 8).
Figure 8. Enable Collections on the Desired Data Sources with a Prefix NDE
Configuring NetFlow Reports on the NAM
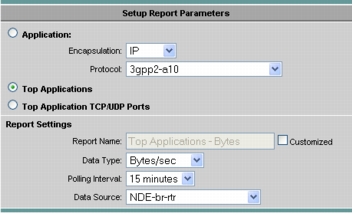
1. Click Reports > Basic Reports > Create.
2. Select Applications and click Next.
3. Select Top Applications and the NetFlow data source and click Finish (Figure 9).
Figure 9. Setting Up the Top Applications Report
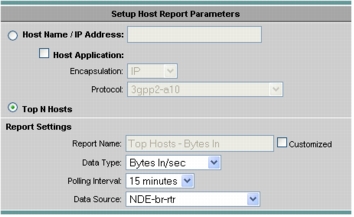
4. Select Create again.
5. Select Hosts and click Next.
6. Select Top N Hosts and the NetFlow data source and click Finish (Figure 10).
Figure 10. Setting Up the Top N Hosts Report
Using SPAN and NetFlow to Identify Business-Critical Applications
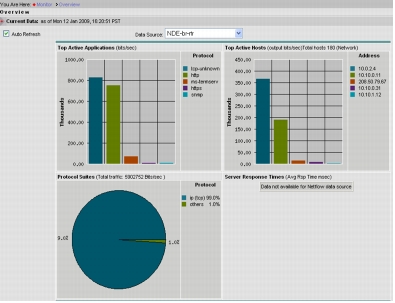
1. Select Monitor > Overview and select the NetFlow (NDE) data source. This will provide a real-time view into the top active applications and top active hosts (Figure 11).
Figure 11. The Overview Provides a Real-Time View of the Top Active Applications and Top Active Hosts
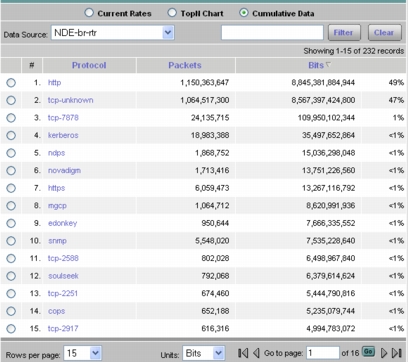
2. Select Monitor > Apps and select the NetFlow (NDE) data source. This will provide visibility into the top applications and the current rates. Selecting the Cumulative Data radio button will show the top applications and the cumulative data for those applications and the percentage of network traffic made up by each application (Figure 12).
Figure 12. Cumulative Data for the Top Applications
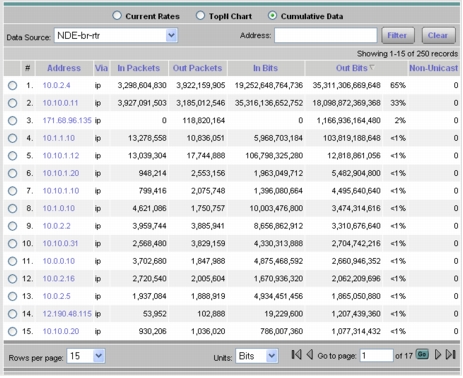
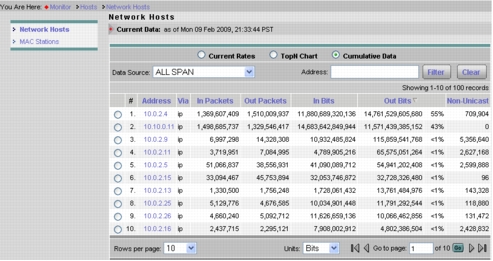
3. Select Monitor > Hosts and select the NetFlow (NDE) data source. This will provide visibility into the top hosts and the current rates. Selecting the Cumulative Data radio button will show the top hosts and the cumulative data for those hosts and the percentage of network traffic used by each host (Figure 13).
Figure 13. Cumulative Data for the Top Hosts
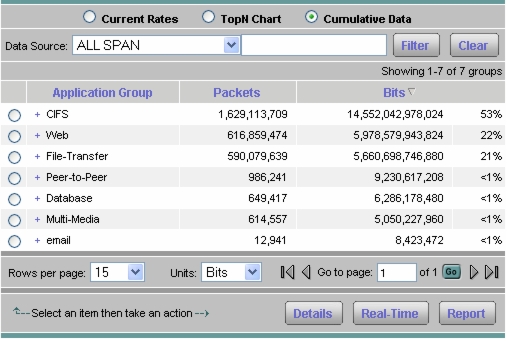
4. Select Monitor > Apps > Application Group and select the Cumulative Data radio button (Figure 14).
Figure 14. Cumulative Data for Application Groups
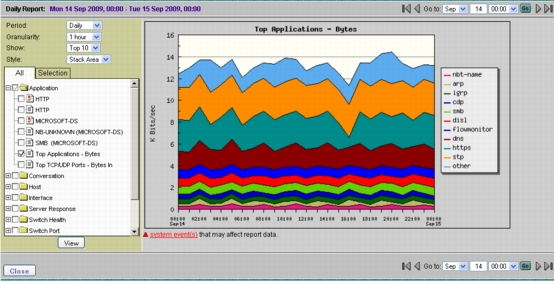
5. Select Report > Basic Reports and select the Top Applications report for the NDE data source (Figure 15). This will provide visibility into trending of the top applications' rates over time. The same can be done to view the top host rates over time by selecting the Top Hosts report.
Figure 15. Trending of the Top Applications' Rates Over Time
Creating a Baseline of Application Performance
Real-Time Reports for Evaluating Application Performance
1. Click Monitor > Response Time > Server Response Time. You can now filter on the specific server for which you are looking to baseline the application performance. This will provide the aggregate view for a particular server and application as observed from the SPAN traffic on the data center switch (Figure 16).
Figure 16. Server Response Time
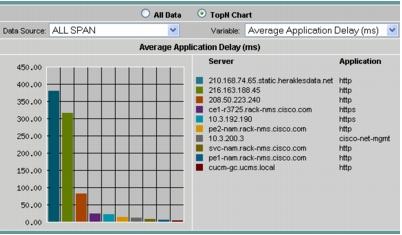
2. Select the Top N radio button and select Average Application Delay from the drop-down list. This will provide insights into which servers are most heavily loaded and have the maximum average latency (Figure 17).
Figure 17. Average Application Delay Shows Which Servers Are Most Heavily Loaded
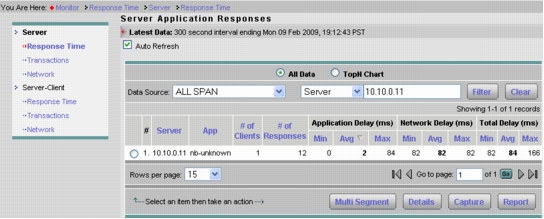
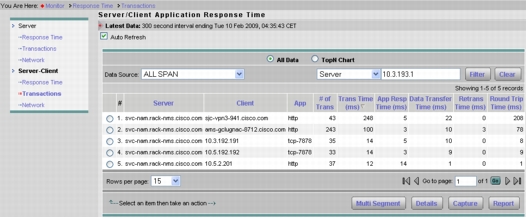
3. Now select Monitor > Response Time > Server-Client Transactions. You can again filter on the Server IP address. This will help us identify which sites are experiencing poor performance and where WAN optimization would yield the maximum benefits (Figure 18).
Figure 18. The Server/Client Application Response Time
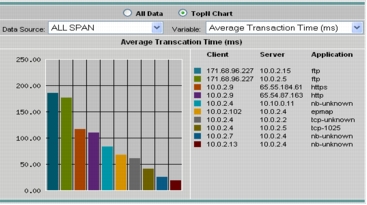
4. Select the Top N radio button and select Average Transaction Time from the drop-down list to view the chart that can provide insights into which site (client) is experiencing poor transaction time for which application (Figure 19).
Figure 19. The Average Transaction Time Report
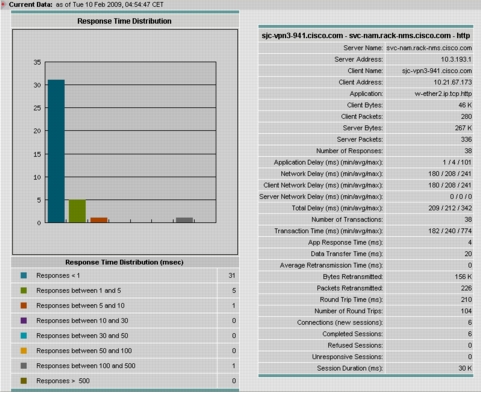
5. Click the All Data radio button and select the server, client, and application you want to baseline and click Details. This provides about 45 different metrics related to the server and a test client at a target branch related to the chosen application (Figure 20). Average transaction time is a good indication of the end-user experience and should be recorded.
Figure 20. Metrics Related to the Selected Server, Client Pair
6. We can also determine the bandwidth usage per host by selecting Monitor > Hosts and selecting the Cumulative Data radio button (Figure 21).
Figure 21. Bandwidth Usage per Host
Note: The host view can provide traffic volume values that are larger than those reported by the WAE. As an example, if the server serves UDP and TCP traffic, and only TCP is being monitored by WAEs, the host report would include also the UDP traffic. Selecting a host and clicking Details will show the application distribution for that host.
Historical Reports for Evaluating Application Performance
1. Go to Monitor > Response Time > Server-Client Response Time. Select the server, client, and application you want to baseline and click Report. This starts a historical report for the average application delay, average client network delay, and average server network delay. Let the report run for a period of 24 hours, so we can understand the performance trend over the course of a day.
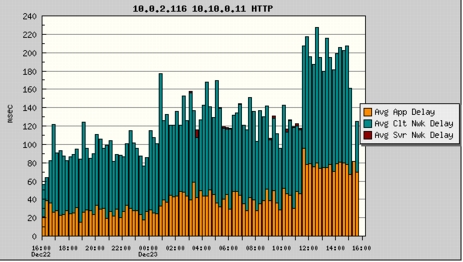
2. Select Reports > Basic Reports. Select the Avg App Delay, Avg Clt Nwk Delay, and Avg Svr Nwk Delay reports and click View. Set the style to Stack Bar (Figure 22).
Figure 22. Report of Average Delay for Application, Client Side Network, and Server Side Network
Configuring Response Time Reports for Impact Analysis
1. Click Reports > Basic Reports.
2. Click Create and select Response Time.
3. Enter the application information for the optimized application as well as the server and test client (in the branch).
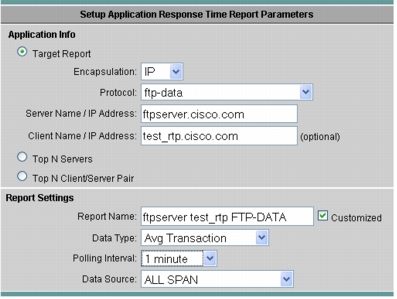
4. Select Avg Transaction as the Data Type and select ALL SPAN as the Data Source (where this traffic is seen), and set the appropriate Polling Interval. This can be as low as 1 minute. See Figure 23.
Figure 23. Setting Up the Application Response Time Report
Configuring Conversation Throughput Reports for Impact Analysis
1. Click Reports > Basic Reports.
2. Click Create and select Conversations.
3. Enter the host names for the IP server and the IP client and, if needed, the application information.
4. Select Bit/Sec as the Data Type, set the appropriate polling interval (as low as 1 minute), and select SPAN as the Data Source.
5. From Reports > Basic Reports, you can check multiple reports and then select View to provide a composite report.
Configuring NAM-WAAS Integration
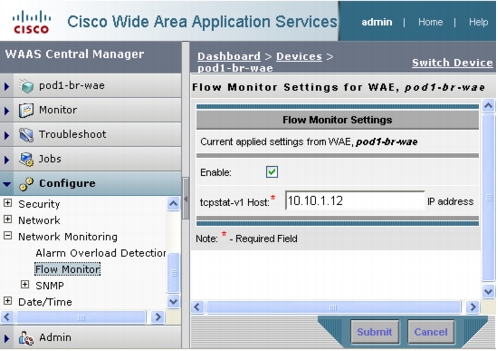
Configuring WAAS to Send Flow Information to NAM
Figure 24. Enabling Flow Monitoring with the WAAS GUI
Configuring the WAAS Data Source in NAM
1. Log in to the NAM GUI.
2. Click Setup > Data Sources.
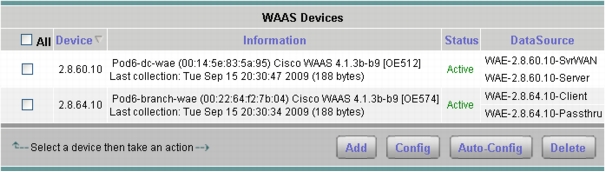
3. From the contents menu, choose WAAS -- Devices.
4. Choose the WAAS device you want to modify, then click Config (Figure 24).
Figure 25. Configuring a WAAS Data Sources
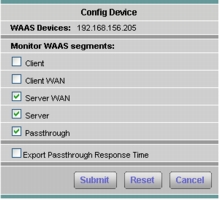
5. You can configure WAAS to monitor the following WAAS segments or WAAS data sources (data collection points):
• Client: This setting configures the WAE device to export the original (LAN side) TCP flows from/to the clients to NAM for monitoring. Set this on the branch side WAE.
• Client WAN: This setting configures the WAE device to export the optimized (WAN side) TCP flows originated from its clients to NAM for monitoring. Set this on the branch side WAE if the NAM is located close to the branch.
• Server WAN: This setting configures the WAE device to export the optimized (WAN side) TCP flows from its servers to NAM for monitoring. Set this on the Core WAE if the NAM is close to the data center.
• Server: This setting configures the WAE device to export the original (LAN side) TCP flows from/to the servers to NAM for monitoring. Set this on the core WAE.
• Passthrough: Set this on the branch side or core WAE if you wish to gain visibility into passthrough flows.
6. With NAM in the data center (NAM-2 or the NAM 2200 appliance), configure the following (see figure 26):
Branch WAE data source: Client, Passthrough
Core WAE data source: Server, ServerWAN
Note: SPAN data sources might take the place of the server data source. For example, if you already configured SPAN to monitor the server LAN traffic, it is not necessary to enable the server data source on the WAE device.
Figure 26. WAAS Data Sources
7. Click Setup > Monitor and make sure that Core Monitoring and Response Time Monitoring are selected for the WAE data source.
Note: The status will remain Pending until the monitored servers are configured (as described in the next section) and the NAM starts receiving the flows from the WAE.
Configuring WAAS Monitored Servers in NAM
1. Click Setup > Data Sources.
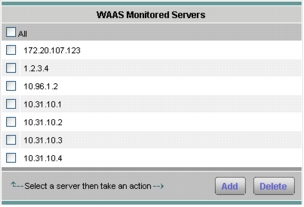
2. From the contents menu, choose WAAS > Monitored Servers (Figure 27).
3. Click Add and enter the test server IP address in the Server Address field.
Figure 27. Adding a WAAS Monitored Server Address
Configuring Response Time Reports for WAAS Impact Analysis
1. Click Reports > Basic Reports.
2. Click Create and select Response Time.
3. Enter the application information for the application and the server.
4. Select Avg. Transaction as the Data Type and select WAE-<BranchWAE-IP>-Client as the Data Source. The Polling Interval can be set as low as 1 minute.
5. From Reports > Basic Reports, check multiple reports and then select View to provide a composite report.
Configuring Conversation Throughput Reports for WAAS Impact Analysis
1. Click Reports > Basic Reports.
2. Click Create and select Conversations.
3. Enter the host names for the IP server and the IP client and if needed the application information.
4. Select Bits/Sec as the Data Type, set the appropriate polling interval (which could be as low as 1 minute), and select WAE-<CoreWAE-IP>-ServerWAN as the Data Source.
5. Now repeat the above steps and select WAE-<BranchWAE-IP>-Client as the Data Source.
6. From Reports > Basic Reports, you can check multiple reports and then select View to provide a composite report.
Generating WAAS Before and After Reports
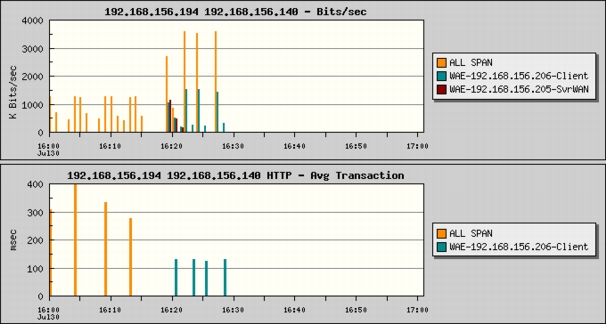
1. Click Reports > Basic Reports and select the Avg Transaction report for the same server, client, and application from the SPAN data source in the data center (Orange) created in the "Configuring Response Time Reports for Impact Analysis" section and from the WAE client data source from the branch (Blue) created in the "Configuring Response Time Reports for WAAS Impact Analysis" section and click View. Set the style to Bar Chart. This will bring up the composite report indicating the average transaction time reduction, which is an indication of the end-user experience improvement (Figure 28).
Figure 28. A Composite Report Showing Average Transaction Time Reduction
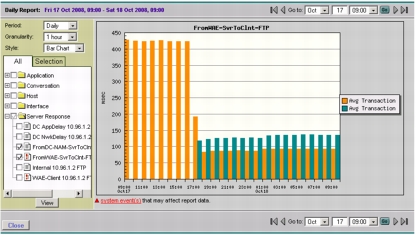
Note: The average transaction time before WAAS was ~430 ms. After WAAS is enabled, the WAE client data source starts up and the average transaction time has dropped to ~120 ms.
2. Select Reports > Basic Reports and select the Conversation - Bytes report created in the "Configuring Response Time Reports for Impact Analysis" and "Configuring Conversion Throughput Reports for WAAS Impact Analysis" sections. You can also select the Avg Transaction reports created for SPAN and WAE client data sources for the same server-client pair. Click View. Chose the Bar Chart style (Figure 29).
Figure 29. Transaction Reports for SPAN and WAE Client Data Sources
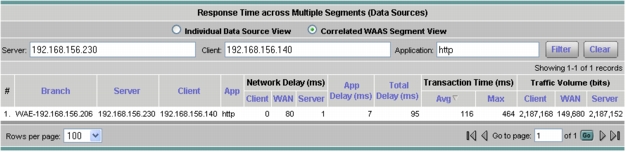
3. Click Monitor > Response Time. Under Server-Client, select the conversation and click Multi Segment. This report will show the network delay introduced by the three segments; you can check the data redundancy elimination (DRE) effects by looking at the traffic volume values (Figure 30).
Figure 30. Response Time Across Multiple Segments
Summary