Feedback
Table Of Contents
Load Servers Used in Large-Deployment Scenario
Load Servers Used in Medium-Deployment Scenario
Large-Deployment Network I/O Test Results
Medium-Deployment Network I/O Test Results
Large-Deployment Disk I/O Test Results
Medium-Deployment Disk I/O Test Results
Performance Test Information
This appendix contains the following sections:
Test Scenarios
Revised April 2, 2009Load testing was conducted against sample large-scale and medium-scale virtualized Cisco Unity deployments. Characteristics of network I/O and disk I/O are provided to aid design of the host infrastructure for Cisco Unity virtual machines.
Network I/O was collected for a period of 5 minutes with the Cisco Network Analysis Module.
Disk I/O was collected for a period of 10 minutes with the VMware vscsiStats utility. VMware vscsiStats is a disk I/O workload characterization utility that presents results in histogram format on a per-vDisk basis. (VMware provides additional details on vscsiStats on its website—search for the document Easy and Efficient Disk I/O Workload Characterization in VMware ESX Server; the filename is iiswc_2007_distribute.pdf.)
The Cisco Unity server had the following macro traces turned on: Call Flow Diagnostics; Call Control (MIU) Traces-For TAPI Systems (only the TAPI subtrace was on); and Skinny TSP Traces. The diagnostics at these levels caused an increase in the disk I/O, which is reflected in the test results provided. These diagnostic traces represent a typical level of diagnostics for troubleshooting but do not represent the maximum possible set of diagnostic traces.
Load Servers Used in Large-Deployment Scenario
•
Four Bomber XP call generators. Bomber XP, a Cisco load-generation tool, was configured to apply the standard load associated with a 144-port configuration.
•
•
Load Servers Used in Medium-Deployment Scenario
Added April 2, 2009•
•
•
Network Layout
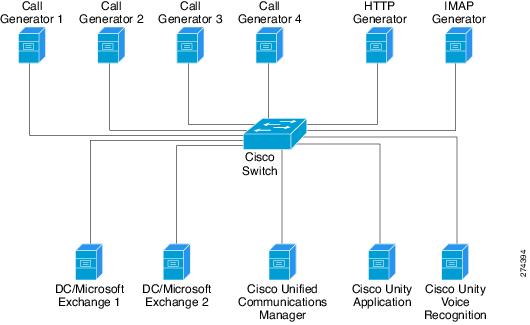
Revised April 2, 2009Figure A-1 shows the network layout used for the large-deployment scenario; the network layout for the medium-deployment scenario was basically the same, except that only the Exchange 1 server was used.
Figure A-1 Network Layout
Disk Layouts
Revised April 2, 2009The following disk layouts were used:
Cisco Unity Application Server
•
•
•
•
Exchange 1 and Exchange 2 Servers
•
•
•
•
NoteCisco Unity Voice-Recognition Server
•
Network I/O Test Results
The following sections detail the network I/O test results:
•
•
Large-Deployment Network I/O Test Results
Revised April 2, 2009Table A-1 shows the traffic generated among the servers in a typical large virtualized Cisco Unity deployment.
Medium-Deployment Network I/O Test Results
Added April 2, 2009Table A-2 shows the traffic generated among the servers in a typical medium virtualized Cisco Unity deployment.
Disk I/O Test Results
The following sections detail the disk I/O test results:
•
•
Large-Deployment Disk I/O Test Results
Revised April 2, 2009Table A-3 shows a high-level overview of the disk I/O test results in a typical large virtualized Cisco Unity deployment.
For the full output of large-deployment disk I/O test results provided by the VMware vscsiStats utility, see the document on the Cisco Unity Tools website at http://www.ciscounitytools.com/Documents/Virtualization/VirtualUnityLargeScenario-DiskIO.xls.
Table A-3 Overview of Disk I/O Test Results—Large Deployment
as Percentage of
Total IOPS
Percent RatioCisco Unity Disk 1
37
4096 at 43%
2 / 98
Cisco Unity Disk 2
72
65536 at 66%
45 / 55
Cisco Unity Disk 3
56
512 at 48%
4 / 96
Cisco Unity Disk 4
7
8192 at 89%
63 / 37
Exchange DC1 Disk 1
5
4096 at 73%
64 / 36
Exchange DC1 Disk 2
4
4096 at 62%
0 / 100
Exchange DC1 Disk 3
32
512 at 56%
0 / 100
Exchange DC1 Disk 4
489
4096 at 80%
58 / 42
Exchange DC2 Disk 1
2
4096 at 57%
2 / 98
Exchange DC2 Disk 2
4
4096 at 59%
0 / 100
Exchange DC2 Disk 3
16
512 at 59%
0 / 100
Exchange DC2 Disk 4
88
4096 at 74%
49 / 51
Cisco Unity Voice-Recognition Disk
2
4096 at 58%
0 / 100
1 I/O operations per second.
Medium-Deployment Disk I/O Test Results
Added April 2, 2009Table A-4 shows a high-level overview of the disk I/O test results in a typical medium virtualized Cisco Unity deployment.
For the full output of medium-deployment disk I/O test results provided by the VMware vscsiStats utility, see the document on the Cisco Unity Tools website at http://www.ciscounitytools.com/Documents/Virtualization/VirtualUnityMediumScenario-DiskIO.xls.
Table A-4 Overview of Disk I/O Test Results—Medium Deployment
as Percentage of
Total IOPS
Percent RatioCisco Unity Disk 1
31
4096 at 49%
0 / 100
Cisco Unity Disk 2
16
65536 at 44%
33 / 66
Cisco Unity Disk 3
37
4096 at 43%
2 / 98
Cisco Unity Disk 4
1
8192 at 91%
59 / 41
Exchange DC1 Disk 1
4
4096 at 74%
58 / 42
Exchange DC1 Disk 2
1
4096 at 96%
0 / 100
Exchange DC1 Disk 3
19
512 at 63%
0 / 100
Exchange DC1 Disk 4
280
4096 at 80%
64 / 36
Cisco Unity Voice-Recognition Disk
2
4096 at 59%
0 / 100
1 I/O operations per second.
Voice Quality Comparison
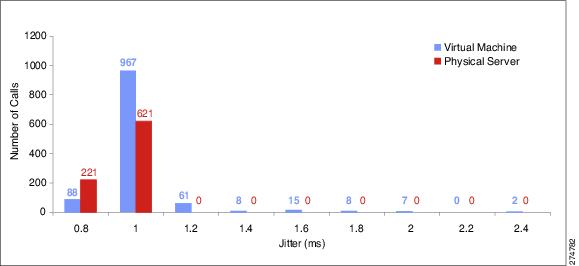
Added April 2, 2009Figure A-2 and Figure A-3 show the mean and maximum jitter statistics gathered from a Cisco Unity virtual machine and a Cisco Unity physical server, captured under a 144-port load for 5 minutes.
The Cisco Unity virtual machine shows more jitter than the Cisco Unity physical server. However, the amount of jitter is within the range typically buffered by endpoints, such as IP phones and gateways.
Figure A-2 Mean Jitter Statistics
Figure A-3 Maximum Jitter Statistics