Table Of Contents
MPLS-Based VPN MAN Testing and Validation
Test Topology
Test Plan
Baseline MPLS VPN
Security
QoS
Data
Voice
Multicast
MPLS Network Convergence
Convergence Test Results
Core IGP—EIGRP
Core Protocol—OSPF
MPLS-Based VPN MAN Testing and Validation
Test Topology
The test topology was designed to encompass the most common elements of a typical MAN network: data centers and different-sized campuses (small, medium, and large). For this phase of the testing, an entire network consists of full-rate GE interfaces.
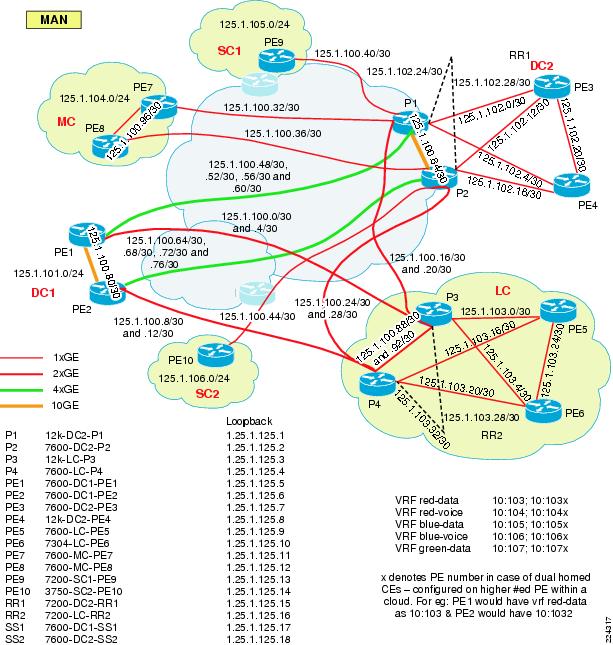
Figure 7-1 shows the MPLS MAN core (P, PE, and connectivity between them).
Figure 7-1 MPLS MAN Core Topology
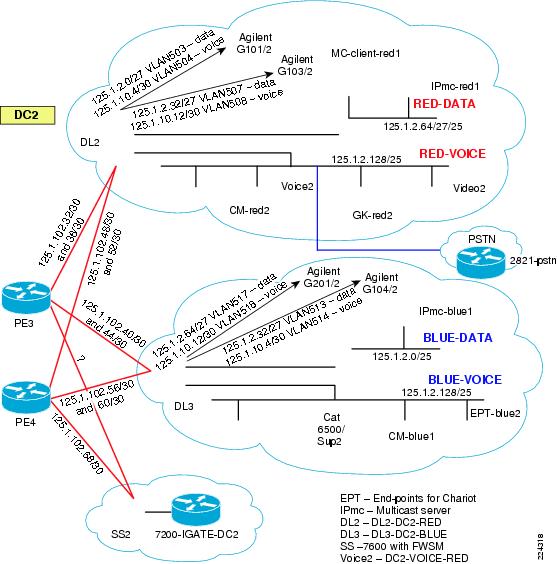
Figure 7-2 shows one of the data centers (DC2), which is a representative example of the rest of the network.
Figure 7-2 Representative Data Center (DC2)
Some of the key features of the test bed are:
•
Roles based testing—Multiple platforms for various roles (P, PE, RR, and CE, as shown in Table 7-1).
•
End-to-end redundancy—Links, processors, functional routers, and so on.
•
Individual as well as integrated system-level testing of the features—Features were classified under two broad categories: network services such as QoS, high availability, and security; and enterprise services such as voice, multicast, and data applications (see Table 7-2).
The overall intent of the testing was to validate and demonstrate the working of enterprise services over an MPLS VPN-based MAN and to provide best practices in terms of network services configuration.
Table 7-1 Test Platforms and Roles
Platform
|
Role
|
SW Version
|
LC—Core facing*
|
LC—Edge facing*
|
RP
|
Cisco 12000
|
P
|
12.0(31)S
|
EPA-GE/FE-BBRD
EPA-3GE-SX/LH-LC
(E4+)
|
EPA-GE/FE-BBRD
EPA-3GE-SX/LH-LC
(E4+)
|
PRP-1
|
Cisco 12000
|
PE
|
12.0(31)S
|
EPA-GE/FE-BBRD
EPA-3GE-SX/LH-LC
(E4+)
|
4GE-SFP-LC
(E3)
|
PRP-2
|
Cisco 7600
|
P
|
12.2(18)SXE2
|
WS-X6724-SFP
|
WS-X6724-SFP
|
Sup720-3BXL
|
Cisco 7600
|
PE
|
12.2(18)SXE2
|
WS-X6724-SFP
|
WS-X6724-SFP
|
Sup72-3BXL
|
Cisco 7200
|
PE
|
12.2(25)S5
|
Built-in
|
Built-in
|
NPE-G1
|
Catalyst 3750 ME
|
PE
|
12.2(25)EY2
|
Built-in
|
Built-in
|
N/A
|
Cisco 7304
|
PE
|
12.2(25)S5
|
SPA-2GE-7304
|
SPA-2GE-7304
|
NSE-100
|
Catalyst 6500
|
CE/DL
|
12.2(18)SXE2/SXE1
|
6408A/6416
|
6408A/6416
|
Sup720/Sup2
|
Cisco 7200
|
RR
|
12.0(30)S1
|
PA-GE
|
PA-GE
|
NPE-400
|
Table 7-2 Testing Features
Baseline Architecture
|
Function
|
MPLS, LDP, IGP, and so on
|
MPLS as transport
|
Baseline MPLS-VPN
|
VPNs for segmentation in the MAN
|
Network Services
|
|
QoS
|
Provide QoS profile/classification/implementation guidance for the MAN
|
Security (FW/NAT/ACLs and so on)
|
Security for shared services and Internet
|
HA (TE, FRR, Fast IGP)
|
|
Management
|
ISC 4.0 for provisioning and management
|
End-to-End Services
|
|
Voice
|
Verify that the existing overlay architecture works
|
Multicast
|
Demonstrate mVPN implementation in MAN along with its integration with existing multicast architecture
|
Data center traffic
|
Verify that the standard traffic profiles/parameters are supportable
|
Competitive Tests
|
|
M10i
|
System tested as a PE
|
The following are additional details of the test topology:
•
Segmentation was assumed to based on traffic type. Thus there were two organizations (red and blue) with both data and voice VRF, and one organization (green) with data-only VRF.
•
For every organization, voice and data had a separate VLAN.
•
In the case of red and blue organizations, the distribution layer (DL) switches were configured with VRF-lite to extend the traffic separation into the campus/data center. The green DLs did not have VRF-lite.
•
Red was configured to use OSPF for PE-CE protocol, while blue and green were set up to use EIGRP.
•
Shared services gateways were set up that could be configured in redundant, non-redundant, or load balancing modes, depending on the application(s) being shared.
•
Out-of-band access was provided for every device in the MAN for management purposes.
Test Plan
Although all the services were tested as a system, they each had a focused test plan as well. This section discusses some of the high level details.
Note
The focus of the testing was not to test scale/performance of the services but to validate them as an end-to-end, system-level proof-of-concept.
Baseline MPLS VPN
The baseline MPLS VPN was set up to demonstrate:
•
IGP variations in the MAN core—Usage and differences in EIGRP versus OSPF as the core IGP
•
IGP variations at the MAN edge—Usage and differences in EIGRP versus OSPF as the core IGP
•
Multipath configuration and implications within the VPN for VRF routes
•
Multipath configuration and implications within the MAN core for PE-to-PE reachability routes
•
Route reflector-based MP-iBGP meshing (including redundancy)
•
End-to-end traffic convergence with and without tuning (IGP and BGP)
•
Cisco Express Forwarding load-balancing in situations with multiple back-to-back links
Security
The purpose of the security testing was to demonstrate the integration of MPLS VPNs and shared services and access to these services through virtual firewalls. Security testing in the MPLS MAN focused on the following areas:
•
Common services area routing—Routing mechanism that allows the VPNs to communicate with the common services area and among themselves.
•
Dual Internet access—Redundant Internet access was provided to optimize the use of the MAN, which was achieved in the two following ways:
–
Equal cost MAN—Injects two equal cost default routes into the MAN with the routing protocol choosing one route over another, depending on the distance to the exit point in the MAN.
–
Engineered exit points—Leverages the capabilities of MP-iBGP to selectively exchange default routes between VRFs to engineer the exit point based on the location.
•
Centralized Services: Centralized services were divided into two kinds:
–
Shared services:
–
Protected services—Protected services are to be accessed through the firewalls connected to the shared services routers.
–
Unprotected services—Access to non-firewalled segments by route imports/exports.
–
Dedicated (per-VPN) Services: Services such as DHCP were deployed separately for each VPN.
QoS
Because this phase used full-rate GE within a wholly-owned enterprise MAN, only queueing was implemented. Other requirements such as shaping (in the case of sub-rate GE) will be addressed in future phases.
End-to-end QoS was implemented (CE-to-CE) with the following objectives:
•
Testing whether the 8-class model (11 classes within the data center/campus mapped to 8 classes within MAN) can be maintained within the MAN (especially on GSR).
•
Ensuring that the traffic is queued according to the configured trust parameter (dscp, cos, exp) at each egress queue.
•
Ensuring that priority traffic such as real-time gets prioritized over other classes of traffic in case of congestion without affecting delay or jitter.
•
Testing QoS characteristics with real applications (voice calls, multicast server/clients) rather than to simply test tools such as Agilent.
Overall, the network had a large amount of redundancy/load-sharing built-in using high bandwidth links; thus the PE-CE link was considered the ideal test point for creating bottlenecks. Other than basic validation in the core, the focus was on the PE-CE link across various PE platforms.
Data
For this phase of testing, the real value-add did not require simulating actual data applications and thus a test tool such as Agilent was considered sufficient. Agilent was configured to generate traffic flows (multiple source/destination pairs; typically 254x254 flows for each class of service) for both data as well as voice VRFs. The traffic flows were separated based on the different classes of service that were expected to be seen in the core and the correct DSCP values were set. Although the major focus of the testing was on voice, data traffic was ideal for measuring packet losses and for varying the link usage rates.
Voice
Phase 1.0 tested the following three deployment models:
•
Clustering over the MAN
•
Centralized call processing with SRST
•
Multi-site distributed call processing
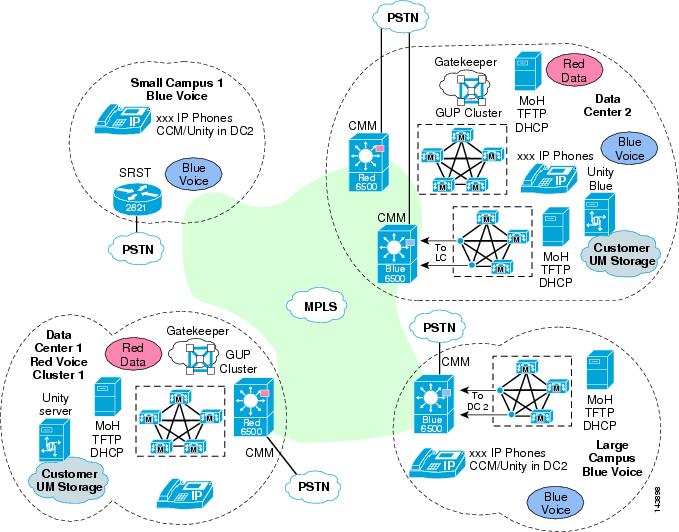
In addition, solution test areas included end-to-end functionality, local and centralized Cisco Unity messaging, stress, load, QoS, redundancy, reliability, usability, availability, music on hold, fax, endpoint configuration, and TFTP downloads for upgrades. The intention of stress testing the network was not to validate the limits on individual components of the solution but to validate that the solution remains stable over an extended period of time while subjected to call scenarios expected in real-life deployments. Figure 7-3 shows an overall view of the voice components.
Figure 7-3 Voice Components
Following is a listing of the major products and features tested:
•
CCM 4.1(3)sr1
•
Unity 4.0(4)
•
Catalyst CMM and Cisco IOS-based gateways
•
Conferencing
•
VG248 gateway
•
SRST
•
Fax relay, fax pass-through
•
QoS
•
Connection Admission Control (CAC)
•
DHCP configuration
•
TFTP
•
Multicast music on hold
•
Extension mobility
Because of equipment and time constraints, Phase 1.0 testing did not include following features (which are targets for Phase 2 testing):
•
Contact Center applications
•
IP Communicator
•
VT Advantage and video conferencing
•
Attendant console
•
Inter-VPN voice connectivity
Multicast
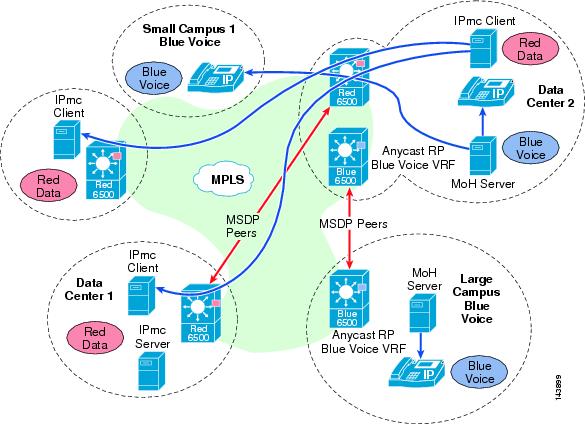
Figure 7-4 shows the multicast test setup.
Figure 7-4 Multicast Test Setup
The multicast test setup had the following highlights:
•
Anycast RP was used to ensure that the closest RP was selected within the network.
•
The RPs were peered using MSDP within each VRF.
•
mVPN was used within the MPLS network to natively forward the multicast traffic (non-MPLS switched).
•
Agilent behaved as sender/receiver of multicast traffic, enabling the creation of multiple streams.
•
An actual streaming video multicast from a server to multiple clients.
•
The clients were set up locally within the same Layer 2 network as the server as well as across the MPLS network to visually compare any degradation that may occur across the network across various traffic rates.
MPLS Network Convergence
Except for possibly multicast, none of the other applications should have a dependency on the MPLS network. Thus while the application architectures may not change much, their dependency on two critical network needs becomes even more important: end-to-end QoS treatment and network convergence.
As already discussed, QoS focused on CoS, queuing, and prioritization. Convergence testing focused on ensuring end-to-end convergence of the traffic with minimal/no packet loss. Both EIGRP and OSPF were used as the core IGP and PE-CE protocols. The tests were done to measure both up and down convergence and were performed in two phases: an untuned network (default timers) and a tuned network (BGP and IGP timers tuned for faster convergence). The purpose was to present two extreme proof points based on which a customer network can be tuned to achieve the desired level of convergence.
Convergence Test Results
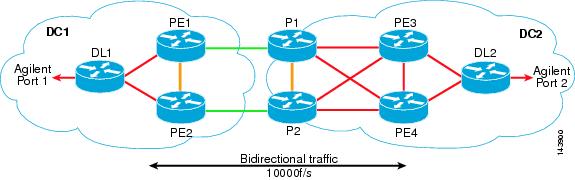
The network topology shown in Figure 7-5 was used to test the various failure scenarios.
Figure 7-5 Convergence Test Topology
Note
For all the test results, A/B means traffic received on Port1/Port2 of Agilent.
The purpose of the convergence tests was to capture end-to-end traffic convergence in case of various failure scenarios. The failure scenarios were:
•
PE-CE link failure (PE3-DL2)
•
P-PE link failure (P1-PE3)
•
PE failure (PE3)
•
P failure (P1)
The tests were conducted by shut/no shut of links and reloading the appropriate routers depending on the test. Three iterations were done for each failure scenario and the max bidirectional traffic times reported. Any packet loss greater then 5% of the traffic sent was recorded. The tests were also classified based on the core IGP protocol being used—EIGRP or OSPF; PE-CE protocol being used—EIGRP or OSPF; and Routing protocol state—untuned or tuned.
The tuning configruation template used for each of the protocols was:
•
BGP—The focus was to tweak the import scanner, the nexthop check scanner and the advertisment intreval on the PEs as well as RR.
neighbor 125.1.125.15 advertisement-interval 1
neighbor 125.1.125.16 advertisement-interval 1
Next hop event based tracking feature is not currently supported on Cisco 7600.
•
OSPF—The focus was to improve the dead neighbor detection, LSA generation, and the SPT calcuations.
router ospf 1 vrf red-data
timers throttle lsa all 0 20 5000
timers throttle spf 24 24 5000
Optionally if you have a multipoint/broadcast interface, sub-second hellos can be enabled by the command ip ospf dead-interval minimal hello-multiplier <3-20>. This sets the number of hellos sent per second. The dead intreval is always 4 times the hello intreval.
•
EIGRP—No tuning is required.
Note
MPLS VPN NSF/SSO is not currently supported on 12xxx or 7600 and hence was not tested. TE-FRR will be tested in the next phase of the solution as well.
The results of these tests are presented below. Within each iteration, the x/y format represents the bidirectional traffic convergence numbers—x for traffic from port2 to port1 (right to left in the figure) and y for traffic from port1 to port2 of agilent (left to right in the figure).
Some observations:
•
Because multipath was turned on, any packet loss observed was restricted to the traffic flowing the failure link or router.
•
Overall the up convergence (routers/links coming up) reported no packet losses in most scenarios.
•
In most failover scenarios even with the tuned protocols, the BGP import scanner is the deciding factor (minimum of 5 sec).
•
Since all the failures were emulated in DC1, in most cases traffic y took the largest amount of time. For example, in case of PE3 failure, traffic from PE1 had to reconverge and forwarded via PE2 since no other direct link to DC2 existed.
•
P down convergence was much faster with OSPF then EIGRP.
•
Overall P failure demonstrated the highest traffic times and percentage of packet losses. An additional link between PE1 and P2 would have most likely helped improve the convergence times.
Core IGP—EIGRP
Table 7-3 PE-CE Protocol—OSPF Untuned
Scenario
|
|
T1 (s) (port1/port2)
|
T2 (s) (port1/port2)
|
T3 (s) (port1/port2)
|
Max time for bidirectional conv (s)
|
Max % packet loss (port1/port2)
|
PE3-DL2 failure
|
|
|
|
|
|
|
|
down
|
2/18
|
2/18
|
2/18
|
18
|
25%/50%
|
|
up
|
0
|
0
|
0
|
0
|
0%
|
P1-PE3 failure
|
|
|
|
|
|
|
|
down
|
9/2
|
6/2
|
5/3
|
9
|
25%/10%
|
|
up
|
0/2
|
0/2
|
0/25ms
|
2
|
0%/5%
|
PE3 failure
|
|
|
|
|
|
|
|
down
|
3/10
|
3/9
|
4/8
|
10
|
10%/50%
|
|
up
|
0
|
0
|
0
|
0
|
0%
|
P1 failure
|
|
|
|
|
|
|
|
down
|
19/19
|
19/22
|
20/23
|
23
|
50%/40%
|
|
up
|
34/32
|
28/29
|
5/9
|
34
|
30%/30%
|
Table 7-4 PE-CE Protocol—OSPF Tuned
Scenario
|
|
T1 (s) (port1/port2)
|
T2 (s) (port1/port2)
|
T3 (s) (port1/port2)
|
Max time for bidirectional conv (s)
|
Max % packet loss (port1/port2)
|
PE3-DL2 failure
|
|
|
|
|
|
|
|
down
|
2/9
|
2/9
|
2/9
|
9
|
20%/50%
|
|
up
|
0
|
0
|
0
|
0
|
0%
|
P1-PE3 failure
|
|
|
|
|
|
|
|
down
|
6/3
|
6/3
|
4/2
|
6
|
25%/10%
|
|
up
|
0
|
0
|
0
|
0
|
0%
|
PE3 failure
|
|
|
|
|
|
|
|
down
|
0/5
|
0/7
|
0/6
|
7
|
0%/35%
|
|
up
|
0
|
0
|
0
|
0
|
0%
|
P1 failure
|
|
|
|
|
|
|
|
down
|
17/23
|
20/22
|
18/21
|
23
|
50%/40%
|
|
up
|
5/7
|
2/8
|
900ms/10
|
10
|
25%/25%
|
Table 7-5 PE-CE Protocol—EIGRP Untuned
Scenario
|
|
T1 (s) (port1/port2)
|
T2 (s) (port1/port2)
|
T3 (s) (port1/port2)
|
Max time for bidirectional conv (s)
|
Max % packet loss (port1/port2)
|
PE3-DL2 failure
|
|
|
|
|
|
|
|
down
|
2/11
|
3/12
|
2/12
|
12
|
30%/50%
|
|
up
|
0
|
0
|
0
|
0
|
0%
|
P1-PE3 failure
|
|
|
|
|
|
|
|
down
|
5/3
|
5/2
|
4/3
|
5
|
25%/10%
|
|
up
|
0/2
|
0
|
0
|
2
|
0/5%
|
PE3 failure
|
|
|
|
|
|
|
|
down
|
3/6
|
2/4
|
3/5
|
6
|
15%/35%
|
|
up
|
0
|
0
|
0
|
0
|
0%
|
P1 failure
|
|
|
|
|
|
|
|
down
|
18/22
|
16/23
|
10/21
|
23
|
15%/50%
|
|
up
|
5/8
|
0/13
|
0/9
|
13
|
5%/25%
|
Table 7-6 PE-CE Protocol—EIGRP Tuned
Scenario
|
|
T1 (s) (port1/port2)
|
T2 (s) (port1/port2)
|
T3 (s) (port1/port2)
|
Max time for bidirectional conv (s)
|
Max % packet loss (port1/port2)
|
PE3-DL2 failure
|
|
|
|
|
|
|
|
down
|
3/11
|
5/3
|
2/10
|
11
|
25%/50%
|
|
up
|
0
|
0/4
|
0
|
0
|
0%/20%
|
P1-PE3 failure
|
|
|
|
|
|
|
|
down
|
5/5
|
4/3
|
5/3
|
5
|
25%/25%
|
|
up
|
4/2
|
0/4
|
0/2
|
4
|
15%/10%
|
PE3 failure
|
|
|
|
|
|
|
|
down
|
2/6
|
3/5
|
3/5
|
6
|
15%/40%
|
|
up
|
0
|
0
|
0
|
0
|
0%
|
P1 failure
|
|
|
|
|
|
|
|
down
|
20/21
|
20/22
|
19/21
|
22
|
50%/50%
|
|
up
|
4/9
|
4/10
|
3/10
|
10
|
10%/25%
|
Core Protocol—OSPF
Table 7-7 PE-CE Protocol—OSPF Untuned
Scenario
|
|
T1 (s) (port1/port2)
|
T2 (s) (port1/port2)
|
T3 (s) (port1/port2)
|
Max time for bidirectional conv (s)
|
Max % packet loss (port1/port2)
|
PE3-DL2 failure
|
|
|
|
|
|
|
|
down
|
3/12
|
3/12
|
3/12
|
12
|
30%/50%
|
|
up
|
0
|
0
|
0
|
0
|
0%
|
P1-PE3 failure
|
|
|
|
|
|
|
|
down
|
8/8
|
8/7
|
9/8
|
9
|
25%/25%
|
|
up
|
0
|
0
|
0
|
0
|
0%
|
PE3 failure
|
|
|
|
|
|
|
|
down
|
0/6
|
0/5
|
0/4
|
6
|
0%/50%
|
|
up
|
0
|
0
|
0
|
0
|
0%
|
P1 failure
|
|
|
|
|
|
|
|
down
|
5/9
|
8/8
|
7/10
|
10
|
25%/50%
|
|
up
|
15/13
|
16/14
|
15/14
|
16
|
50%/50%
|
Table 7-8 PE-CE Protocol—OSPF Tuned
Scenario
|
|
T1 (s) (port1/port2)
|
T2 (s) (port1/port2)
|
T3 (s) (port1/port2)
|
Max time for bidirectional conv (s)
|
Max % packet loss (port1/port2)
|
PE3-DL2 failure
|
|
|
|
|
|
|
|
down
|
3/10
|
3/10
|
3/9
|
10
|
25%/50%
|
|
up
|
0
|
0
|
0
|
0
|
0%
|
P1-PE3 failure
|
|
|
|
|
|
|
|
down
|
4/2
|
4/2
|
4/2
|
4
|
15%/5%
|
|
up
|
0
|
0
|
0
|
0
|
0%
|
PE3 failure
|
|
|
|
|
|
|
|
down
|
0/9
|
0/9
|
0/8
|
9
|
0%/50%
|
|
up
|
0
|
0
|
0
|
0
|
0%
|
P1 failure
|
|
|
|
|
|
|
|
down
|
0/5
|
0/5
|
0/5
|
5
|
0%/10%
|
|
up
|
24/21
|
31/29
|
29/27
|
31
|
25%/25%
|
Table 7-9 PE-CE Protocol—EIGRP Untuned
Scenario
|
|
T1 (s) (port1/port2)
|
T2 (s) (port1/port2)
|
T3 (s) (port1/port2)
|
Max time for bidirectional conv (s)
|
Max % packet loss (port1/port2)
|
PE3-DL2 failure
|
|
|
|
|
|
|
|
down
|
3/11
|
3/11
|
3/12
|
12
|
35%/50%
|
|
up
|
0
|
0
|
0
|
0
|
0%
|
P1-PE3 failure
|
|
|
|
|
|
|
|
down
|
9/8
|
9/7
|
9/7
|
9
|
25%/25%
|
|
up
|
0
|
0
|
0
|
0
|
0%
|
PE3 failure
|
|
|
|
|
|
|
|
down
|
4/7
|
5/8
|
3/8
|
8
|
30%/40%
|
|
up
|
0
|
0
|
0
|
0
|
0%
|
P1 failure
|
|
|
|
|
|
|
|
down
|
9/11
|
8/10
|
8/9
|
11
|
50%/25%
|
|
up
|
14/24
|
14/22
|
15/12
|
24
|
50%/50%
|
Table 7-10 PE-CE Protocol—EIGRP Tuned
Scenario
|
|
T1 (s) (port1/port2)
|
T2 (s) (port1/port2)
|
T3 (s) (port1/port2)
|
Max time for bidirectional conv (s)
|
Max % packet loss (port1/port2)
|
PE3-DL2 failure
|
|
|
|
|
|
|
|
down
|
3/11
|
3/11
|
3/10
|
11
|
25%/50%
|
|
up
|
0
|
0
|
0
|
0
|
0%
|
P1-PE3 failure
|
|
|
|
|
|
|
|
down
|
4/2
|
5/3
|
5/2
|
5
|
25%/5%
|
|
up
|
0
|
0
|
0
|
0
|
0%
|
PE3 failure
|
|
|
|
|
|
|
|
down
|
3/8
|
3/8
|
3/8
|
8
|
15%/50%
|
|
up
|
0
|
0
|
0
|
0
|
0%
|
P1 failure
|
|
|
|
|
|
|
|
down
|
0
|
0/5
|
0
|
5
|
0%/20%
|
|
up
|
27/26
|
25/22
|
27/26
|
27
|
50%/50%
|