Table Of Contents
Scalability Test Results (Unicast Only)
Scalability Test Bed Network Diagram
Headend Scalability Test Results—p2p GRE over IPsec
Headend Scalability Test Results—p2p GRE Only
Branch Office Scalability Test Results
AES versus 3DES Scalability Test Results
Failover and Convergence Performance
Scalability Test Results (Unicast Only)
This section offers test results from the Cisco test lab, to provide design guidance on the scalability of various platforms in p2p over IPsec VPN designs. IP multicast (IPmc) results are not included.
Scalability Test Bed Network Diagram
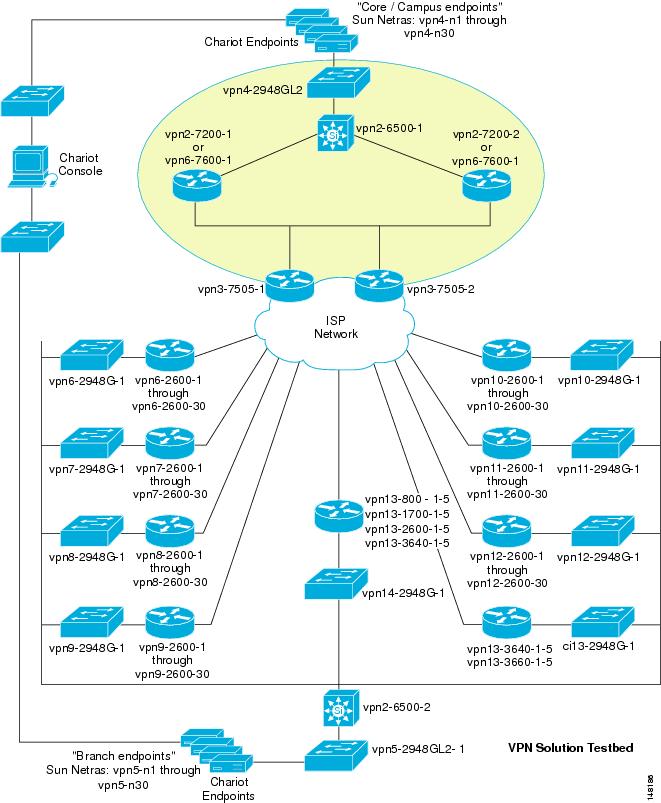
Figure 4-1 shows the scalability test bed network diagram.
Figure 4-1 Scalability Test Bed Network
Scalability Test Methodology
The headend scalability test bed consists of a number of Cisco branch routers (various types, including the 1700, 2600, 3600, 3700, 1800, 2800, and 3800 families) homed to various types of headends. For most of the traffic sent through the network, flows are established using the Ixia Chariot testing tool. The bps mix of traffic is approximately 35 percent UDP and 65 percent TCP; application types represented in the mix include the following: VoIP, FTP, DNS, HTTP, POP3, and TN3270. The average packet size is 188 bytes, from headend to branch, and 144 bytes from branch to headend. This relatively small average packet size ensures that the scalability results presented support a converged network design, and tends to be fairly conservative. A network carrying data-only traffic, with a larger average packet size, may achieve better bps performance than that listed here. However, the pps performance given a specific CPU value should be the same.
Some traffic is also generated by the Cisco IP SLA feature in IOS, formerly known as Cisco Service Assurance Agent (SAA), using the HTTP Get script, with the branch routers making an HTTP Get call to an HTTP server in the core. Testing was conducted without fragmentation occurring in the network by setting the MTU to 1300 bytes on the test endpoints.
The following tables show results for testing with a configuration for p2p GRE over IPsec tunnel aggregation. The routing protocol used during testing was EIGRP unless otherwise stated. The traffic mix used, as stated earlier, is converged data and g.729 VoIP.
Headend Scalability Test Results—p2p GRE over IPsec
Table 4-1 shows results for the testing with the configuration for a p2p GRE over IPsec design and no other Cisco IOS features such as IOS Firewall, PAT, ACLs, IPS, or QoS.
Note that headend scalability testing did not include an exhaustive evaluation of the maximum number of tunnels that can be terminated to headend devices. In addition, scalability testing of the branch routers was performed with two tunnels per branch. This did not include exhaustive testing of the number of tunnels these various platforms can support.
Headend Scalability Test Results—p2p GRE Only
Table 4-2 shows results for the testing with the configuration for a p2p GRE only design and no other Cisco IOS features such as IOS firewall, PAT, ACLs, IPS, or QoS. The purpose for these results is to provide the reader with the p2p GRE only results for designing a Dual Tier Headend Architecture. The IPsec only results can be found in the IPsec Direct Encapsulation Design Guide at the following URL: http://www.cisco.com/en/US/docs/solutions/Enterprise/WAN_and_MAN/Dir_Encap.html.
Table 4-2 Scalability Test Results—p2p GRE Only
Cisco 7200VXR with NPE-G1
1000
1377
203.7
414.2
79%
Cisco 7600
Sup7201
1000
4437
665.7
1675.3
N/A
1 These results are limited by the test bed traffic load limitation. This platform is expected to exceed these results.
Branch Office Scalability Test Results
Table 4-3 shows results for testing with a configuration for p2p GRE over IPsec. A single tunnel was configured to the aggregation headend. These results include other integrated Cisco features such as IOS Firewall, PAT, and ACLs, but not QoS or IPS.
AES versus 3DES Scalability Test Results
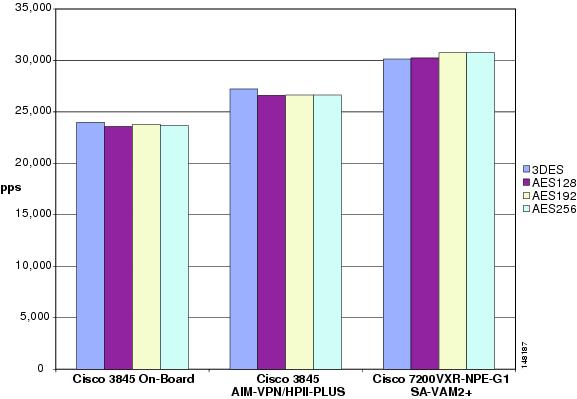
Both 3DES and AES encryption are available in all products shown here, including hardware-accelerated IPsec. Not every test was executed with both 3DES and AES; however, several snapshot tests were performed to compare performance. As shown in Figure 4-2, results are relatively comparable, with little to no variation in performance, even for AES with wider key lengths.
Figure 4-2 Comparison of 3DES and AES Performance
Failover and Convergence Performance
Customers may have different convergence time requirements. The design principles in this guide were used to perform scalability tests with up to 500 branch offices aggregated to two or three headend routers. See Load Sharing with Failover Headend Resiliency Design, page 2-21 for more details.
The following test was performed by powering off one of the headend devices to simulate a complete headend failure. The network fully converged after a maximum of approximately 32 seconds for all 240 branches. The test scenario is shown in Table 4-4.
The same test was then performed with 500 branch offices aggregated to two headend devices. All 250 branches from the powered-off headend successfully failed over to the single surviving headend. In this test, the network fully converged after approximately 32 seconds.
During the re-convergence, when the powered-off headend was restored, the convergence of each branch took approximately two seconds each, with the total time for re-convergence at about five and one-half minutes. Table 4-5 shows the resulting CPU utilization percentages.
Because of the normal TCP backoff process, the total traffic levels through the surviving router may be temporarily lower after a failure than the total traffic before failure.
Software Releases Evaluated
Table 4-6 shows the software releases used in the scalability testing.
Before selecting Cisco IOS software, perform the appropriate research on cisco.com, and if you have technical questions, consult with Cisco Customer Advocacy (TAC).