Table Of Contents
About Cisco Validated Design (CVD) Program
Application Velocity 1.0 for Enterprise Applications
Introduction to Application Velocity
Application Velocity Components
Wide Area Application Services
Network Based Application Recognition (NBAR)
WAN Aggregation Network Design
CA NetQoS ReporterAnalyzer and SuperAgent
Challenges Faced by Remote Access Users
Microsoft Exchange 2010 WorkLoad
Oracle E-Business Suite R12.1 Workload
Microsoft SharePoint 2010 Workload
Microsoft IIS7 Web Traffic WorkLoad
Application Visibility and Control
Visibility in Branch Network—NetFlow Configuration
Netflow Configuration on Branch100
Netflow Configuration on Branch20
Netflow Configuration Validation on Branch Routers
Visibility in Data Center—NetFlow Configuration
Netflow Configuration on DC WAN Edge
Netflow Configuration on Enterprise Core
SPAN Configuration for NAM —Aggregation Nexus 7000
Visibility—NetFlow Collector Setup
Visibility—NetFlow Collector Output
Control—QoS Configuration on the Branch
Control—QoS Configuration on the DC WAN Edge
Application Acceleration and Optimization
Acceleration and Optimization in Branch Network
Acceleration and Optimization in Data Center Network
HTTP Application Optimization (AO) Features
Acceleration and Optimization for Telecommuters
Network and Application Agility
UCS Express Interface Configuration
UCS Express—SRE Configuration and Validation
UCS Express—HyperVisor Connectivity
Windows 2008 VM—DNS and DHCP Configuration
Enterprise Wide Application Velocity Advantage
Setting up WAAS Devices as Data Source
Configuring Customer Applications
NAM—Reporting Inter-Server Traffic
WAAS Central Manager (CM)—Traffic Overview
WAAS Central Manager—HTTP Acceleration
CA NetQoS ReporterAnalyzer—Custom Reports
CA NetQoS SuperAgent—WAAS Optimization Statistics
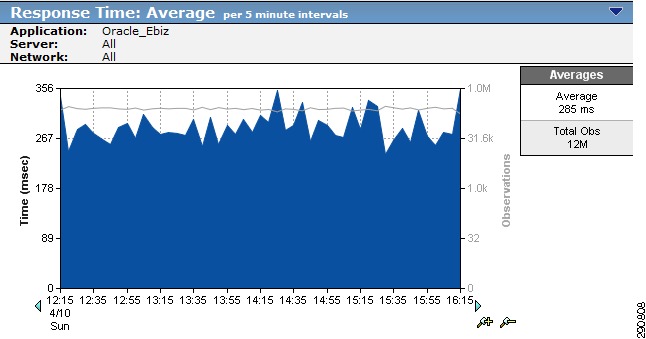
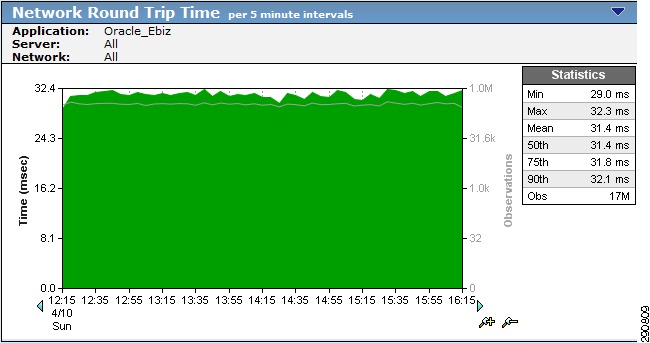
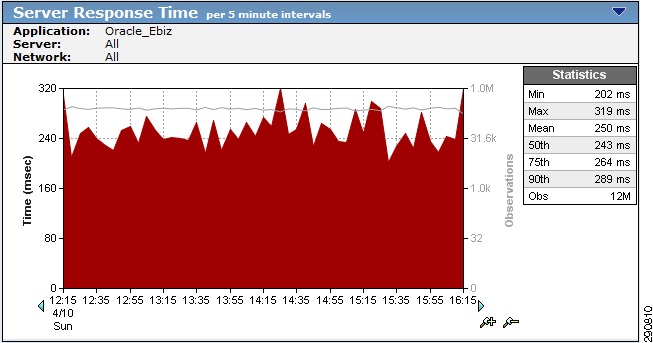
Application Optimization Observation
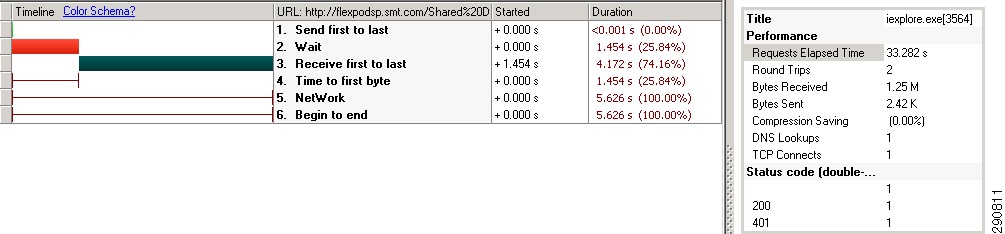
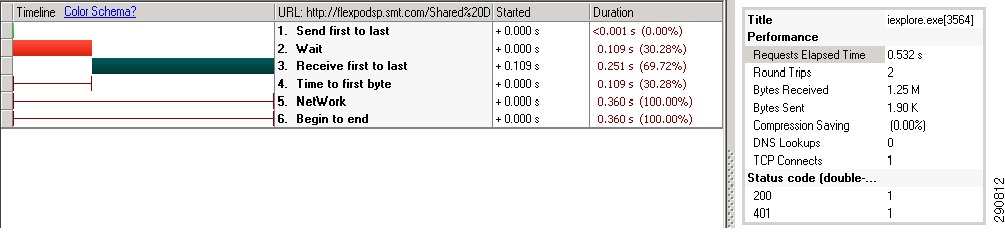
Data and Response Time Reduction
Bandwidth and Time to Download Reduction
Appendix B—CA NetQoS Performance Center
CA NetQoS Performance Center—Network-Wide Monitoring and Reporting
CA NetQoS SuperAgent (SuperAgent)—Measuring Application Response Times
CA NetQoS ReporterAnalyzer—Analyzing Link Traffic
Application Velocity 1.0 for Enterprise ApplicationsLast Updated: June 1, 2011
Building Architectures to Solve Business Problems
About the Authors
Haseeb Niazi, Solutions Architect, Systems Architecture and Strategy Unit, Cisco SystemsHaseeb Niazi is a Solutions Architect in Cisco Systems Architecture and Strategy Unit (SASU) based in RTP North Carolina. Haseeb has over eleven years of experience dealing in optimization, security, and data center related technologies. As a member of various Solution Teams and Advanced Services, he has helped a large number of enterprise and service provider customers evaluate and deploy a wide range of Cisco solutions.
Haseeb holds a masters degree in computer engineering from University of Southern California and regularly presents to both internal and external audiences at various conferences and customer events.
As part of SASU, Haseeb is currently leading the Application Velocity Validation effort.
About Cisco Validated Design (CVD) Program
The CVD program consists of systems and solutions designed, tested, and documented to facilitate faster, more reliable, and more predictable customer deployments. For more information visit http://www.cisco.com/go/designzone.
ALL DESIGNS, SPECIFICATIONS, STATEMENTS, INFORMATION, AND RECOMMENDATIONS (COLLECTIVELY, "DESIGNS") IN THIS MANUAL ARE PRESENTED "AS IS," WITH ALL FAULTS. CISCO AND ITS SUPPLIERS DISCLAIM ALL WARRANTIES, INCLUDING, WITHOUT LIMITATION, THE WARRANTY OF MERCHANTABILITY, FITNESS FOR A PARTICULAR PURPOSE AND NONINFRINGEMENT OR ARISING FROM A COURSE OF DEALING, USAGE, OR TRADE PRACTICE. IN NO EVENT SHALL CISCO OR ITS SUPPLIERS BE LIABLE FOR ANY INDIRECT, SPECIAL, CONSEQUENTIAL, OR INCIDENTAL DAMAGES, INCLUDING, WITHOUT LIMITATION, LOST PROFITS OR LOSS OR DAMAGE TO DATA ARISING OUT OF THE USE OR INABILITY TO USE THE DESIGNS, EVEN IF CISCO OR ITS SUPPLIERS HAVE BEEN ADVISED OF THE POSSIBILITY OF SUCH DAMAGES.
THE DESIGNS ARE SUBJECT TO CHANGE WITHOUT NOTICE. USERS ARE SOLELY RESPONSIBLE FOR THEIR APPLICATION OF THE DESIGNS. THE DESIGNS DO NOT CONSTITUTE THE TECHNICAL OR OTHER PROFESSIONAL ADVICE OF CISCO, ITS SUPPLIERS OR PARTNERS. USERS SHOULD CONSULT THEIR OWN TECHNICAL ADVISORS BEFORE IMPLEMENTING THE DESIGNS. RESULTS MAY VARY DEPENDING ON FACTORS NOT TESTED BY CISCO.
The Cisco implementation of TCP header compression is an adaptation of a program developed by the University of California, Berkeley (UCB) as part of UCB's public domain version of the UNIX operating system. All rights reserved. Copyright © 1981, Regents of the University of California.
Cisco and the Cisco Logo are trademarks of Cisco Systems, Inc. and/or its affiliates in the U.S. and other countries. A listing of Cisco's trademarks can be found at http://www.cisco.com/go/trademarks. Third party trademarks mentioned are the property of their respective owners. The use of the word partner does not imply a partnership relationship between Cisco and any other company. (1005R)
Any Internet Protocol (IP) addresses and phone numbers used in this document are not intended to be actual addresses and phone numbers. Any examples, command display output, network topology diagrams, and other figures included in the document are shown for illustrative purposes only. Any use of actual IP addresses or phone numbers in illustrative content is unintentional and coincidental.
Application Velocity 1.0 for Enterprise Applications
© 2011 Cisco Systems, Inc. All rights reserved.
Application Velocity 1.0 for Enterprise Applications
Introduction to Application Velocity
Cisco Application Velocity is the Borderless Network Service that maximizes the user experience for any application, at any time, and on any device, optimizes resource utilization, and provides application adaptability/survivability.
Application Velocity allows IT professionals to meet or exceed business service level agreements and user expectations through:
•
Visibility and control for discovery, prioritization, monitoring, and control of applications—integrated into routing and switching
•
•
Application Velocity Components
Application Velocity components are made up of several Network Technologies and Product. These components are classified as follows:
•
•
•
Business Requirements
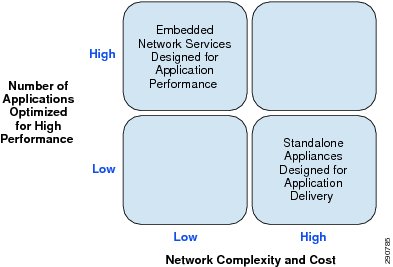
To gain the full value of corporate applications, they must deliver excellent user experience, not only when working in the office or at home, but anywhere in between, even while talking on a mobile endpoint. Independent of geographic location, a user accessing their business or personal services should have the same seamless experience. Application performance is key to an excellent experience and should be consistently good, for example, whether sitting at a desktop watching a video or engaged in a WebEx conference and then immediately transitioning to an iPhone. The user should have an excellent experience at the highest level afforded by their endpoint. To deliver this seamless user experience application performance, relevant technology needs to being incorporated in the corporate IT infrastructure, endpoint devices, or a combination of both.
Figure 1 Business Drivers for a Converged Solution
Cisco Application Velocity, a Borderless Network service, delivers performance acceleration and application agility, providing an enriched user experience. By utilizing a number of existing features and enhancements in the network infrastructure, Application Velocity tends to increase the customer's perceived value of various Cisco products. As an example of optimal resource utilization, consider Cisco's Integrated Services Router (ISR) Generation 2 (G2) branch office device that integrates unified communications, wide area application optimization, network security, LAN/WAN networking, and supports the Unified Computing System (UCS) Express Platform which runs applications at the branch office router. By smartly customizing these services, IT managers can deliver networking, security, voice and video communications, and host applications at a single point in the branch as well as gain visibility into the applications. This type of resource utilization and central control not only saves on capital cost and energy, but offers IT operational efficiency, rapid application deployment, and innovation absorption.
Purpose of this Guide
Cisco Validated Designs consist of systems and solutions that are designed, tested, and documented to facilitate and improve customer deployments.
The Application Velocity Phase 1.0 Cisco Validated Design showcases an end-to-end network architecture, which covers:
•
•
•
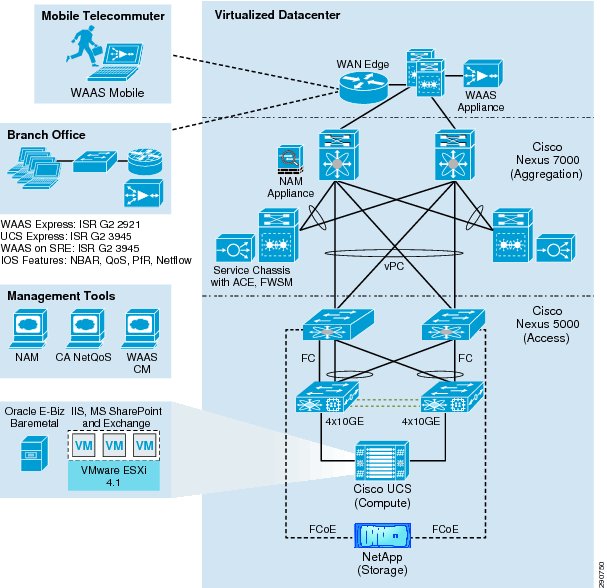
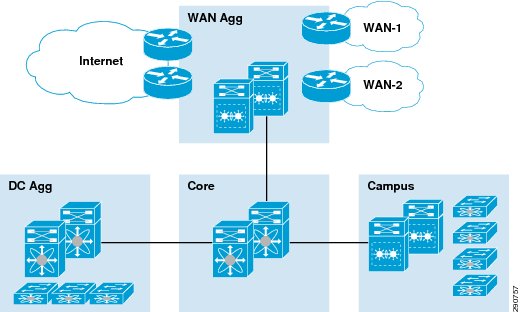
Figure 2 Cisco Validated Design 1.0 Network Overview
Figure 2 depicts the high level architecture for the Application Velocity CVD version 1.0. It showcases a typical enterprise with a virtualized data center hosting enterprise applications and a globally-distributed workforce including road warrior and branch office users accessing these applications remotely over a WAN.
Applications Covered
For solution validation, these applications were accessed by the distributed work force over the WAN:
•
•
•
•
Who should Read This Guide?
This guide is intended for the reader with any or all of the following:
•
•
•
•
•
•
•
•
•
•
•
Related Documents
•
http://www.cisco.com/en/US/solutions/ns1015/application_velocity.html•
http://www.cisco.com/en/US/solutions/ns1015/lippis_white_paper_application_velocity.pdf•
http://www.cisco.com/en/US/netsol/ns1015/index.html•
http://www.cisco.com/en/US/netsol/ns1112/networking_solutions_sub_program_home.html•
http://www.cisco.com/en/US/docs/solutions/Enterprise/Data_Center/App_Networking/shareptdg.html•
http://www.cisco.com/en/US/docs/solutions/Enterprise/Data_Center/App_Networking/Exchange_VSphere_UCS_NetApp.html•
http://www.cisco.com/en/US/docs/solutions/Enterprise/Data_Center/App_Networking/SharePoint_FlexPod.htmlEnd-to-End Solution Topology
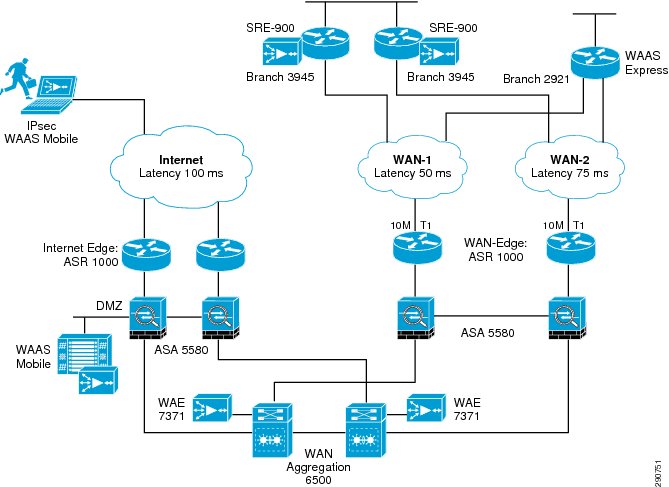
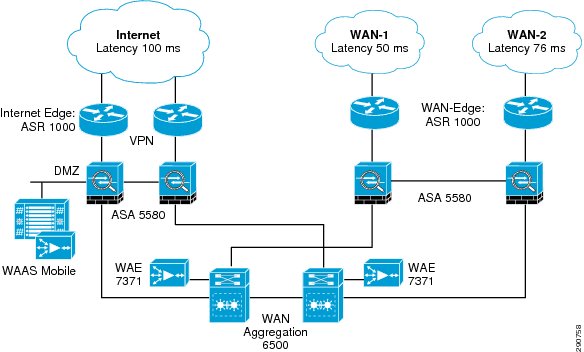
Figure 3 and Figure 4 show the WAN and data center networks used for this CVD. Specifics of these network components are discusses in their specific sections later in the document.
Figure 3 WAN Network Design
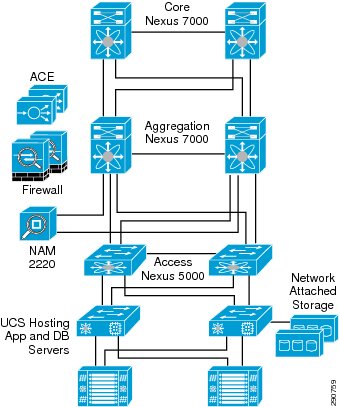
Figure 4 Data Center Network Design
Software Versions
Table 3 Software Versions
ISR-G2
15.1(3)T
ASR
12.2(33)XNF2
WAAS
4.3.1
WAAS Mobile
3.5.1
NAM
5.0
Nexus 7000
5.1(3)
Branch Design
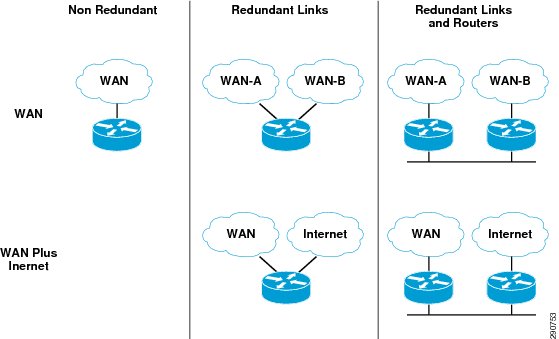
The branch design used during validation is based on Cisco Smart Business Architecture (SBA) WAN deployment guidelines. Cisco SBA documents multiple remote site WAN designs that are based on various combinations of WAN transport mapped to site-specific requirements for service levels and redundancy. The remote site designs include single or dual WAN edge routers, which can be either a CE router or a VPN spoke router. In some cases, a single WAN edge router can perform the role of both a CE router and VPN spoke router. Most remote sites are designed with a single router WAN edge; however, certain remote site types require a dual router WAN edge. Dual router candidate sites include regional office or remote campus locations with large user populations or sites with business critical needs that justify additional redundancy to remove single points of failure.
Figure 5 WAN Design Options
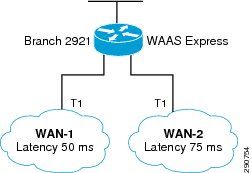
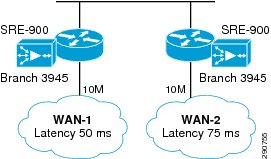
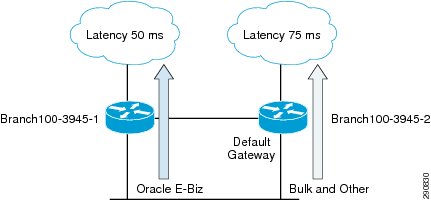
Redundant WAN branches were selected based on resiliency requirements and the Application Velocity technology selections. In the remainderof the document, these branches are named Branch20 and Branch100 based on the number of users at each branch site and are shown in Figure 6 and Figure 7.
Figure 6 Branch20—Redundant WAN, Single Router
Figure 7 Branch100—Redundant WAN, Redundant Routers
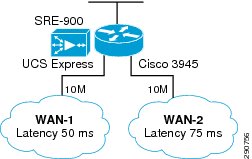
This validation also covers a third type of branch, Branch-UCSX, a satellite office for occasional telecommuters. This branch showcases UCS Express with Cisco 3945/SRE-900 to host a Windows 2008 Server acting as a DNS and DHCP server. Unmanaged server design and redundant paths are the only two requirements for this branch.
Figure 8 Branch-UCSX—Branch Equipped with UCS Express
Technology Positioning
Each of the branch design showcases the same core technologies that make up the Application Velocity framework. However, based on the branch design and user scale, these technologies are not deployed exactly the same. One example of such a difference is WAAS and WAAS Express (these technologies are covered later in this section). Branch100 uses SREs configured with WAAS because of a high scale requirement, whereas Branch20 is configured with WAAS Express. Similarly some technologies (such as Hot Standby Router Protocol [HSRP]) only make sense at Branch100 because of redundant routers. Table 4 outlines the technology positioning and the latter half of the section provides an overview of these technologies.
Technology Overview
Some of the technologies deployed in the branch network that make up Application Velocity are highlighted below. For in-depth details, review the Cisco.com documentation or the document links provided in this document.
NetFlow
NetFlow is an embedded instrumentation within Cisco IOS Software to characterize network operation. The ability to characterize IP traffic and understand how and where it flows is critical for network availability, performance, and troubleshooting. Monitoring IP traffic flows facilitates more accurate capacity planning and ensures that resources are used appropriately in support of organizational goals. It helps IT determine where to apply QoS, optimizes resource usage, and plays a vital role in detecting undesirable network events.
NetFlow facilitates solutions to many common problems encountered by IT professionals:
•
•
•
•
•
•
Cisco IOS Flexible NetFlow is the next-generation in flow technology. It optimizes the network infrastructure, reducing operation costs and improving capacity planning and security incident detection with increased flexibility and scalability.
In Application Velocity, NetFlow plays a vital role for providing network visibility. NetFlow statistics are analyzed using NetFlow collectors (CA NetQoS and/or Cisco NAM) to provide an accurate blueprint of network utilization.
Wide Area Application Services
Cisco Wide Area Application Services (WAAS) is a comprehensive WAN optimization and application acceleration solution that is a key component of Cisco Borderless Networks and data center architectures.
Cisco WAAS accelerates applications and data over the WAN, optimizes bandwidth, empowers cloud services, and provides local hosting of branch IT services, all with industry-leading network integration. Cisco WAAS allows IT departments to centralize applications and storage while maintaining productivity for branch office and mobile users.
Cisco WAAS enables organizations to accomplish primary IT objectives across the Cisco solution areas.
Data center
•
•
•
•
Borderless Network
•
•
•
•
Cisco WAAS offers advanced WAN optimization functionality including:
•
–
–
–
•
–
–
•
•
–
–
–
•
–
–
–
–
–
–
–
In Application Velocity, WAAS plays a vital role for optimizing and accelerating traffic over WAN links. WAAS comes in different flavors and for the CVD, WAE-7371 appliances in the data center and SRE-900 in Branch100 were selected. vWAAS, a VM appliance running on ESX Server, acts as a Central Manager.
WAAS Express
Cisco WAAS Express provides a cost-effective, transparent, and easy-to-deploy WAN optimization solution. It can be easily enabled on most second-generation Cisco Integrated Services Router (ISR G2) with Cisco IOS Software. Since this is a IOS-based solution, there is no need to use appliances or service modules. Some of the key benefits of WAAS Express are:
•
•
•
•
•
In Application Velocity, WAAS Express provides optimization and acceleration services for WAN traffic on Branch20. Cisco 2921 configured with maximum supported RAM, a requirement for WAAS Express, utilizes the WAAS Express feature set in conjunction with WAE-7371 appliances on the data center.
UCS Express
The Cisco Unified Computing System Express (UCS Express) is a converged networking, computing, and virtualization platform for hosting essential infrastructure services and mission-critical business applications in the lean branch office. UCS Express comprises:
•
•
•
•
Cisco UCS Express is best suited to multisite organizations with centralized IT infrastructure that host applications in the branch office. It enables multiple virtual instances of Microsoft Windows Server to run on dedicated x86 blades in the ISR G2 chassis.
Key features:
•
•
•
•
•
Key benefits:
•
•
•
•
•
In Application Velocity, to outline the benefits of UCS Express, Windows 2008 server is configured with DHCP and DNS services on a remote branch. A Cisco 3945 configured with SRE-900 is deployed at the remote branch.
Quality of Service (QoS)
A communications network forms the backbone of any successful organization. These networks serve as a transport for a multitude of applications, including delay sensitive voice, and bandwidth intensive video. These business applications stretch network capabilities and resources, but also complement, add value, and enhance every business process. Networks must therefore provide secure, predictable, measurable, and sometimes guaranteed services to these applications. Cisco IOS Software provides QoS features and solutions for addressing the diverse needs of voice, video, and data applications. Cisco IOS QoS allows complex networks control and predictable service for a variety of networked applications and traffic types. Small to medium businesses, enterprises, and service providers all benefit from deploying Cisco QoS on their networks. Bandwidth, delay, jitter, and packet loss can be effectively controlled. By ensuring the desired results, QoS enables efficient, predictable services for business-critical applications.
QoS packet classification features allow traffic to be partitioned into multiple priority levels or classes of service. Packets can be classified in a variety of different ways ranging from input interface, to NBAR for difficult to classify applications, to arbitrary access control lists. Classification is the first component of Modular QoS CLI (MQC), the simple, scalable, and powerful Cisco IOS QoS framework. MQC allows for clear separation of classification, from the policy applied on the classes, to the application of a QoS policy on an interface or sub-interface. Packets can also be marked in a variety of ways (e.g., Layer2-802.1p/Q/ISL, ATM CLP bit, Frame-Relay DE-bit, MPLS EXP bits, etc., Layer 3 IP Precedence, Differentiated Services Code Point (DSCP)) using the policy framework component of the MQC.
When a network interface is congested (even at high speeds, transient congestion is observed), queuing techniques are necessary to ensure that critical applications get the required forwarding treatment. For example, business critical traffic like SAP, etc. may need to be forwarded at a high priority up to a provisioned bandwidth while other non-delay sensitive bulk traffic (such as File Transfer Program (FTP), Hyper Text Transfer Protocol (HTTP), etc.), can be configured with lower priority and bandwidth allocation.
In Application Velocity, QoS is used to mark the traffic as well as allocate bandwidth and priority treatment to a business critical application, Oracle E-Business. For identifying applications, both Access Control Lists (ACL) and Network Based Application Recognition (NBAR) are utilized.
Network Based Application Recognition (NBAR)
NBAR is an intelligent classification engine in Cisco IOS Software that can recognize a wide variety of applications, including Web-based and client/server applications. Once the applications are recognized, the network can invoke required services for that particular application. NBAR performs identification of applications and protocols (Layer 4 to Layer 7) as well as protocol discovery. NBAR can classify applications that use:
•
•
•
•
•
In Application Velocity, NBAR is used to identify the SharePoint traffic based on URL and Oracle E-Business traffic based on custom signatures.
Performance Routing (PfR)
Performance Routing (PfR) provides automatic route optimization and load distribution for multiple connections between networks. PfR is an integrated Cisco IOS solution that allows you to monitor IP traffic flows and then define policies and rules based on traffic class performance, link load distribution, link bandwidth monetary cost, and traffic type. PfR provides active and passive monitoring systems, dynamic failure detection, and automatic path correction. Deploying PfR enables intelligent load distribution and optimal route selection in an enterprise network.
PfR complements traditional routing technologies by using the intelligence of a Cisco IOS infrastructure to improve application performance and availability. This technology can select the best path for each application based upon advanced criteria such as reachability, delay, loss, jitter, and Mean Opinion Score (MOS).
PfR can also improve application availability by dynamically routing around network problems like blackholes and brownouts that traditional IP routing may not detect. The intelligent load balancing capability of PfR can optimize path selection based upon link utilization and/or circuit pricing.
In Application Velocity, PfR is utilized to identify the Oracle traffic on Branch100 and route the Oracle traffic over the low latency 50 ms link while the bulk traffic takes the default path (75 ms WAN link). By separating the business critical traffic from the bulk traffic, business critical traffic not only routes over low latency link but also takes the load off of the bulk data link.
Data Center Design
The data center design used in the validation is a tested, customer validated, and proven architecture. The data center is designed in a tiered approach where core, aggregation, and access layers composed of redundant systems are clearly defined. Various network zones such as WAN and campus are provisioned with distinct Cisco 6500-based aggregation devices (to isolate the fault zones) which connect to the data center through a high-speed core. Having distinct zone aggregation devices provides common points to deploy services effectively. This first phase of CVD does not include campus in validation.
Figure 9 Data Center Block Design
WAN Aggregation Network Design
As the name suggests, the WAN aggregation zone of the network provides connectivity to the Internet as well as WAN networks where the branches are connected. The WAN network can be a dedicated IP, Frame Relay, ATM, or MPLS network. Traffic coming in from remote branches over the WAN or from road warriors traverses this zone to access resources in the data center. Since the WAN aggregation network is traversed by all remote users, branches or otherwise, services like security, VPN, and WAN Optimization are deployed in this common segment.
Figure 10 Data Center—WAN Aggregation Zone
Device Positioning
In order to understand the traffic flow through the WAN aggregation zone, it is important to understand the services provided by the devices in this segment.
Traffic Flow
Over Branch WAN
Branch traffic enters the data center network from the WAN edge ASR. This traffic goes through the virtual context on ASA 5580 acting as a perimeter firewall. Traffic is then forwarded to a WAN aggregation 6500 where Web Cache Communication Protocol (WCCP) redirects the interesting traffic to WAAS Appliance WAE-7371 for WAAS processing. When the traffic is returned from WAE-7371, traffic is forwarded to the core. Return traffic follows the same backward logic.
Over Internet
Telecommunter traffic enters the data center network from the Internet edge ASR. VPN traffic is terminated and clear text traffic is forwarded to the ASA. This traffic goes through the virtual context on ASA 5580 acting as Internet perimeter firewall. The firewall forwards the traffic to a WAAS mobile server hosted in the DMZ. After the WAAS mobile server completes its processing and forwards the traffic back to the firewall, traffic is forwarded to the core via WAN aggregation 6500. Return traffic follows the same backward logic.
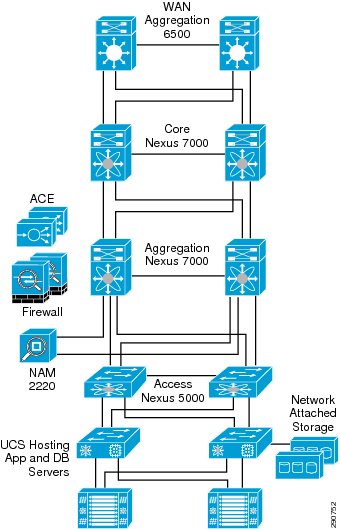
Core and DC Network Design
The core network and data center hosting all the applications is built using the Cisco Nexus product line and the Cisco Unified Computing System. Figure 11 shows the basic connectivity of these components. Services such as Firewall, ACE, and Network Analysis (NAM) are provided at the data center aggregation layer.
Figure 11 Data Center Network Details
•
•
•
•
Technology Positioning
This section covers the technologies that make up Application Velocity in the data center. For in-depth details, review the Cisco.com documentation or the links provided in this document.
WAAS
In the data center, the Cisco WAE-7371 appliance is connected to the Catalyst 6500 to provide optimization and acceleration services. For an overview of WAAS, see Technology Positioning.
WAAS Mobile
Cisco WAAS Mobile extends Cisco WAAS Software application acceleration benefits to mobile employees who travel outside the branch office and to branch office and mobile users who access applications hosted in public cloud environments. Acceleration of mobile VPN connections over the public Internet brings different technical challenges than those for corporate WAN and branch office optimization.
Cisco WAAS Mobile provides industry-leading performance under the most challenging network connectivity conditions, has a small PC footprint, and offers low total cost of ownership (TCO), reducing the costs normally associated with installation of client software on mass-user PCs. Cisco WAAS Mobile maintains a persistent and bidirectional history of data on both the mobile PC and the Cisco WAAS Mobile server. This history can be used in current and future transfers, across different VPN sessions, and even after a reboot to reduce bandwidth consumption and improve performance. In addition, instead of using a single algorithm for all file types, Cisco WAAS Mobile uses file-format-specific compression techniques to provide better compression than generic compression for Microsoft Word, Excel, and PowerPoint; Adobe Shockwave Flash (SWF); Zip files; and JPEG, GIF, and PNG files.
Cisco WAAS Mobile also reduces application-specific latency for a broad range of applications, including:
•
•
•
•
•
•
By utilizing all these techniques, WAAS Mobile proves highly effective in mobile user environments. In Application Velocity, road warriors utilize WAAS mobile to accelerate and optimize their sessions. These sessions are sourced over the Internet and are secured by VPN.
NetFlow
In Application Velocity data center design, at a minimum Netflow should be configured at three places:
•
•
•
Internet edge ASR and WAN edge ASR provide an insight into the optimized traffic entering the data center from the WAN and Internet. Applying Netflow collection at the right interfaces, both pre- and post-encryption traffic can be observed. Core Nexus 7000s provide a central place to monitor the traffic entering and leaving various zones in the network. For example, if the intent is to monitor the traffic entering the data center aggregation Nexus 7000, monitor the core interface connections to the data center aggregation.
For an overview of Netflow, see Technology Positioning.
NAM
Network administrators need multifaceted visibility into the network to help ensure consistent and cost-effective delivery of services to end users. Cisco Network Analysis Module (NAM) delivers combined traffic and performance analysis capabilities that empower network administrators to optimize network resources, troubleshoot performance issues, and deliver a consistent end user experience. The Cisco NAM comes in varying cost and performance form factors, which include integrated services modules, standalone appliances, and virtual service blades. The portfolio offers cost-effective choices and deployment flexibility to meet your needs for traffic and performance visibility across the network.
Some of the key Features of NAM include:
•
•
•
•
•
•
•
•
In Application Velocity, a NAM Appliance is connected to the data center aggregation. Cisco NAM is used to:
•
•
•
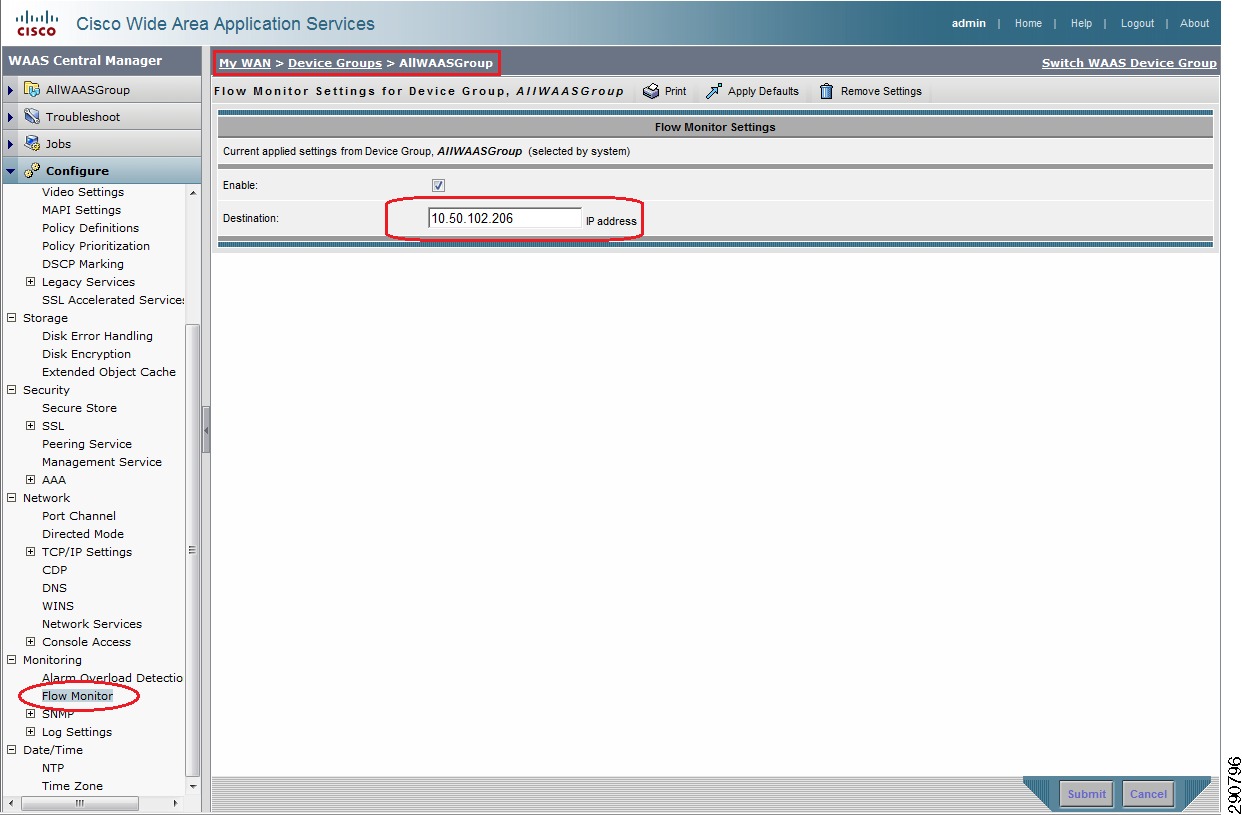
WAAS Central Manager
Cisco WAAS is centrally managed by a scalable, secure, and simple function called the Cisco WAAS Central Manager that runs on Cisco WAE Appliances or as a Virtual Machine on an ESX server. The Cisco WAAS Central Manager can be configured for high availability by deploying a pair of Cisco WAE devices as central managers; configuration and monitoring data is automatically shared by the two central managers. The Cisco WAAS Central Manager provides a centralized mechanism for configuring features, reporting, and monitoring. It can manage a topology containing thousands of Cisco WAE nodes. The Cisco WAAS Central Manager can be accessed from a Web browser, allowing management from essentially anywhere in the world. Access to the Cisco WAAS Central Manager is secured and encrypted with Secure Sockets Layer (SSL) and users can be authenticated through a local database or a third-party authentication service such as RADIUS, TACACS, or Microsoft Active Directory.
Within a Cisco WAAS topology, each Cisco WAE runs a process called central management system (CMS). The CMS process provides SSL-encrypted bidirectional configuration synchronization of the Cisco WAAS Central Manager and the Cisco WAE devices. The CMS process is also used to exchange reporting information and statistics at a configurable interval. When the administrator applies configuration or policy changes to a Cisco WAE device or a group of Cisco WAE devices (a device group), the Cisco WAAS Central Manager automatically propagates the changes to each of the managed Cisco WAE devices. Cisco WAE devices that are not available to receive the update will receive the update the next time they become available.
In Application Velocity, WAAS Central Manager is deployed in the data center using vWAAS—a Virtual Machine running on an ESX host. The Central manager is used to configure and monitor the WAAS devices. The Central Manager also manages Branch20, Cisco 2921 running WAAS Express.
CA NetQoS ReporterAnalyzer and SuperAgent
For the Application Velocity v1.0 CVD, CA NetQoS ReporterAnalyzer was utilized as the partner solution for NetFlow collection, analysis, and reporting. In addition, CA NetQoS SuperAgent was deployed to collect data from Cisco WAAS and Cisco NAM to report on client, server, and WAN latency. For details on these products, see Appendix B—CA NetQoS Performance Center.
QoS in Data Center
Like the branch QoS, QoS in the data center is used to mark the traffic as well as allocate bandwidth and priority treatment to business critical application such as Oracle E-Business. Bandwidth and priority allocation functions are performed on a Cisco WAN edge ASR. Traffic marking can be performed on the ASR, but preferably should be done within the data center at the access layer.
Mobile Users
Telecommuters and business travellers are an integral part of any corporation regardless of size. It is therefore important to provide them with an enhanced user experience whether they are working from home or are on a business trip half the way across the world.
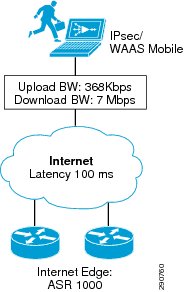
Challenges Faced by Remote Access Users
Instead of dedicated branch-to-corporate-WAN leased lines, mobile users are using public Internet connections such as DSL, Wi-Fi, satellite, dial-up, cable, and cellular. These connections have less bandwidth, higher packet loss and latency, and additional challenges such as time-slicing delay in cellular environments. In contrast to branch office users, who can rely on a dedicated branch device to provide application acceleration, mobile users have to share laptop or PC computing resources and the TCP software stack with many other PC applications. There are a wide variety of applications and VPN clients in the field. To solve these problems, Cisco WAAS Mobile is provides an elegant solution.
Network Parameters
Figure 12 Road Warrior Network
Telecommuter connection was modeled after a typical cable connection with following parameters:
•
•
•
•
Technology Positioning
To review the technology positioning, it is important to understand traffic flow from telecommuters. Unlike the branch networks, when a mobile user boots up their laptop, the Service Provider DHCP server allocates a dynamic IP address. In order to access the data center network securely, the user launches the VPN client and connects to the VPN gateway, an Internet edge ASR 1000. After the connection to the VPN gateway is established, WAAS mobile client is able to communicate to the WAAS mobile server and the traffic from the client machine is accelerated and optimized over a secure channel.
Cisco VPN
In Application Velocity, Cisco EzVPN provides the necessary encryption services for mobile user communication. Cisco ASR 1000 is configured as an EzVPN server to support the remote PC-based client sessions. Visit Cisco.com for additional information on Cisco VPN solutions.
WAAS Mobile
In Application Velocity, Cisco WAAS Mobile client is installed on the mobile user's PC. The client works in conjunction with WAAS mobile server to provide optimization and acceleration services. See Data Center Design for an overview of WAAS mobile.
Application Workload
For validating various components of Application Velocity, four applications are hosted in the data center:
•
•
•
•
An overview of application design in the data center is provided for better understanding of the traffic flow and application components involved.
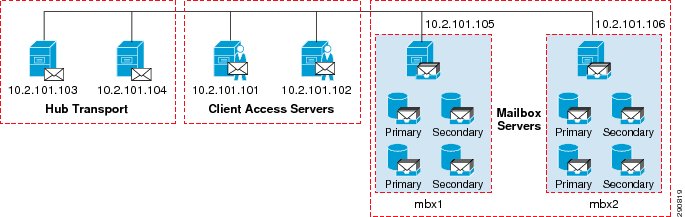
Microsoft Exchange 2010 WorkLoad
Figure 13 Microsoft Exchange 2010 WorkLoad
The LoadGen for Exchange 2010 traffic generator was configured to simulate Exchange MAPI/RPC client traffic for 100 (Branch100) and 20 (Branch20) user mailboxes over an eight hour simulation day, with a total test time of 10 hours. The user profile that was configured was Outlook 2007 online user type, sending and receiving 100 messages per user day and "Stress Mode" was set to Enabled. The user mailbox size was 250MB. To apply all the benefits of Cisco WAAS for optimizing Exchange traffic, the "disableMapiencryption" setting in the LoadGen XML file was set to "true" to turn off native MAPI encryption.
A typical user session consists of an initial TCP flow targeting port 135 (RPC/End Point Mapper) on the Exchange Client Access Server. The subsequent TCP flows for that user session target higher ports that are dynamically negotiated. There are about 10-15 TCP flows that are generated for each Exchange user. Table 6 shows the different Exchange user activities (e.g., calendaring, sending mail) that are simulated by the LoadGen tool and the percentage of user transactions for each activity type.
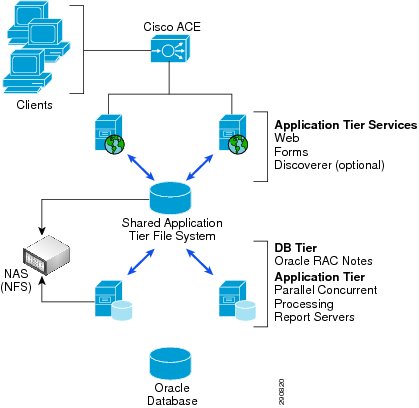
Oracle E-Business Suite R12.1 Workload
Figure 14 Oracle E-Business Topology
Oracle Application Testing Suite was used to simulate Oracle E-Business client traffic. For user workload, two types of activities were configured: Sales Proposal Creation and General Ledger Journal Inquiries. At Branch100, 10 virtual users were configured for each activity with virtually no iteration delays, simulating a constant 20% concurrent workload. For Branch20, five virtual users for each activity were configured, simulating 50% concurrency. The load was consistently run for a period of 10 hours.
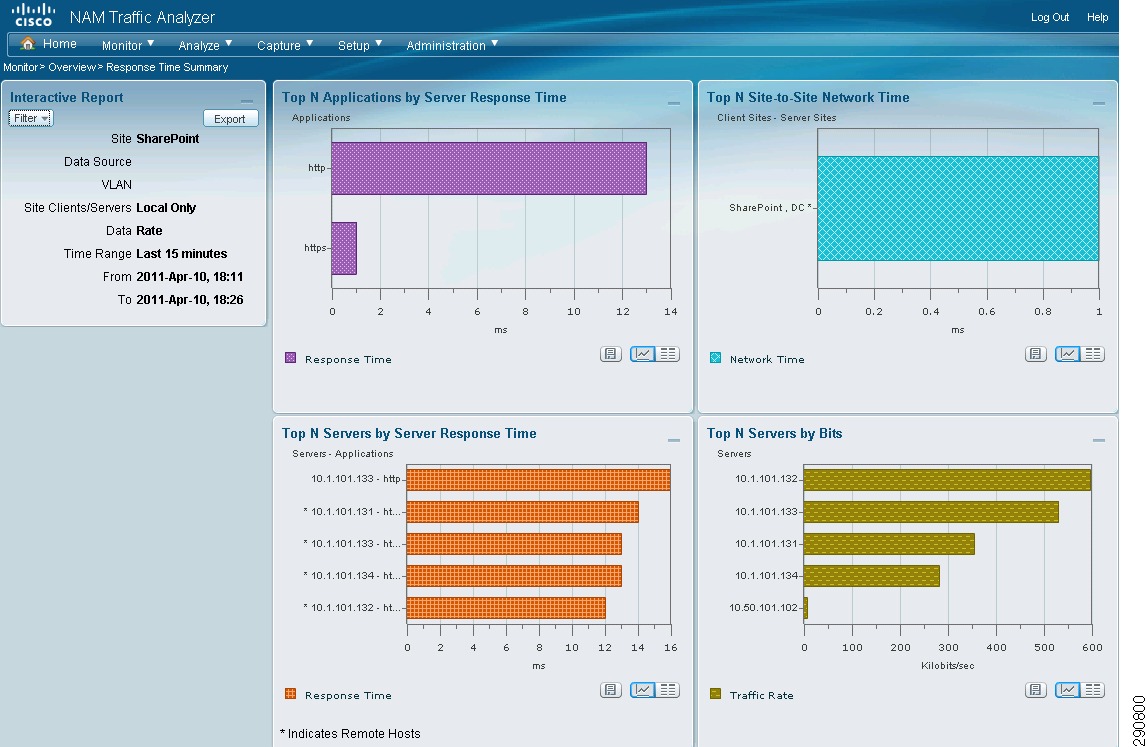
Microsoft SharePoint 2010 Workload
Figure 15 Microsoft SharePoint Topology
Microsoft Visual Studio was used to simulate SharePoint client traffic. For user workload, three types of activities were configured: browse a SharePoint site, upload a document, and open a document. According to Microsoft Guidelines, a typical 100 user workload in a SharePoint environment results in one request per second to the server. At Branch100, a two request per second workload was simulated. The same workload was simulated for Branch20. The load was run for a period of 10 hours.
Microsoft IIS7 Web Traffic WorkLoad
Microsoft IIS 7 server was set up to host a Website at the data center. A simulated test environment at both Branch100 and Branch20 generated a workload equivalent to five page requests per second. The Web page being accessed was 250KB (all text).
Application Visibility and Control
Overview
As described in the introduction, the first component in Application Velocity is visibility and control. The ability to gain visibility into the network and the applications that it supports is critical to understanding the traffic profile. A number of Cisco technologies can be deployed at various points in the network to identify the applications in use and the bandwidth they consume. In this CVD, these technologies were selected and deployed:
•
•
•
With the visibility and trending provided by the tools mentioned above, a traffic profile over time is analyzed. Based on this traffic profile, applications can then be classified and prioritized on an end-to-end basis using technologies such as NBAR and QoS. As the applications are discovered and prioritized, their performance can be monitored to assure user experience expectations are being realized. The QoS parameters can be tweaked as needed to further enhance the user experience by reallocating bandwidth to the starving applications.
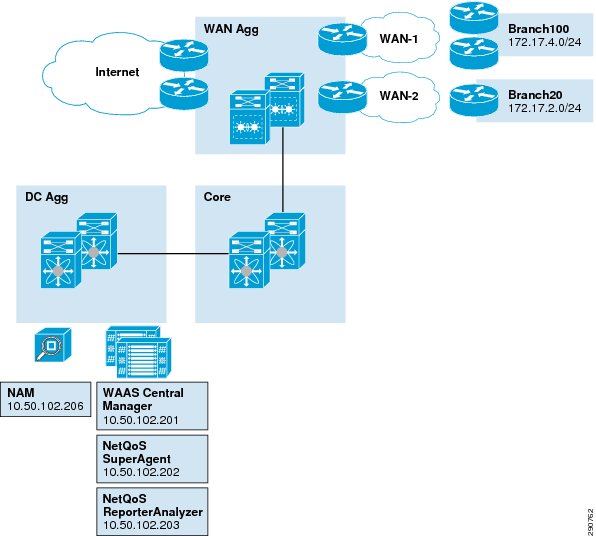
Figure 16 shows the client subnets as well as application server details in the CVD test bed. Figure 17 shows various Traffic Analysis Server IP addresses. This information is utilized in setting up various configuration parameters in the sections to follow.
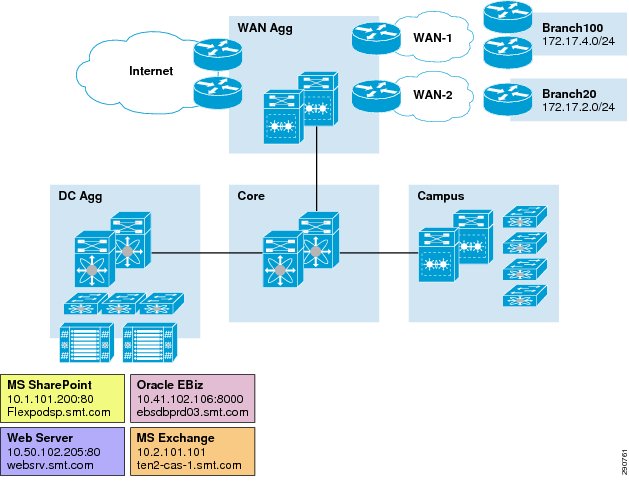
Figure 16 Enterprise Branch and Data Center Addressing
Figure 17 Enterprise Traffic Analysis Tools
Visibility in Branch Network—NetFlow Configuration
On the branch network, it is important to understand how much and what kind of traffic is entering the branch router from both LAN and WAN side. It is important to make sure there is no duplication of the traffic reporting. NetFlow configuration on the branch network is therefore applied only in the "egress" direction on both LAN and WAN interfaces. NetFlow is typically configured in the "ingress" direction on device interfaces, but with WAAS deployment, NetFlow in the "egress" direction provides more meaningful data.
Tip
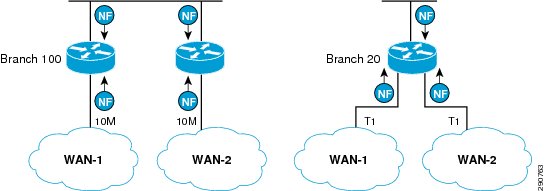
Figure 18 NetFlow Collection Direction in Branch Routers
Netflow Configuration on Branch100
Tip
BRANCH100-3945-1
interface GigabitEthernet0/0description *** LAN Interface ***ip address 172.17.4.2 255.255.255.0ip flow egressstandby version 2standby 0 ip 172.17.4.1standby 0 preemptstandby 0 authentication md5 key-string ciscorouter!interface GigabitEthernet0/1description *** WAN Interface ***ip address 101.1.4.1 255.255.255.252ip flow egress!ip flow-cache timeout active 1ip flow-export source GigabitEthernet0/1ip flow-export version 9ip flow-export destination 10.50.102.203 9995 << (CA NetQoS)ip flow-export destination 10.50.102.206 3000 << (Cisco NAM)!snmp-server community RO ROsnmp-server ifindex persistBRANCH100-3945-2
interface GigabitEthernet0/0description *** LAN Interface ***ip address 172.17.4.3 255.255.255.0ip flow egressstandby version 2standby 0 ip 172.17.4.1standby 0 priority 105standby 0 preemptstandby 0 authentication md5 key-string ciscorouter!interface GigabitEthernet0/2description *** WAN Interface ***ip address 102.1.4.1 255.255.255.252ip flow egress!ip flow-cache timeout active 1ip flow-export source GigabitEthernet0/2ip flow-export version 9ip flow-export destination 10.50.102.203 9995 << (CA NetQoS)ip flow-export destination 10.50.102.206 3000 << (Cisco NAM)!snmp-server community RO ROsnmp-server ifindex persist!Netflow Configuration on Branch20
BRANCH20-2921-1
interface GigabitEthernet0/0description *** LAN Interface ***ip address 172.17.2.1 255.255.255.0ip flow egress!interface Serial0/1/0:0description *** WAN-1 Interface ***ip address 101.1.2.1 255.255.255.252ip flow egress!interface Serial0/1/1:0description *** WAN-2 Interface ***ip address 102.1.2.1 255.255.255.252ip flow egress!ip flow-cache timeout active 1ip flow-export source GigabitEthernet0/0ip flow-export version 9ip flow-export destination 10.50.102.203 9995 << (CA NetQoS)ip flow-export destination 10.50.102.206 3000 << (Cisco NAM)!snmp-server community RO ROsnmp-server ifindex persist!Netflow Configuration Validation on Branch Routers
The show ip cache flow and show ip flow export commands can be used on the branch routers to verify the Netflow Configuration.
sh ip cache flowIP packet size distribution (316571186 total packets):1-32 64 96 128 160 192 224 256 288 320 352 384 416 448 480.000 .225 .147 .047 .005 .013 .030 .003 .021 .010 .005 .007 .002 .000 .001512 544 576 1024 1536 2048 2560 3072 3584 4096 4608.002 .001 .019 .014 .437 .000 .000 .000 .000 .000 .000IP Flow Switching Cache, 278544 bytes30 active, 4066 inactive, 4294803 added55186003 ager polls, 0 flow alloc failuresActive flows timeout in 1 minutesInactive flows timeout in 15 secondsIP Sub Flow Cache, 34056 bytes30 active, 994 inactive, 8107778 added, 4294784 added to flow0 alloc failures, 0 force free1 chunk, 12 chunks addedlast clearing of statistics neverProtocol Total Flows Packets Bytes Packets Active(Sec) Idle(Sec)-------- Flows /Sec /Flow /Pkt /Sec /Flow /FlowTCP-Telnet 58 0.0 39 98 0.0 16.6 11.0TCP-FTP 49 0.0 3 50 0.0 9.0 44.8TCP-WWW 3615941 3.3 49 1042 168.0 3.3 3.5TCP-SMTP 20 0.0 4 53 0.0 1.1 30.3TCP-X 2 0.0 8 414 0.0 0.4 1.3TCP-BGP 23882 0.0 1 49 0.0 2.8 15.4TCP-other 481821 0.4 184 293 82.9 19.6 9.1UDP-DNS 15797 0.0 1 77 0.0 2.6 15.4UDP-NTP 83907 0.0 1 76 0.0 0.0 15.4UDP-other 49370 0.0 45 171 2.0 55.0 5.6ICMP 2835 0.0 14 64 0.0 76.1 1.7GRE 9817 0.0 4615 279 42.3 116.4 0.7Total: 4283499 3.9 73 716 295.5 6.0 4.5SrcIf SrcIPaddress DstIf DstIPaddress Pr SrcP DstP PktsGi0/0 172.17.4.250 Gi0/2 10.2.101.105 06 4023 7108 2Gi0/0 172.17.4.250 Gi0/2 10.2.101.105 06 4026 7108 12Gi0/0 172.17.4.250 Gi0/2 10.2.101.105 06 4025 7108 2<SNIP>sh ip flow exportFlow export v9 is enabled for main cacheExport source and destination details :VRF ID : DefaultSource(1) 102.1.4.1 (GigabitEthernet0/2)Source(2) 102.1.4.1 (GigabitEthernet0/2)Destination(1) 10.50.102.203 (9995)Destination(2) 10.50.102.206 (3000)Version 9 flow records8602874 flows exported in 337654 udp datagrams0 flows failed due to lack of export packet0 export packets were sent up to process level0 export packets were dropped due to no fib1 export packets were dropped due to adjacency issues0 export packets were dropped due to fragmentation failures0 export packets were dropped due to encapsulation fixup failuresVisibility in Data Center—NetFlow Configuration
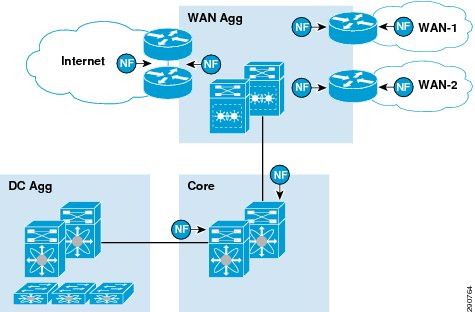
On the data center network, it is critical to select two places in the network to gather NetFlow statistics —WAN edge and core. Besides providing trending at various points in the network, capturing the NetFlow statistics at these two places provides an ability to understand traffic dynamics when traffic optimization (second component of Application Velocity) is introduced. For traffic flows from data center to branches, NetFlow at the WAN edge captures post optimization traffic statistics while NetFlow at core captures the pre-optimization statistics. The difference in data rates provides an insight into data reduction due to Cisco WAAS. For branch to data center traffic, this trend is obviously reversed.
Figure 19 NetFlow on DC Devices
Netflow Configuration on DC WAN Edge
WANEDGE-ASR-1
interface GigabitEthernet0/0/0description *** WAN Interface ***ip address 101.1.1.1 255.255.255.252ip flow egress!interface GigabitEthernet0/0/3description *** LAN Interface ***ip address 10.1.3.2 255.255.255.0ip flow egressstandby version 2standby 0 ip 10.1.3.1standby 0 preemptstandby 0 authentication md5 key-string ciscorouter!ip flow-cache timeout active 1ip flow-export source GigabitEthernet0/0/3ip flow-export version 9ip flow-export destination 10.50.102.203 9995ip flow-export destination 10.50.102.206 3000!snmp-server community RO ROsnmp-server ifindex persist!WANEDGE-ASR-2
interface GigabitEthernet0/0/0description *** WAN Interface ***ip address 102.1.1.1 255.255.255.252ip flow egress!interface GigabitEthernet0/0/3description *** LAN Interface ***ip address 10.1.3.3 255.255.255.0ip flow egressstandby version 2standby 0 ip 10.1.3.1standby 0 priority 105standby 0 preemptstandby 0 authentication md5 key-string ciscorouter!ip flow-cache timeout active 1ip flow-export source GigabitEthernet0/0/3ip flow-export version 9ip flow-export destination 10.50.102.203 9995ip flow-export destination 10.50.102.206 3000!snmp-server community RO ROsnmp-server ifindex persist!Netflow Configuration on Enterprise Core
In the enterprise core, NetFlow will be configured in the "ingress" direction to capture the traffic entering the core from different zones. The NxOS Netflow configuration is different than the IOS configuration. The following configuration was added to both the Core Nexus 7000s (only one of the Nexus 7000s is shown and unnecessary configuration was removed):
CORE-N7K-1
feature netflow << Feature Has to be Enabledflow timeout active 60flow timeout inactive 59flow timeout fast 64 threshold 30flow exporter NETFLOW << NetQoS RAdestination 10.50.102.203source Vlan3001version 9template data timeout 300option exporter-stats timeout 60flow exporter NAMdestination 10.50.102.206 << NAMtransport udp 3000source Vlan3001version 9template data timeout 300option exporter-stats timeout 60flow monitor NETFLOWrecord netflow-originalexporter NETFLOWexporter NAM!interface Vlan3001no shutdowndescription *** Connection between two Core Switches ***ip flow monitor NETFLOW inputip address 10.1.30.101/30ip router ospf 1 area 0.0.0.0!interface Ethernet1/1.3401description *** Connection to 1st Aggregation 7K ***encapsulation dot1q 3401ip flow monitor NETFLOW inputip address 10.1.30.1/30ip router ospf 1 area 0.0.0.0no shutdown!interface Ethernet1/2.3501description *** Connection to 2nd Aggregation 7K ***encapsulation dot1q 3501ip flow monitor NETFLOW inputip address 10.1.30.5/30ip router ospf 1 area 0.0.0.0no shutdown!interface Ethernet1/25.3101description *** Connection to 1st WAN Aggregation 6500 ***encapsulation dot1q 3101ip flow monitor NETFLOW inputip address 10.1.26.2/30ip router ospf 1 area 0.0.0.0no shutdown!interface Ethernet1/26.3201description *** Connection to 2nd WAN Aggregation 6500 ***encapsulation dot1q 3201ip flow monitor NETFLOW inputip address 10.1.27.2/30ip router ospf 1 area 0.0.0.0no shutdown!snmp-server community RO group vdc-operator!
Tip
Visibility—NAM Configuration
Now that the Netflow is configured to provide visibility into the traffic traversing over the WAN link and within the cata center network, Cisco NAM is deployed to serve two purposes:
•
•
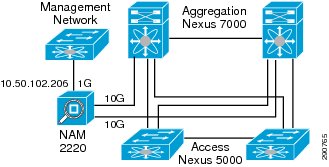
Since Nexus 7000 is used as an aggregation switch, the NAM 2220 Appliance was selected. NAM 2220 has two 10G interfaces, each of which is connected to each Nexus 7000. The Management Interface is connected to the DATA network—this interface (10.50.102.206) would be used to collect NetFlow Statistics.
Figure 20 NAM Connectivity Details
NAM Basic Configuration
The following configuration is entered via the NAM Console to enable network connectivity via the Web:
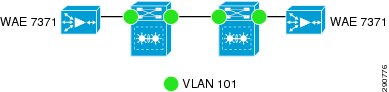
IP ADDRESS 10.50.102.206 255.255.255.128!IP HOST "DC28-NAM-1"!IP DOMAIN "SMT.COM"!IP GATEWAY 10.50.102.254!IP BROADCAST 10.50.102.255!IP NAMESERVER 10.50.101.101!EXSESSION ON << Enable Telent!SNMP COMMUNITY RO RO!SNMP NAME "DC28-NAM-1"!IP HTTP PORT 80!IP HTTP SERVER ENABLE << Enable HTTP!!TIMESYNC NTP 10.1.5.1ZONE ESTEXIT!SPAN Configuration for NAM —Aggregation Nexus 7000
Local SPAN was configured on Nexus 7000 to capture the traffic from server VLANs and direct it to the interface connected to the NAM.
monitor session 1description *** NAM-1 DATA INTERFACE ***source vlan 101,502,592 bothdestination interface Ethernet3/1no shut!interface Ethernet3/1description *** NAM-1 - DATA INTERFACE ***switchportswitchport monitorrate-mode dedicated forceno shutdown!Visibility—NetFlow Collector Setup
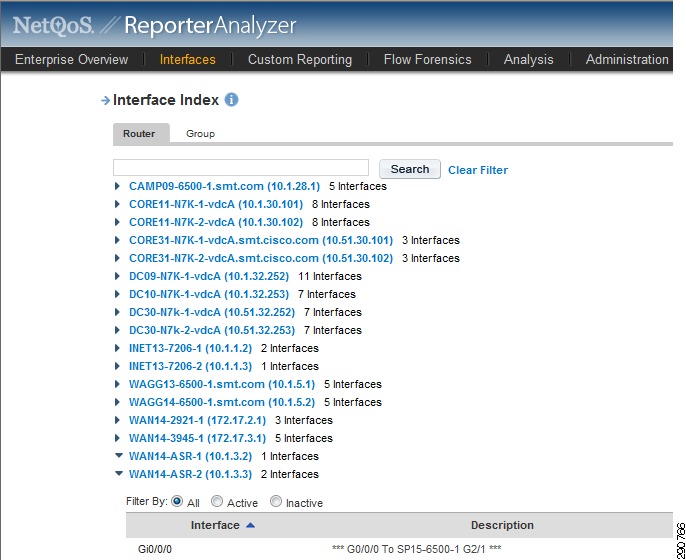
Reporter Analyzer
In CA NetQoS ReporterAnalyzer, the devices and interfaces start showing up within approximately 15 minutes. With SNMP read-only string configured, router names and interfaces are correctly identified.
Figure 21 NetQoS Reporter Analyzer—NetFlow Enabled Devices
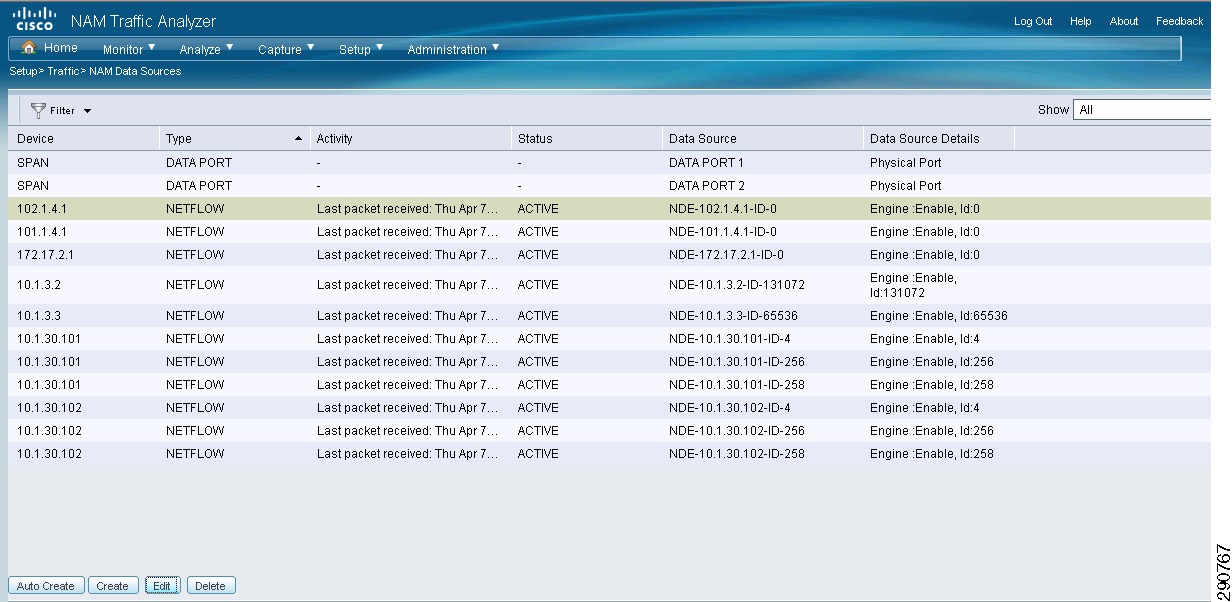
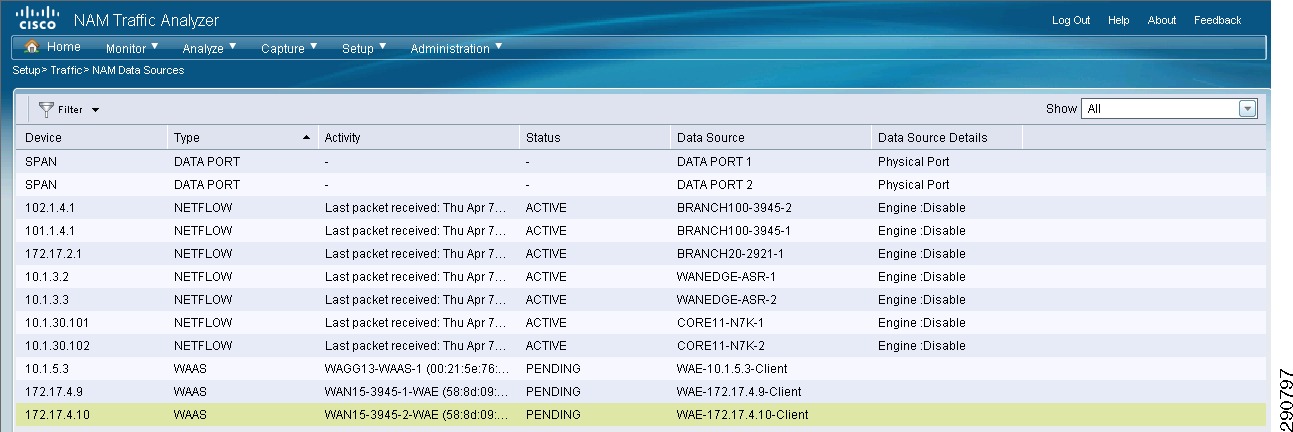
Cisco NAM
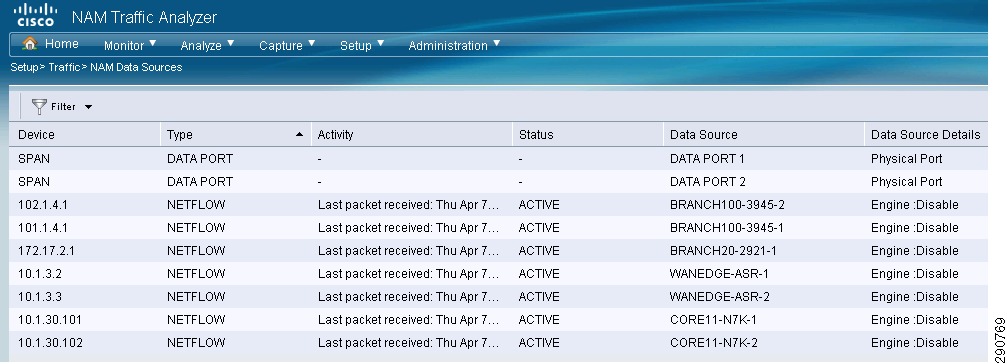
To set up NAM to receive NetFlow data, an additional configuration step is required. Since the NAM is configured with IP connectivity and all the network devices are already exporting NetFlow data to NAM, NAM shows you all the DATA sources if you browse to Setup->Traffic->NAM Data Sources.
Figure 22 NAM—Unconfirmed Data Sources
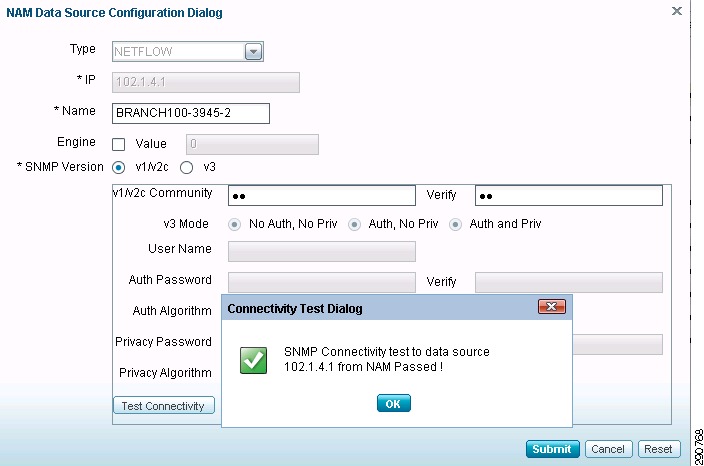
All the DATA sources under Type NetFlow should be selected and edited. The Name of the device should be entered along with the SNMP community parameter. Once this step is repeatedly performed, all the devices exporting Netflow to NAM are ready to be analyzed.
Figure 23 Editing a NetFlow Source in NAM
Tip
Figure 24 NAM—Netflow Sources Added
Visibility—NetFlow Collector Output
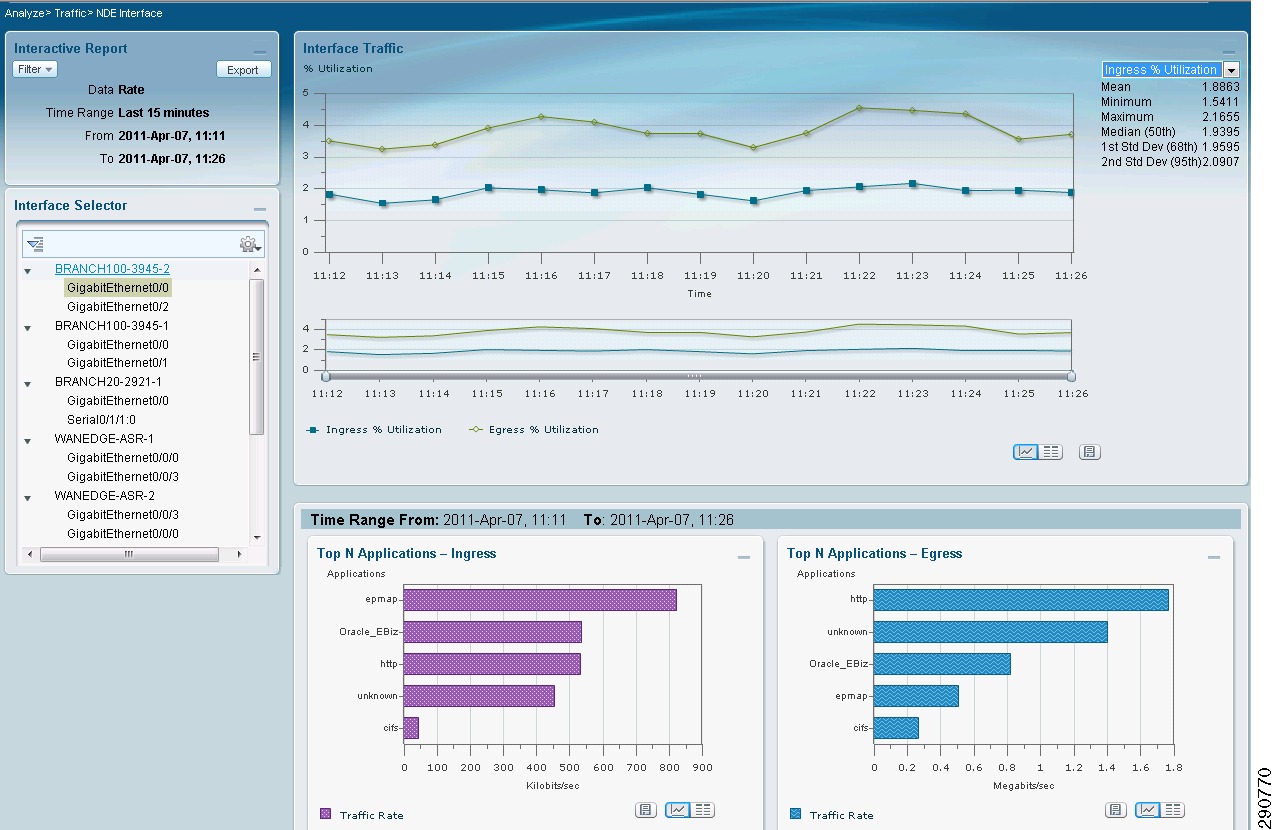
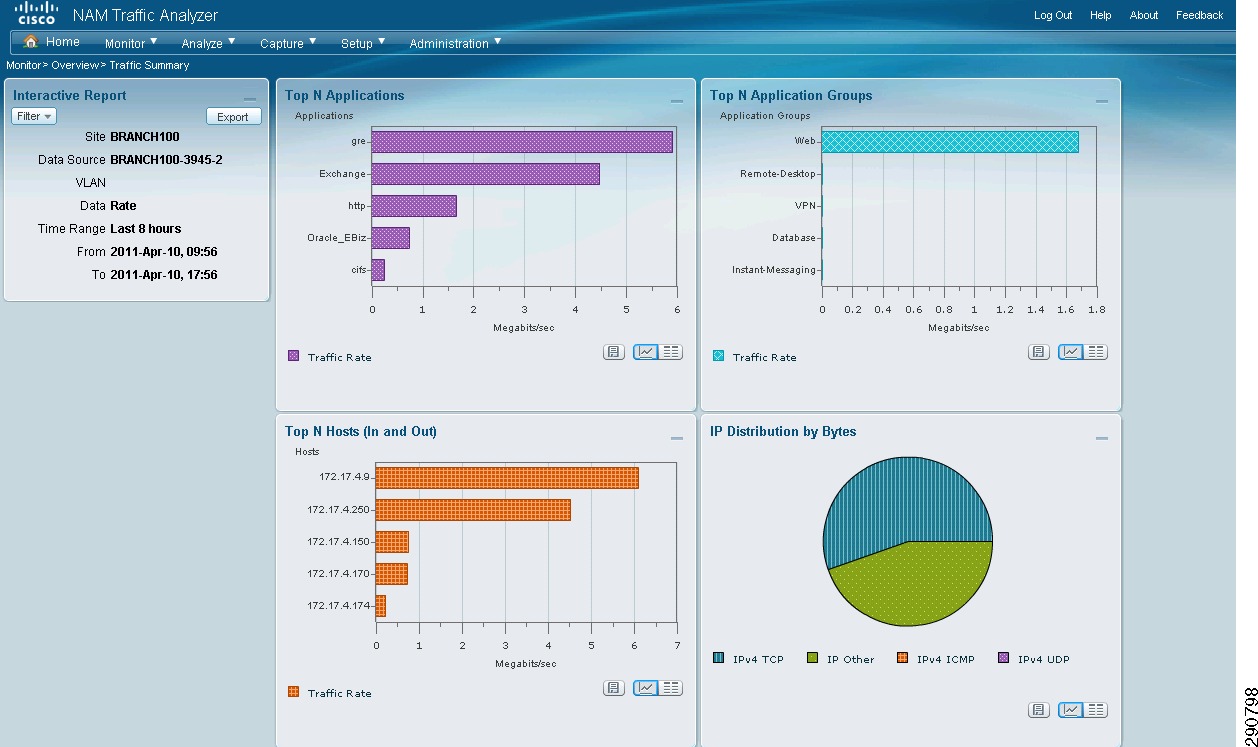
With NetFlow collection set up on the routers and switches and NetFlow collectors set up to receive these flows, Network Admins can gain most needed visibility into the traffic profiles at various predefined points in the network. Besides the usual advantage of gaining application visibility, the information provided by the NetFlow Collectors is invaluable for setting up initial QoS bandwidth parameters. Netflow Collectors can provide a lot of very useful information and provide the ability to drill down into the applications and host traffic. For the purpose of this document, captures from the interface are shown from both NAM and CA NetQoS.
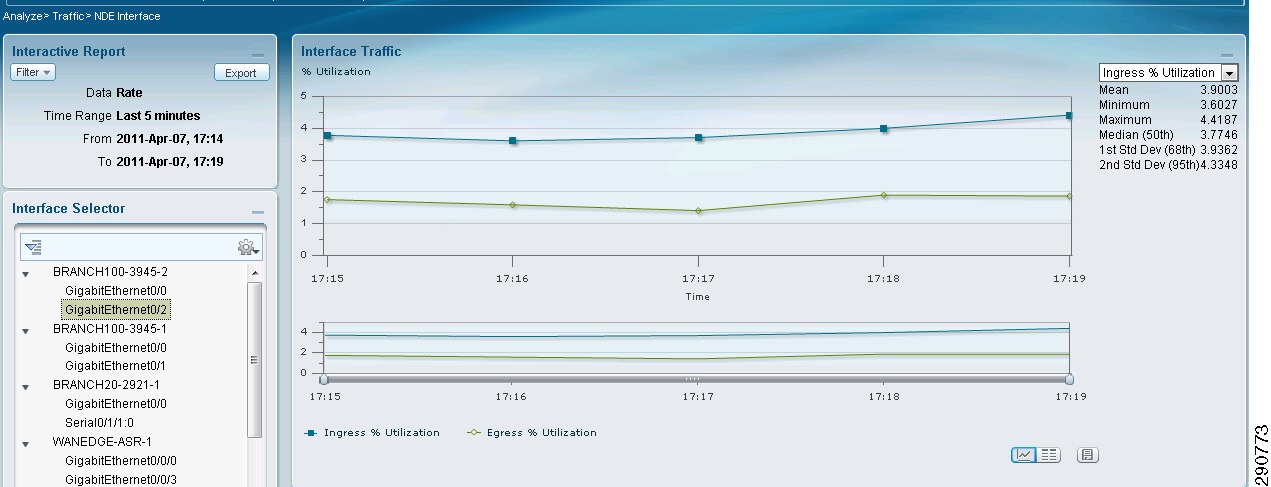
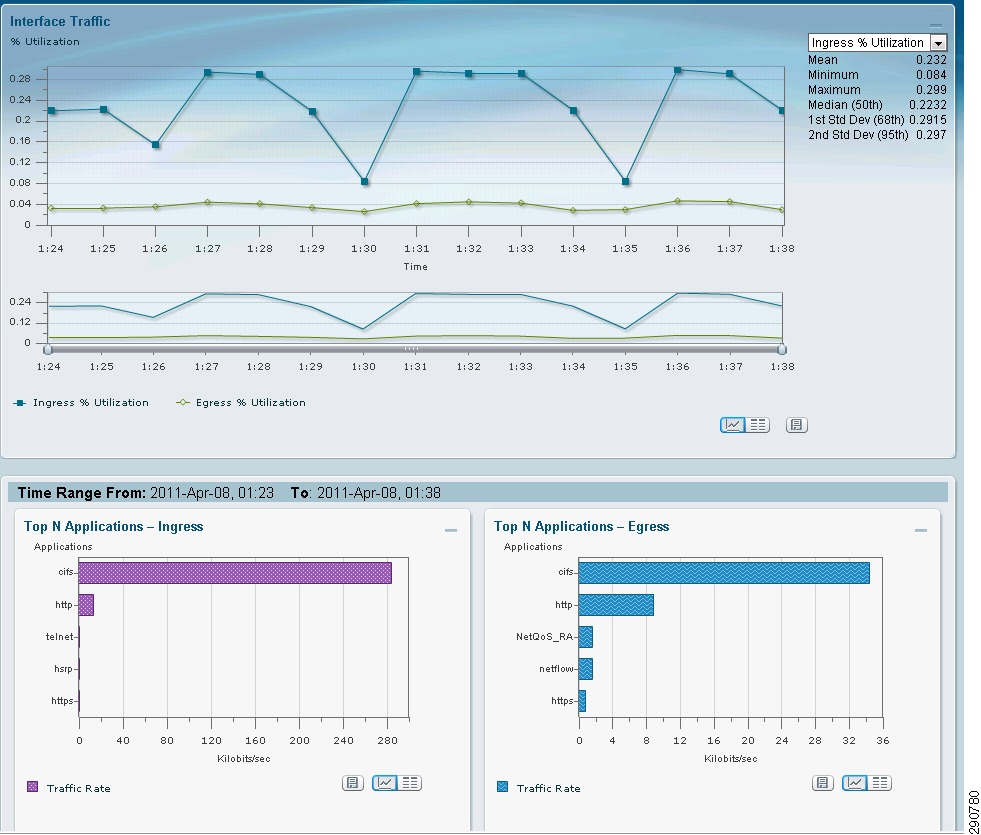
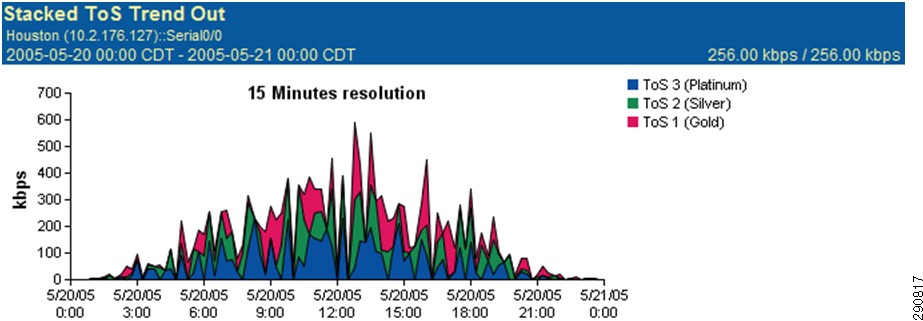
Figure 25 BRANCH100 Traffic on LAN Interface (Analyze -> Traffic -> NDE Interface)
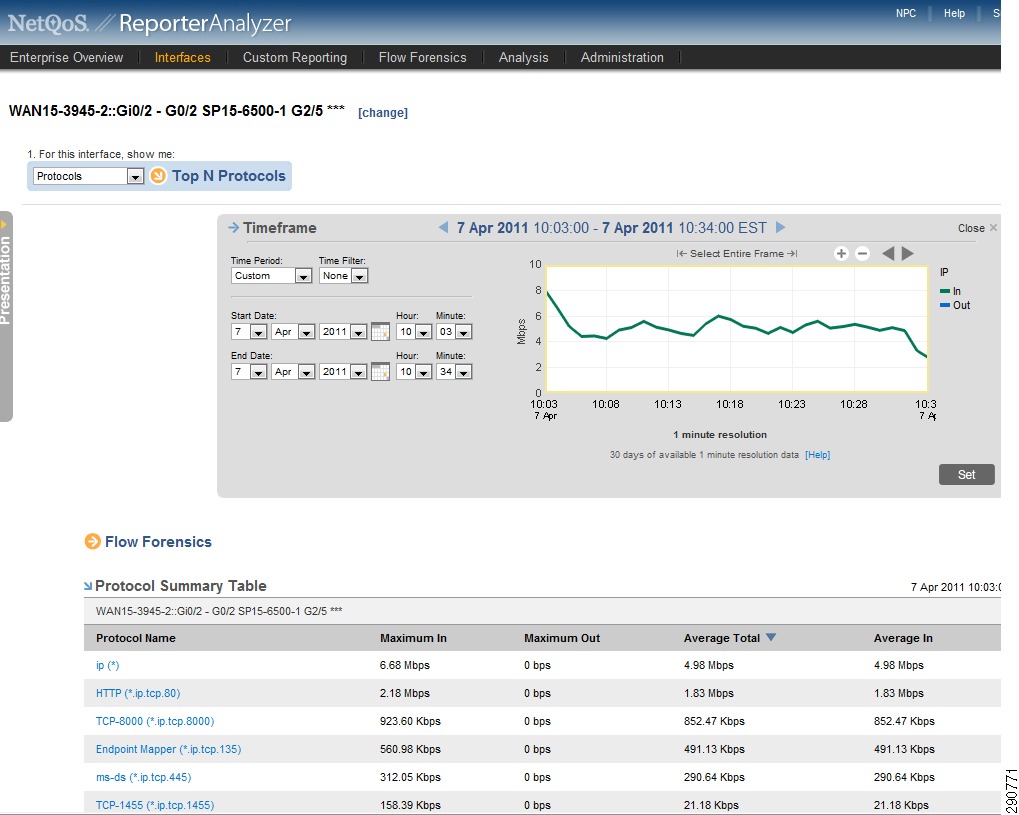
Figure 26 CA NetQoS ReporterAnalyzer—Protocol Breakdown
Control—QoS Configuration on the Branch
At the time of congestion, not all traffic should treated the same. Business critical traffic should be allocated reserved bandwidth and should be treated with some level of priority. Enterprise collaboration tools such as E-mail and SharePoint should be next in the priority list. Web traffic (unless it affects business bottom line) should be left in the default queue so that it can utilize the remaining bandwidth on the circuit. There are four unique traffic classes in this CVD. The DSCP values used are inline with Cisco SBA Architecture Guidelines.
QoS Policy
Traffic entering the LAN interface of the branch routers is identified and marked with appropriate DCSP values. Based on these DSCP values, the traffic is allocated the appropriate bandwidth on the WAN interface. Note that the bandwidth values allocated in the configuration are based on the traffic profile provided by the NetFlow (refer to Figure 25 for a breakdown of traffic). These values in many cases have to be fine tuned a couple of times based on user input.
Identify Traffic for Marking
Traffic can be identified using Access Control Lists (ACL) or by utilizing deep packet inspection capabilities provided by NBAR. In this CVD, the following methodology is showcased for various applications:
•
•
•
BRANCH ROUTER
ip access-list extended Exchangepermit ip 172.17.X.0 0.0.0.255 10.2.101.0 0.0.0.255!ip nbar custom OracleEBiz tcp 8000!class-map match-any SharePointmatch protocol http host "flexpodsp.smt.com"class-map match-any Exchangematch access-group name Exchangeclass-map match-any Oracle_EBizmatch protocol OracleEBiz!policy-map qos_markingclass SharePointset dscp af21class Exchangeset dscp af21class Oracle_EBizset dscp af31class class-defaultset dscp default!interface GigabitEthernet0/0description *** LAN Interface ***service-policy input qos_marking!To verify the packet markings:
show policy-map interface gigabitEthernet 0/0GigabitEthernet0/0Service-policy input: qos_markingClass-map: SharePoint (match-any)24299 packets, 27141305 bytes30 second offered rate 507000 bps, drop rate 0 bpsMatch: protocol http host "flexpodsp.smt.com"24299 packets, 27141305 bytes30 second rate 507000 bpsQoS Setdscp af21Packets marked 24299Class-map: Exchange (match-any)230290 packets, 74628912 bytes30 second offered rate 1355000 bps, drop rate 0 bpsMatch: access-group name Exchange230290 packets, 74628912 bytes30 second rate 1355000 bpsQoS Setdscp af21Packets marked 230290Class-map: Oracle_EBiz (match-any)85627 packets, 26803998 bytes30 second offered rate 567000 bps, drop rate 0 bpsMatch: protocol OracleEBiz85627 packets, 26803998 bytes30 second rate 567000 bpsQoS Setdscp af31Packets marked 85627Class-map: class-default (match-any)32798 packets, 4296602 bytes30 second offered rate 92000 bps, drop rate 0 bpsMatch: anyQoS Setdscp defaultPackets marked 32798These QoS/DSCP values can be verified on the NAM as well by looking at the Netflow Stats on the WAN interface of the WAN edge ASR.
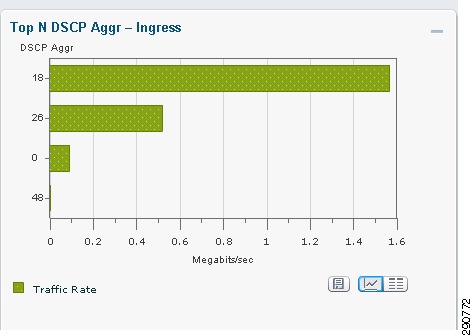
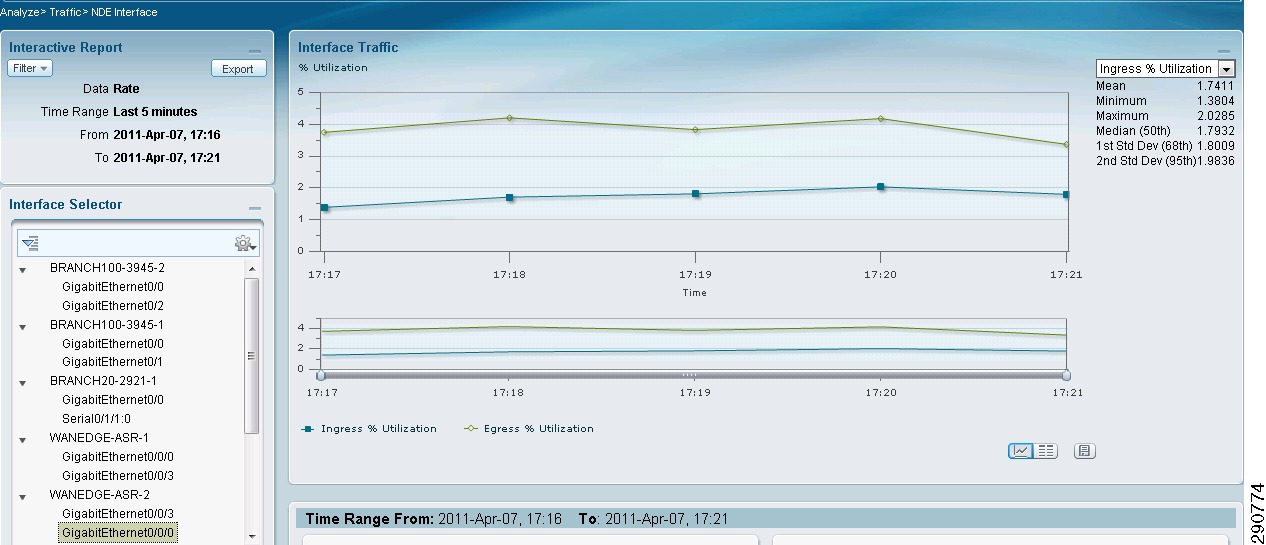
Figure 27 DSCP Distribution of Incoming Traffic on WAN Interface of DC ASR (NAM: Analyze -> Traffic -> NDE Interface)
Bandwidth Allocation on WAN
After the traffic is identified and marked, the following bandwidth is allocated to different traffic classes:
•
•
•
•
On Branch100, the WAN circuit is a 10Mbps link on each of the Cisco 3945 routers. The interface speed however is 1Gbps. A nested QoS policy is therefore utilized to shape the interface down to 10Mbps and then allocate the appropriate bandwidth values to different classes. On Branch20, the interface speed and available bandwidth are the same and therefore a shaper to lower the bandwidth is not required.
class-map match-any network_criticalmatch ip dscp cs2 cs6class-map match-all business_criticalmatch ip dscp af31class-map match-all bulk_datamatch ip dscp af21!policy-map outboundclass business_criticalbandwidth percent 30class bulk_databandwidth percent 40class network_criticalbandwidth percent 5!policy-map outbound_qosclass class-defaultshape average 10000000service-policy outbound!interface GigabitEthernet0/2description *** WAN Interface ***service-policy output outbound_qos!To verify the QoS policy on the WAN interface:
show policy-map interface gigabitEthernet 0/2GigabitEthernet0/2Service-policy output: outbound_qosClass-map: class-default (match-any)597458 packets, 214875279 bytes30 second offered rate 2896000 bps, drop rate 0 bpsMatch: anyQueueingqueue limit 64 packets(queue depth/total drops/no-buffer drops) 0/0/0(pkts output/bytes output) 598440/216290518shape (average) cir 10000000, bc 40000, be 40000target shape rate 10000000Service-policy : outboundClass-map: business_critical (match-all)141775 packets, 44182888 bytes30 second offered rate 567000 bps, drop rate 0 bpsMatch: ip dscp af31 (26)Queueingqueue limit 64 packets(queue depth/total drops/no-buffer drops) 0/0/0(pkts output/bytes output) 141775/44182888bandwidth 30% (3000 kbps)Class-map: bulk_data (match-all)404666 packets, 164209328 bytes30 second offered rate 2248000 bps, drop rate 0 bpsMatch: ip dscp af21 (18)Queueingqueue limit 64 packets(queue depth/total drops/no-buffer drops) 0/0/0(pkts output/bytes output) 404666/164209328bandwidth 40% (4000 kbps)Class-map: network_critical (match-any)23 packets, 17261 bytes30 second offered rate 1000 bps, drop rate 0 bpsMatch: ip dscp cs2 (16) cs6 (48)23 packets, 17261 bytes30 second rate 1000 bpsQueueingqueue limit 64 packets(queue depth/total drops/no-buffer drops) 0/0/0(pkts output/bytes output) 23/1536bandwidth 5% (500 kbps)Class-map: class-default (match-any)50994 packets, 6465802 bytes30 second offered rate 78000 bps, drop rate 0 bpsMatch: anyqueue limit 64 packets(queue depth/total drops/no-buffer drops) 0/0/0(pkts output/bytes output) 51976/7896766!Control—QoS Configuration on the DC WAN Edge
On the branch network, the traffic entering the LAN interface of the branch routers was identified and marked with appropriate DCSP values. On the data center side, the marking should be performed as close to the servers as possible. An access switch or the server itself is the best place to mark the appropriate DSCP value for the traffic. If the traffic cannot be marked with DSCP values at the access layer, it is possible to mark the traffic on the ASR 1000 WAN edge routers and the configuration will be very similar to the branch configuration as shown above. It should however be noted that the identification parameter and ACLs will be different since traffic flow is reversed. For the purpose of this CVD, it is assumed traffic is already marked when it reached the LAN segment of the WAN edge ASR. The bandwidth allocation is same as branch allocation.
class-map match-any network_criticalmatch ip dscp cs2 cs6class-map match-all business_criticalmatch ip dscp af31class-map match-all bulk_datamatch ip dscp af21!policy-map outboundclass business_criticalbandwidth percent 30class bulk_databandwidth percent 40class network_criticalbandwidth percent 5!To verify the QoS policy on the WAN interface:
show policy-map interface gig0/0/0GigabitEthernet0/0/0Service-policy output: outboundClass-map: business_critical (match-all)641495 packets, 359514287 bytes5 minute offered rate 861000 bps, drop rate 0000 bpsMatch: ip dscp af31 (26)Queueingqueue limit 1249 packets(queue depth/total drops/no-buffer drops) 0/0/0(pkts output/bytes output) 643472/360609693bandwidth 30% (300000 kbps)Class-map: bulk_data (match-all)1861297 packets, 1452204015 bytes5 minute offered rate 3266000 bps, drop rate 0000 bpsMatch: ip dscp af21 (18)Queueingqueue limit 1666 packets(queue depth/total drops/no-buffer drops) 0/0/0(pkts output/bytes output) 1866782/1456664309bandwidth 40% (400000 kbps)Class-map: network_critical (match-any)116 packets, 7440 bytes5 minute offered rate 0000 bps, drop rate 0000 bpsMatch: ip dscp cs2 (16) cs6 (48)Queueingqueue limit 208 packets(queue depth/total drops/no-buffer drops) 0/0/0(pkts output/bytes output) 116/7440bandwidth 5% (50000 kbps)Class-map: class-default (match-any)631688 packets, 780238560 bytes5 minute offered rate 1929000 bps, drop rate 0000 bpsMatch: anyqueue limit 4166 packets(queue depth/total drops/no-buffer drops) 0/0/0(pkts output/bytes output) 634049/783369168Network Statistics
In order to create a baseline for the Branch100 traffic, a 100 user workload was defined as follows:
•
•
•
•
With visibility into the branch and data center networks, the traffic patterns in Table 8 were identified.
Table 8 Round Trip WAN Delay for Various Applications
Oracle E-Business
75
SharePoint
75
Exchange
75
Web
75
Figure 28 WAN Interface Statistics of Branch100
With traffic generation only from Branch100, the same statistics were observed on the data center ASR.
Figure 29 WAN Interface Statistics for DC ASR
With traffic profile set and traffic trending captured, this traffic can be optimized and accelerated using Cisco WAAS. Cisco WAAS not only reduced the amount of bandwidth required on the WAN links, but also improves the latency on the WAN networks.
Application Acceleration and Optimization
In Application Velocity, WAAS plays a vital role for optimizing and accelerating the traffic over the WAN links. For the CVD, WAE-7371 appliances are deployed in the data center and SRE-900 is deployed in the Branch100. vWAAS, a VM appliance running on ESX Server, acts as a Central Manager. On Branch20 WAAS Express (an IOS function) is utilized.
Cisco WAAS offers advance WAN optimization functionality. Features like Transport flow optimization (TFO) will improve wide area network throughput. Ddata redundancy elimination (DRE) will optimize the WAN bandwidth and improve application performance. Persistent LZ (PLZ) compression will provide a connection-oriented compression and application-specific acceleration of Common Internet File system (CIFS), Microsoft Outlook messaging API (MAPI), and HTTP applications (Oracle and Microsoft SharePoint) will enhance the user experience.
This CVD provides guidance for designing the WAAS infrastructure and highlights the advantages of using WAAS in the Application Velocity framework. For low level deployment details of WAAS infrastructure, consult the WAAS design guides.
Acceleration and Optimization in Branch Network
Branch100 Configuration
Both the 3945s in the Branch100 are equipped with Service Ready Engine 900 (SRE-900). WAAS 4.3.1 was installed on the SREs.
Tip
Configuration of SRE is done in two steps:
•
•
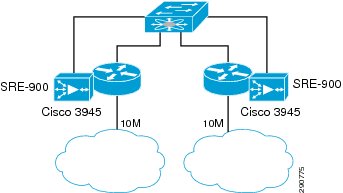
SRE-900 is equipped with an internal and an external interface. In this design, the external interface was defined as the primary interface and used for optimization traffic. It must however be pointed out that when an external interface is utilized, SRE has to be cabled to the branch switch as shown in Figure 30.
Figure 30 Branch100—SRE Physical Connectivity
There are two main advantages of this topology:
•
•
SRE—Router Configuration
As mentioned before, the IP address and gateway configuration for SRE is performed on the router. Based on the topology shown in Figure 30, the following configuration is added to both of the branch routers:
Branch100-3945-1
interface SM1/0ip unnumbered GigabitEthernet0/0/0service-module external ip address 172.17.4.9 255.255.255.0service-module ip address 172.26.162.114 255.255.0.0service-module ip default-gateway 172.17.4.1endBranch100-3945-2
interface SM1/0ip unnumbered GigabitEthernet0/0/0service-module external ip address 172.17.4.10 255.255.255.0service-module ip address 172.26.162.115 255.255.0.0service-module ip default-gateway 172.17.4.1hold-queue 60 outendSRE—WAAS Configuration
After configuring SRE interface on routers, SRE WAAS configuration can be performed by opening a session to the SRE modules and configuring basic WAAS parameters. This has to be repeated for both of the SREs.
service-module SM1/0 sessionTrying 172.26.162.142, 2067 ... OpenCisco Wide Area Application Engine ConsoleUsername: adminPassword: default << Initial PasswordSystem Initialization Finished.WAN15-3945-1-WAE#show license << Verify LicenseLicense Name Status Activation Date Activated By-------------- ----------- --------------- --------------Transport not activeEnterprise active 03/03/2011 adminVideo not activehostname WAN15-3945-1-WAEclock timezone EST -5 0primary-interface GigabitEthernet 2/0!interface GigabitEthernet 1/0ip address 172.26.162.114 255.255.0.0exitinterface GigabitEthernet 2/0ip address 172.17.4.9 255.255.255.0exit!!ip default-gateway 172.17.4.1!ntp server 10.1.5.1!wccp router-list 1 172.17.4.2 172.17.4.3 << Register to both Routerswccp tcp-promiscuous router-list-num 1wccp version 2!egress-method negotiated-return intercept-method wccp!central-manager address 10.50.102.201 << Central Manager's Addresscms enable << Enable Mgmt Servicesshow cms infoDevice registration information :Device Id = 4306Device registered as = WAAS Application EngineCurrent WAAS Central Manager = 10.50.102.201Registered with WAAS Central Manager = 10.50.102.201Status = OnlineTime of last config-sync = Thu Apr 7 22:30:54 2011CMS services information :Service cms_ce is runningWCCP—Router Configuration
For redirecting the traffic to WAAS for optimization, Web Cache Communication Protocol (WCCP) is configured. WCCP captures the interesting traffic at both LAN and WAN interfaces and redirects the traffic to registered WAAS devices (SREs at branch). Configuring an ACL to restrict the amount of redirected traffic is highly desirable.
!ip access-list extended WAAS_REDIRECT_61permit tcp 172.17.0.0 0.0.255.255 10.0.0.0 0.255.255.255ip access-list extended WAAS_REDIRECT_62permit tcp 10.0.0.0 0.255.255.255 172.17.0.0 0.0.255.255!ip wccp 61 redirect-list WAAS_REDIRECT_61ip wccp 62 redirect-list WAAS_REDIRECT_62!interface GigabitEthernet0/0description *** LAN Interface ***ip wccp 61 redirect in!interface GigabitEthernet0/2description *** WAN Interface ***ip wccp 62 redirect in!WCCP Verification:
show ip wccpGlobal WCCP information:Router information:Router Identifier: 172.26.162.143Protocol Version: 2.0Service Identifier: 61Number of Service Group Clients: 2Number of Service Group Routers: 2Total Packets s/w Redirected: 41492169Process: 759CEF: 41491410Service mode: OpenService Access-list: -none-Total Packets Dropped Closed: 0Redirect Access-list: WAAS_REDIRECT_61Total Packets Denied Redirect: 616034Total Packets Unassigned: 12811Group Access-list: -none-Total Messages Denied to Group: 0Total Authentication failures: 0Total GRE Bypassed Packets Received: 91834069Service Identifier: 62Number of Service Group Clients: 2Number of Service Group Routers: 2Total Packets s/w Redirected: 19968924Process: 612CEF: 19968312Service mode: OpenService Access-list: -none-Total Packets Dropped Closed: 0Redirect Access-list: WAAS_REDIRECT_62Total Packets Denied Redirect: 259374Total Packets Unassigned: 14569Group Access-list: -none-Total Messages Denied to Group: 0Total Authentication failures: 0Total GRE Bypassed Packets Received: 23428825WAAS Express Configuration
Validate license:
show license featureFeature name Enforcement Evaluation Subscription Enabledipbasek9 no no no yessecurityk9 yes yes no nouck9 yes yes no yesdatak9 yes yes no yesgatekeeper yes yes no noSSL_VPN yes yes no noios-ips-update yes yes yes noSNASw yes yes no nohseck9 yes no no nocme-srst yes yes no noWAAS_Express yes yes no no!Enable WAAS:
interface Serial0/1/0:0description *** WAN-1 Interface ***waas enable!interface Serial0/1/1:0description *** WAN-2 Interface ***waas enable!Registering WAAS Express with Central Manager:
crypto pki trustpoint waasxenrollment selfsignedrevocation-check crl!crypto pki enroll waasxApr 8 10:31:37.282: %CRYPTO-6-AUTOGEN: Generated new 512 bit key pair% Include the router serial number in the subject name? [yes/no]: no% Include an IP address in the subject name? [no]: noGenerate Self Signed Router Certificate? [yes/no]: yesRouter Self Signed Certificate successfully created!ip http authentication localip http secure-serverip http secure-trustpoint WAASXip http client source-interface GigabitEthernet0/0username <HTTPS_Username> priv 15 password <HTTPS_Passowrd>Ensure that the WAAS CM is configured with credentials to access the router. On WAAS CM, navigate to My WAN -> Admin Drawer -> WAAS Express Credentials. Enter <HTTPS_Username> and <HTTPS_Password>
On WAAS CM's CLI:
show crypto certificate-detail adminCopy PEM certificate information(Between and including -----BEGIN CERTIFICATE----- and -----END CERTIFICATE----- )On router:
crypto pki trustpoint wcmenrollment terminal pemexitcrypto pki authenticate wcm<Follow directions, paste certificate in from step a. ><Accept certificate>waas cm-register https://10.50.102.201:8443/wcm/register%WAAS-6-WAAS_CM_REGISTER_SUCCESS: IOS-WAAS registered with Central Manager successfullyValidate WAAS Status
show waas statusIOS Version: 15.1(3)TWAAS Express Version: 1.1.0WAAS Enabled Interface Policy MapSerial0/1/0:0 waas_globalSerial0/1/1:0 waas_globalWAAS Feature LicenseLicense Type: PermanentDRE Status : EnabledLZ Status : Enabled + EntropyMaximum Flows : 250Total Active connections : 0Total optimized connections : 0!Validation:
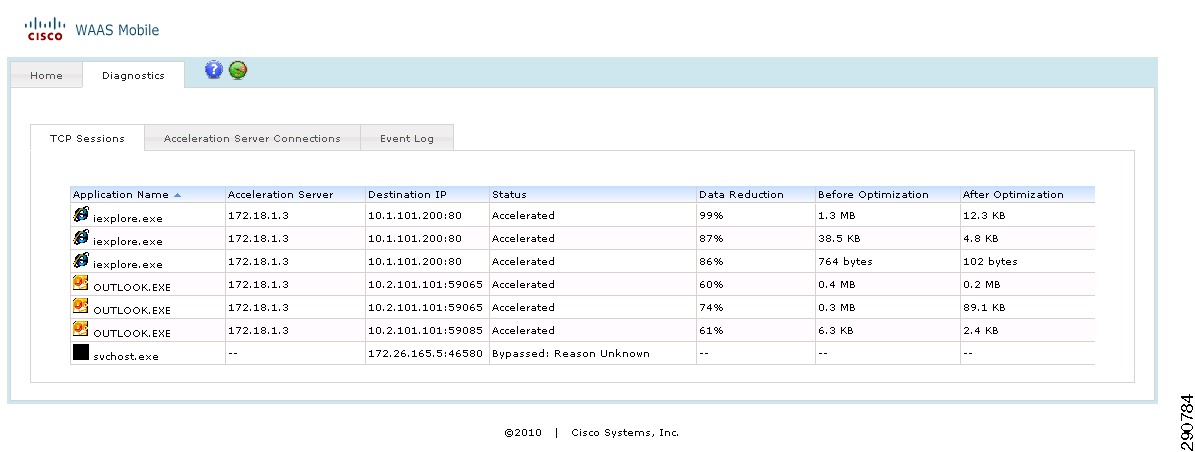
show waas connectionConnID Source IP:Port Dest IP:Port PeerID Accel5438 172.17.2.151 :36290 10.50.101.102 :49155 0021.5e76.2430 TLD5267 172.17.2.171 :61214 10.41.102.136 :8000 0021.5e76.2430 TLD5268 172.17.2.171 :61218 10.41.102.136 :8000 0021.5e76.2430 TLD5269 172.17.2.171 :61221 10.41.102.136 :8000 0021.5e76.2430 TLD5270 172.17.2.171 :61224 10.41.102.136 :8000 0021.5e76.2430 TLD5271 172.17.2.171 :61227 10.41.102.136 :8000 0021.5e76.2430 TLD5272 172.17.2.171 :61230 10.41.102.136 :8000 0021.5e76.2430 TLD5273 172.17.2.171 :61233 10.41.102.136 :8000 0021.5e76.2430 TLD5274 172.17.2.171 :61236 10.41.102.136 :8000 0021.5e76.2430 TLD5275 172.17.2.171 :61239 10.41.102.136 :8000 0021.5e76.2430 TLD5276 172.17.2.171 :61242 10.41.102.136 :8000 0021.5e76.2430 TLD!show waas statistics dreDRE Status: EnabledCacheCache Status: ReadyOldest data age: 02:51:55Total data storage size: 1468006400Total index size: 11513600WaitQ size: 0WaitQ in storage: 0ConnectionsTotal: 2340Active: 10Encode StatisticsDre msgs: 0Bytes in: 0Bytes out: 0Bypass bytes: 78386407Compression gain: 0%Average latency: 2 usecDecode StatisticsDre msgs: 129950Nacks generated: 0Bytes in: 130889010Bytes out: 466710102Bypass bytes: 0Compression gain: 71%Average latency: 158 usecDecode Message Size Distribution:0-1K = 81 %1-5K = 2 %5-15K = 7 %15-25K = 3 %25-40K = 2 %>40K = 1 %Acceleration and Optimization in Data Center Network
On the data center network, WAEs are connected to the 6500 on a common LAN segment. As in the branch, this configuration provides both high availability and load balancing.
Figure 31 DC 6500 WAN Aggregation to WAE 7371 Connectivity
Note
WAE 7371 Configuration
WAE 7371 configuration is very similar to SRE configuration. Unlike SRE, there is no interface (SM) configuration on the 6500s. On 6500, WCCP configuration is also very similar to the branch configuration—WCCP service 61 is applied on all data center-acing interfaces and WCCP service 62 is applied to all the WAN-facing interfaces. Using Redirection ACL is also recommended. WAE 7371 supports a standard console port for initial configuration.
show licenseLicense Name Status Activation Date Activated By-------------- ----------- --------------- --------------Transport not activeEnterprise active 01/31/2011 adminVideo not activehostname WAGG13-WAAS-1!clock timezone EST -5 0!primary-interface GigabitEthernet 2/0!interface GigabitEthernet 1/0ip address 172.26.162.125 255.255.0.0exitinterface GigabitEthernet 2/0ip address 10.1.5.3 255.255.255.0exit!ip default-gateway 10.1.5.1!ntp server 172.26.162.9!wccp router-list 1 10.1.5.1 10.1.5.2! default wccp mask is src-ip-mask 0xf00 dst-ip-mask 0x0wccp tcp-promiscuous router-list-num 1 l2-redirect mask-assignwccp version 2!egress-method negotiated-return intercept-method wccp!central-manager address 10.50.102.201cms enable!HTTP Application Optimization (AO) Features
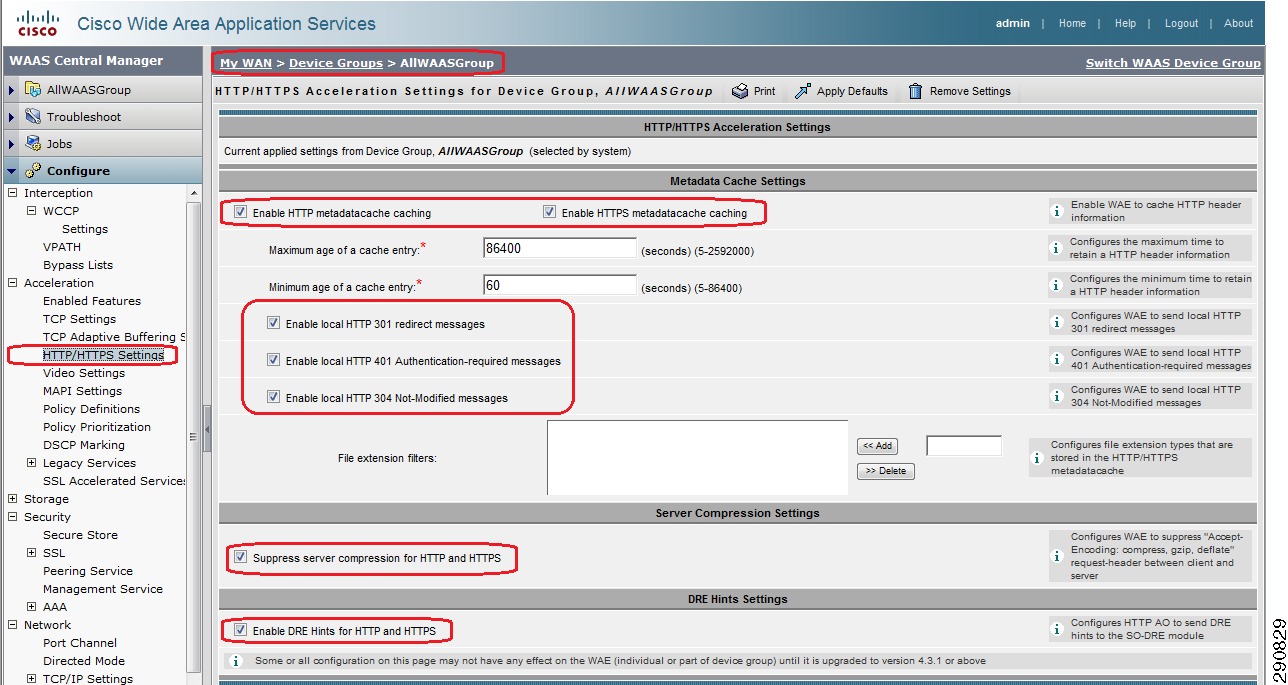
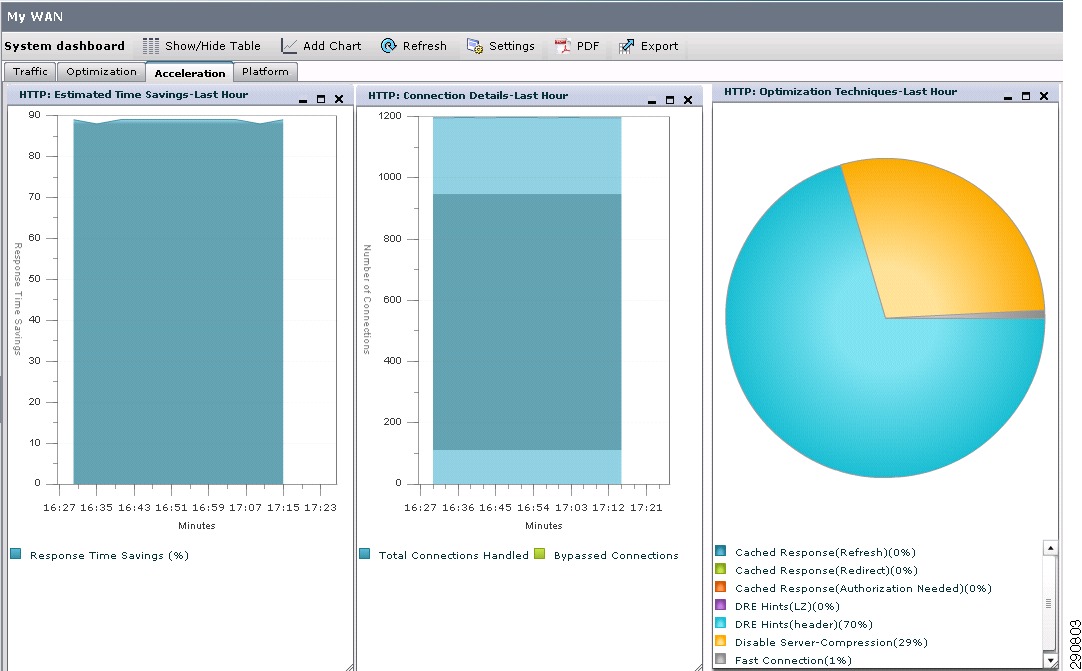
HTTP Application Optimization Features in WAAS are not turned on by default. Three out of four applications covered in this CVD use HTTP over the network. It is therefore important to enable these features and the easiest way to do so is by using the WAAS CM.
Figure 32 HTTP Application Optimization (AO) Features
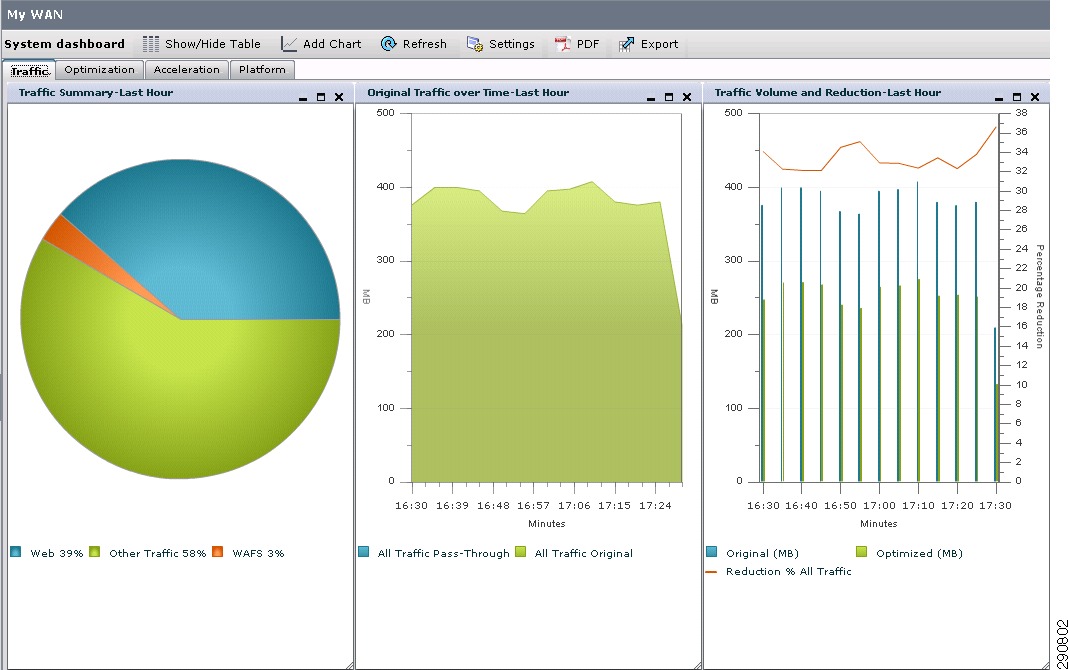
Optimization Statistics
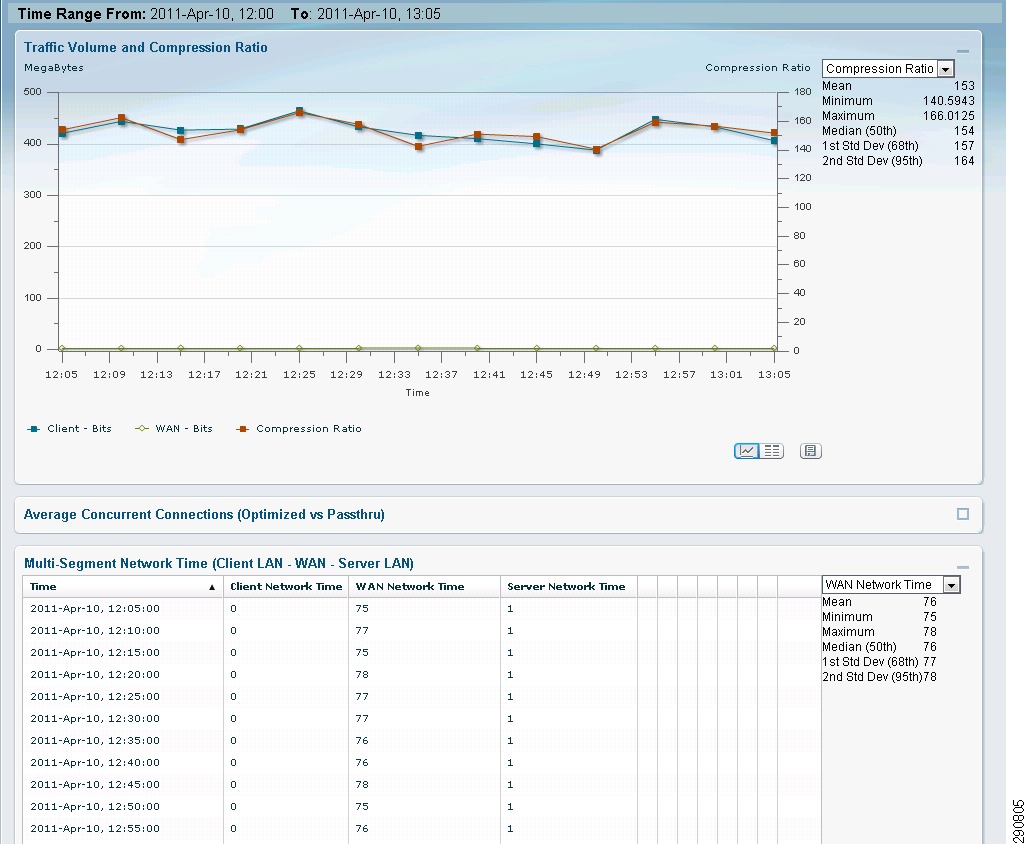
After configuring both the branch and data center, traffic will begin to be optimized. The amount and type of traffic being optimized can be viewed using Central Manager GUI or looking at NetFlow statistics pre- and post-optimization.
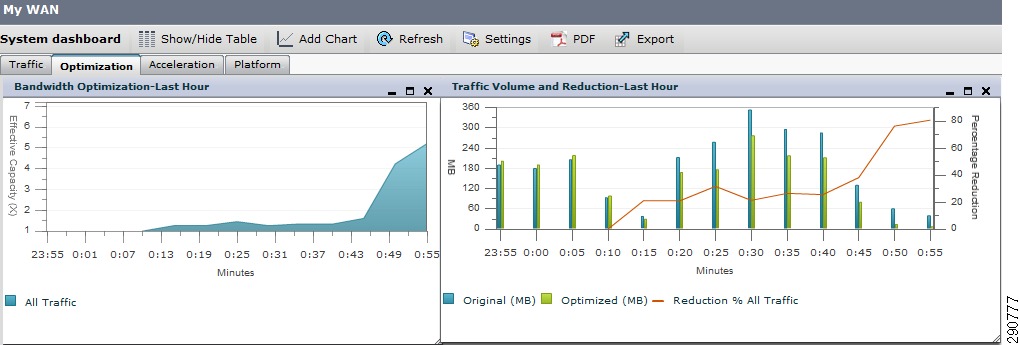
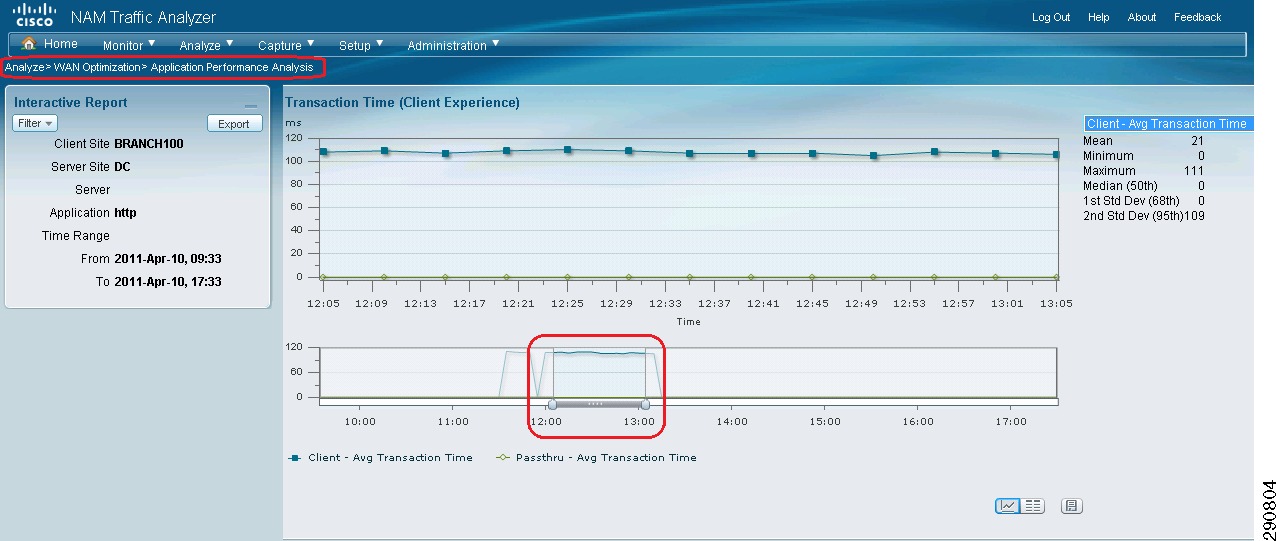
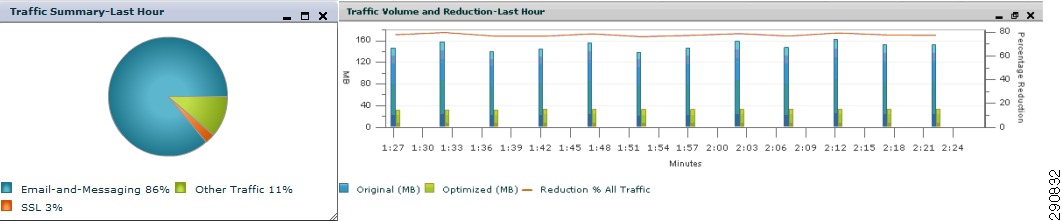
The capture from WAAS CM in Figure 33 shows optimization statistics for the traffic profile of Branch100 immediately after optimization was turned on:
Figure 33 WAAS Central Manager Statistics—Immediately after Turning on WAAS
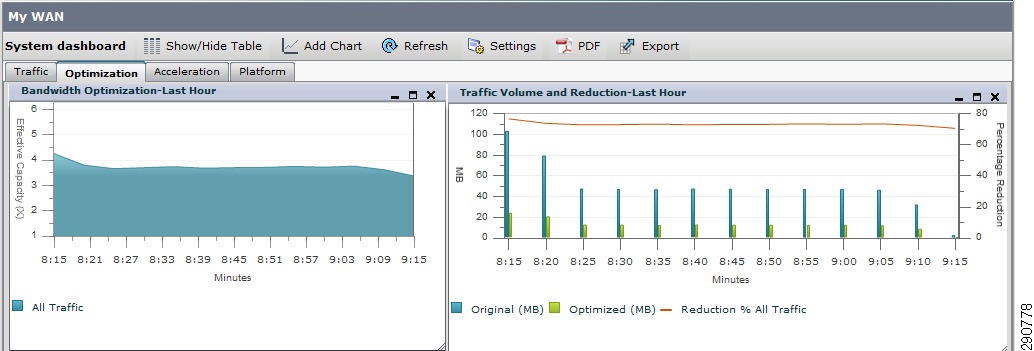
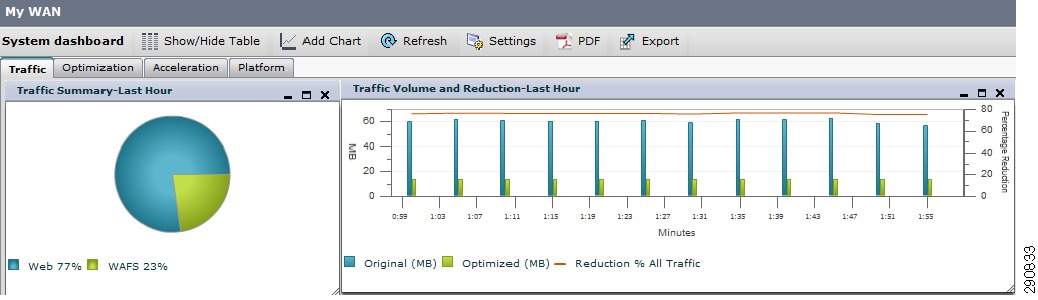
Figure 34 WAAS Central Manager Statistics—Typical Day Time
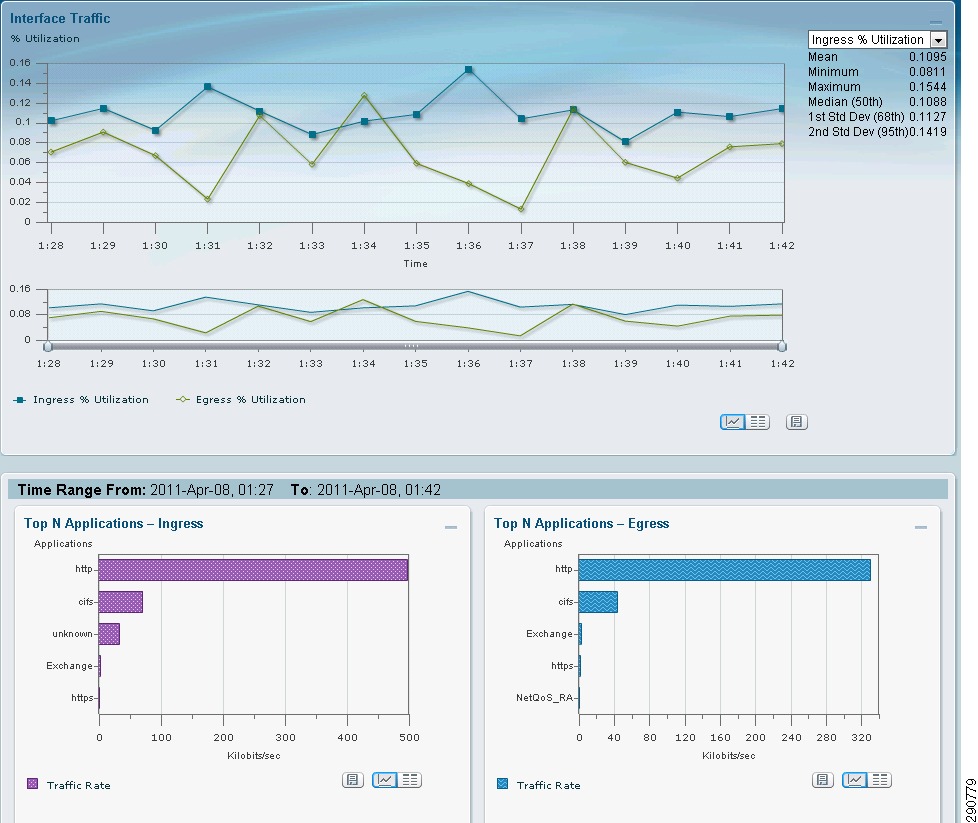
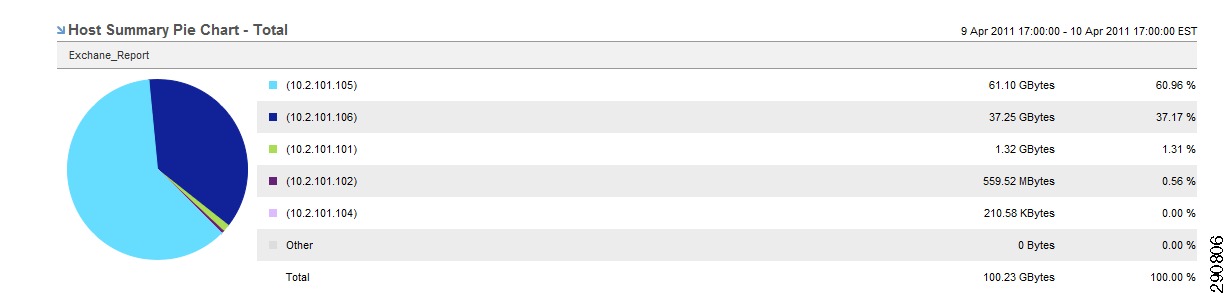
Figure 35 and Figure 36 show Netflow statistics captured at the data center core (pre-optimization) and on the WAN edge ASR (post optimization) to show the reduction in the amount of SharePoint traffic.
Figure 35 Netflow Data Captured at DC Connected Interface of Enterprise Core
As shown in the capture in Figure 35, the pre-optimization data rate of SharePoint traffic is approximately 550 kbps.
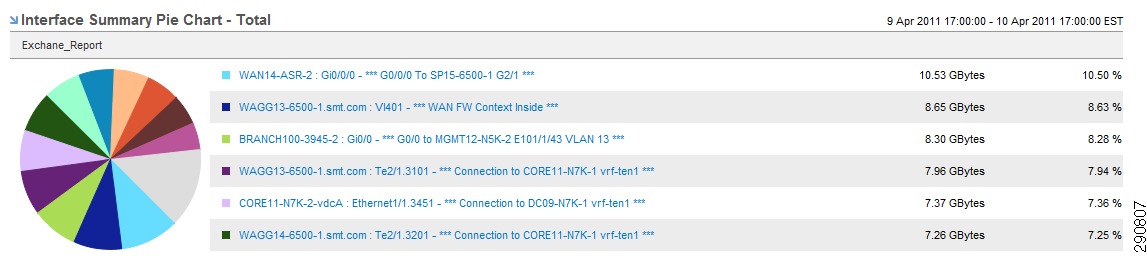
Figure 36 NetFlow Captured on the LAN Interface of WAN Edge ASR
In the second capture in Figure 36, the post-optimization data rate of SharePoint traffic is approximately 290 kbps, effectively reducing the traffic by about 45%.
Acceleration and Optimization for Telecommuters
Cisco WAAS Mobile Server can be installed on Windows 2003 or 2008 Server. WAAS Mobile server comes with a 30-day trial license.
You can find the WAAS Mobile installation Guide at:
http://www.cisco.com/en/US/docs/app_ntwk_services/waas/waas_mobile/v3.4/configuration/administration/guide/CiscoWAASMobile_AG3.4.pdf.Once WAAS Mobile Server is installed, users can follow a URL (example shown below) to download and install the client.
http://<CM_IP>/ClientDistributions/WAASMobileClient_Default_2626.msi
Administrators can log into the WAAS Mobile Server GUI to verify the server status and clients connected to make changes.
Figure 37 WAAS Mobile Dashboard
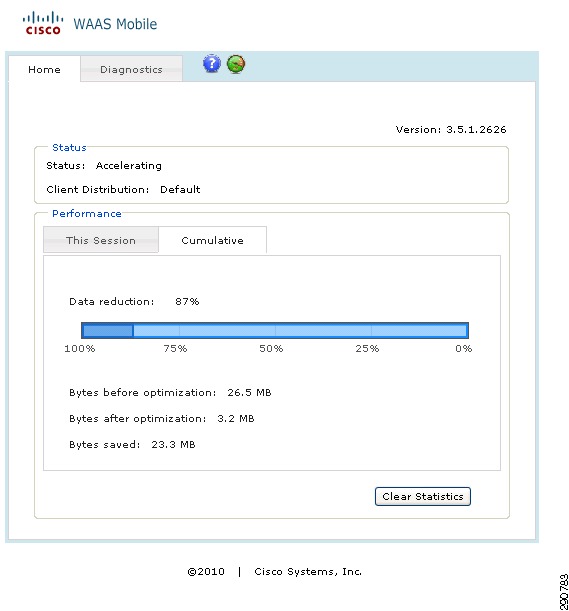
WAAS Mobile server also provides statistics for the connected clients including PC profile (CPU, memory, etc.) as well as data optimization statistics.
Figure 38 WAAS Mobile Server—Client Optimization Statistics
Users can also get similar statistics on their client PCs:
Figure 39 WAAS Mobile Client Statistics—Overview
Figure 40 WAAS Mobile Client Statistics—Details
Network and Application Agility
The last component of Application Velocity is agility or the ability to offer the capability to quickly deploy applications and simplify their management. By integrating deployment of applications into virtual machines running within branch routers,, a series of benefits occur, such as energy and footprint efficiency, fewer IT personal requirements, rapid replication, and initial deployment. Additionally, by providing the branch with a smart routing capability which identifies and routes business critical data over preferred WAN links, dual-WAN utilization is improved and chances of congestion are mitigated. In this CVD, deploying UCS Express with DHCP and DNS services and deploying Performance Routing (PfR) to route Oracle E-Business traffic over low-latency WAN provides the benefits of agility to the branch network.
Deploying UCS Express
The UCS Express system consists of the following components:
•
•
•
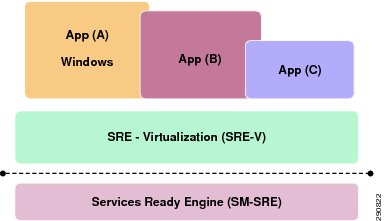
Cisco SRE-V is a branch-office infrastructure platform that combines computing, networking, storage, virtualization, and unified management into a cohesive system. It enables the VMware vSphere Hypervisor™ to be provisioned on a Cisco Services Ready Engine (SRE) Service Module and host one or more virtual machines running Microsoft Windows Server operating system.
Note
Figure 41 UCS Express—Components Overview
Deployment Considerations
Planning to deploy UCS Express starts with understanding various IP addresses required on UCS Express. It is also important to understand the logical topology.
Figure 42 UCS Express IP Configuration
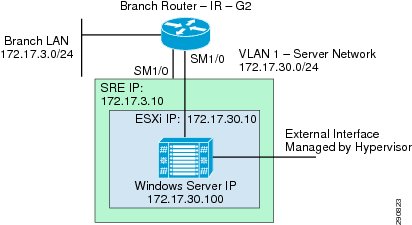
UCS Express Interface Configuration
interface GigabitEthernet0/0description *** LAN Interface ***ip address 172.17.3.1 255.255.255.0!interface SM1/0ip unnumbered GigabitEthernet0/0service-module ip address 172.17.3.10 255.255.255.0 << SRE Address!Application: SRE-V Running on SMVservice-module ip default-gateway 172.17.3.1service-module mgf ip address 172.17.30.10 255.255.255.0 << Hyper Visor Address!interface SM1/1description Internal switch interface connected to Service Moduleswitchport mode trunk!interface Vlan1description *** GW for Hypervisor ***ip address 172.17.30.1 255.255.255.0!ip route 172.17.3.10 255.255.255.255 SM1/0!UCS Express—SRE Configuration and Validation
Setting Hypervisor Gateway
hypervisor set ip default-gateway 172.17.30.1show hypervisor ipHostname: localhostDomain Name: NoneIP Config: 172.17.30.10(Subnet Mask: 255.255.255.0)169.254.1.1(Subnet Mask: 255.255.255.0)172.26.162.49(Subnet Mask: 255.255.0.0)Default Gateway: 172.17.30.1Preferred DNS Server: NoneAlternative DNS Server: Noneshow licenseIndex 0 Feature: SRE-V-HOST-LICPeriod left: 6 weeks 2 daysLicense Type: EvaluationLicense State: Active, In UseLicense Count: Non-CountedLicense Priority: LowIndex 1 Feature: SRE-V-RMA-LICPeriod left: 0 minute 0 secondUCS Express—HyperVisor Connectivity
The following credentials should be used when connecting to the UCS Express Hypervisor using view client:
•
•
•
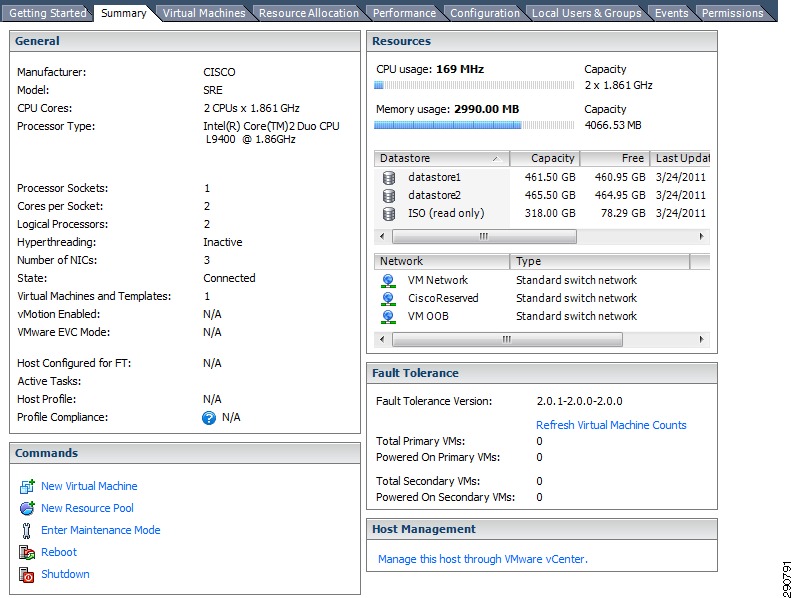
Figure 43 UCS Express—System Overview
Figure 44 UCS Express—Network Details
Figure 45 UCS Express—Virtual Machine Overview
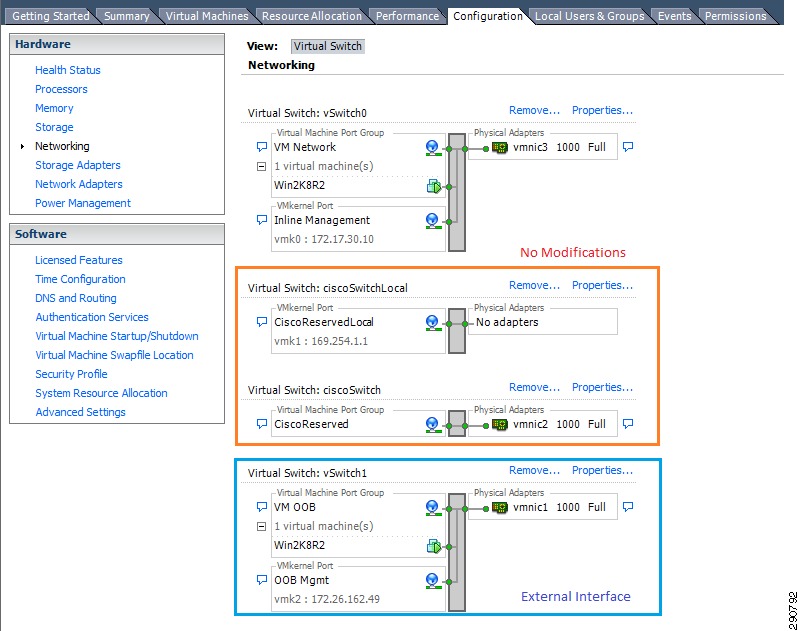
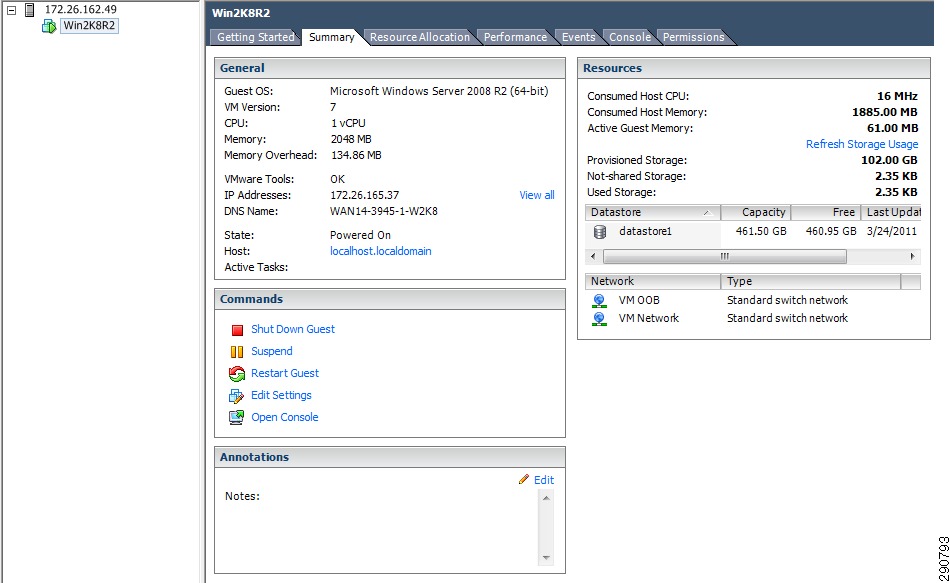
Windows 2008 VM—DNS and DHCP Configuration
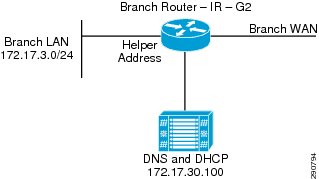
By adding Windows 2008 VM to the 172.17.30.0/24 network and setting the default gateway on the 2008 server to 172.17.30.1 (VLAN 1 on router), this server can be configured with services that clients on the branch LAN can utilize. In the current phase of Application Velocity, these services are DNS and DHCP. To enable DHCP request to be sent to the Windows 2008 Server, helper-address needs to be configured on the LAN interface of the router.
interface GigabitEthernet0/0description *** LAN Interface **ip address 172.17.3.1 255.255.255.0ip helper-address 172.17.30.100endFigure 46 UCS Express VM—DNS and DHCP Services
Deploying PfR in Branch
Traditional routing mechanisms can provide load sharing and failure mitigation in a network. Cisco PfR provides an enhancement where routers can make real-time routing adjustments based on criteria other than static routing metrics. These real-time routing adjustments based upon performance make Cisco PfR an important component of Application Velocity for providing additional optimization. Cisco PfR is typically deployed when multiple connections to the WAN allow two or more possible network egress interfaces. For Branch100, PfR is utilized to route business critical (Oracle E-Business) traffic over the low latency link.
Overview of Branch100 Routing
Branch100 has two paths to reach the data center, through WAN-1 and WAN-2. Branch10-3945-2 is set as HSRP active branch router, therefore all the traffic from the users on the LAN segment use Branch100-3945-2 as their default gateway. This traffic follows the WAN-2 (75 ms latency) link to route the traffic to the data center network. WAN-1 link however sits idle and is only utilized in case of a failure on the Branch100-3945-2. By implementing PfR, this idle link is used to route Oracle traffic. Branch100-3945-1 is configured as a PfR Master Controller and Border Router whereas Branch100-3945-2 is configured as a Border Router. PfR-based routing control provides a lot of choices and metrics, but in this phase of the CVD the only metric that is considered is reachability of the network. For more details on PfR, see the PfR documentation on Cisco.com:
http://www.cisco.com/en/US/products/ps8787/products_ios_protocol_option_home.html.It must be pointed out that for return traffic to take the same path, PfR should be defined on the data center WAN edge ASR as well. As of the current release used in this CVD, Cisco ASR does not support Master Controller and Border Router on the same device. Traffic coming back from the data center can therefore be controlled on Cisco ASR by utilizing policy-based routing. Customers can also deploy a dedicated router (e.g., ISR-G2) to act as Master Controller. For this design guide, we utilized policy-based routing.
Because of IOS order of operation, when PfR uses a dynamic route-map to send traffic to the alternate path, traffic is forwarded to WAAS twice—once on default gateway Branch100-3945-2 and then again on PfR dictated path Branch100-3945-1. This blacklists the destination server on WAAS and traffic is not optimized. In order to avoid this situation, a new link is added between the two 3945s. This new link is used by PfR to send traffic to an alternate path.
Figure 47 Performance Routing Setup on Branch 100
PfR Configuration
New Interface Configuration on BRANCH100-3945-1
interface GigabitEthernet0/0description *** LAN ***ip address 172.17.4.2 255.255.255.0ip wccp 61 redirect inip flow egressstandby version 2standby 0 ip 172.17.4.1standby 0 preemptstandby 0 authentication md5 key-string ciscorouterservice-policy input qos_marking!interface GigabitEthernet0/1description *** WAN ***ip address 101.1.4.1 255.255.255.252ip wccp 62 redirect inip flow egressservice-policy output outbound_qos!interface GigabitEthernet0/2description ** To WAN15-3945-2 G0/2 ***ip address 172.17.254.1 255.255.255.252!New Interface Configuration on BRANCH100-3945-2
interface GigabitEthernet0/0description *** LAN ***ip address 172.17.4.3 255.255.255.0ip wccp 61 redirect inip flow egressstandby version 2standby 0 ip 172.17.4.1standby 0 priority 105standby 0 preemptstandby 0 authentication md5 key-string ciscorouterservice-policy input qos_marking!interface GigabitEthernet0/1description *** WAN (changed) ***ip address 102.1.4.1 255.255.255.252ip wccp 62 redirect inip flow egressservice-policy output outbound_qos!interface GigabitEthernet0/2description *** To WAN15-3945-1 G0/2 ***ip address 172.17.254.2 255.255.255.252!BRANCH100-3945-1—PfR Master Controller and Border Router
key chain pfr << Authentication between MC and BRkey 0key-string appvelocity!Master Controller Configuration
pfr masterpolicy-rules pfr_policy << Defined Belowno max-range-utilizationlogging << To see PfR messages in log (chatty)!border 172.17.254.2 key-chain pfr << Remote Border Routerinterface GigabitEthernet0/2 internal << New Interfaceinterface GigabitEthernet0/1 externallink-group Bulkinterface GigabitEthernet0/0 internal!border 172.17.254.1 key-chain pfr << Local Border Routerinterface GigabitEthernet0/2 internal << New Interfaceinterface GigabitEthernet0/1 externallink-group Businessinterface GigabitEthernet0/0 internal!!learnthroughputperiodic-interval 1monitor-period 2traffic-class filter access-list DENY_ALL << Only control Oracle Prefix/Networkaggregation-type prefix-length 32list seq 10 refname business_criticaltraffic-class access-list business_critical << ACL defining Oracle Trafficaggregation-type prefix-length 32throughputholddown 90backoff 180 180mode route controlmode monitor fastperiodic 180no resolve rangeno resolve utilization!!ip access-list extended business_critical << ACL Defining Oracle Trafficpermit tcp any any eq 8000!pfr-map pfr_policy 10 << PfR-map Policy Definitionmatch pfr learn list business_criticalset periodic 90set mode select-exit goodset delay threshold 300set mode route controlset mode monitor fastset resolve loss priority 2 variance 5no set resolve delayno set resolve rangeno set resolve utilizationset loss threshold 50000set unreachable threshold 50000set active-probe echo 10.41.102.136set probe frequency 5set link-group Business fallback Bulk!Border Router Configuration
pfr borderlocal GigabitEthernet0/2master 172.17.254.1 key-chain pfr!BRANCH100-3945-2—PfR Border Router
key chain pfrkey 0key-string appvelocity!pfr borderlocal GigabitEthernet0/2master 172.17.254.1 key-chain pfr!PfR Validation
BRANCH100-3945-1#show pfr master
OER state: ENABLED and ACTIVEConn Status: SUCCESS, PORT: 3949Version: 3.0Number of Border routers: 2Number of Exits: 2Number of monitored prefixes: 2 (max 5000)Max prefixes: total 5000 learn 2500Prefix count: total 2, learn 1, cfg 0PBR Requirements metNbar Status: InactiveBorder Status UP/DOWN AuthFail Version172.17.254.2 ACTIVE UP 06:21:39 0 3.0172.17.254.1 ACTIVE UP 06:21:40 0 3.0Global Settings:max-range-utilization percent 0 recv 0mode route metric bgp local-pref 5000mode route metric static tag 5000trace probe delay 1000loggingexit holddown time 60 secs, time remaining 0Default Policy Settings:backoff 180 180 180delay relative 50holddown 90periodic 180probe frequency 56number of jitter probe packets 100mode route controlmode monitor fastmode select-exit goodloss relative 10jitter threshold 20mos threshold 3.60 percent 30unreachable relative 50resolve delay priority 11 variance 20Learn Settings:current state : STARTEDtime remaining in current state : 131 secondsthroughputdelayno inside bgptraffic-class filter access-list DENY_ALLmonitor-period 2periodic-interval 1aggregation-type prefix-length 32prefixes 100 appls 100expire after time 720Learn-List seq 10 refname business_criticalConfiguration:Traffic-Class Access-list: business_criticalAggregation-type: prefix-length 32Learn type: throughputSession count: 50 Max count: 100Policies assigned: 10Status: ACTIVEStats:Traffic-Class Count: 1BRANCH100-3945-1#show pfr border
OER BR 172.17.254.1 ACTIVE, MC 172.17.254.1 UP/DOWN: UP 00:20:29,Auth Failures: 0Conn Status: SUCCESSOER Netflow Status: ENABLED, PORT: 3949Version: 3.0 MC Version: 3.0ExitsGi0/0 INTERNALGi0/1 EXTERNALGi0/2 INTERNALBRANCH100-3945-2#show pfr border
OER BR 172.17.254.2 ACTIVE, MC 172.17.254.1 UP/DOWN: UP 09:38:35,Auth Failures: 0Conn Status: SUCCESSOER Netflow Status: ENABLED, PORT: 3949Version: 3.0 MC Version: 3.0ExitsGi0/0 INTERNALGi0/1 EXTERNALGi0/2 INTERNALBRANCH100-3945-1# show pfr master traffic-class
OER Prefix Statistics:Pas - Passive, Act - Active, S - Short term, L - Long term, Dly - Delay (ms),P - Percentage below threshold, Jit - Jitter (ms),MOS - Mean Opinion ScoreLos - Packet Loss (packets-per-million), Un - Unreachable (flows-per-million),E - Egress, I - Ingress, Bw - Bandwidth (kbps), N - Not applicableU - unknown, * - uncontrolled, + - control more specific, @ - active probe all# - Prefix monitor mode is Special, & - Blackholed Prefix% - Force Next-Hop, ^ - Prefix is deniedDstPrefix Appl_ID Dscp Prot SrcPort DstPort SrcPrefixFlags State Time CurrBR CurrI/F ProtocolPasSDly PasLDly PasSUn PasLUn PasSLos PasLLos EBw IBwActSDly ActLDly ActSUn ActLUn ActSJit ActPMOS ActSLos ActLLos--------------------------------------------------------------------------------10.41.102.136/32 N N tcp 1-65535 8000-8000 0.0.0.0/0INPOLICY @60 172.17.254.1 Gi0/1 PBRU U 0 0 3713 3135 661 1147848 48 0 0 N N N NPfR Creates a Dynamic Route-Map on Branch100-3945-2 (HSRP Active) to Route matching traffic to Branch100-3945-1.
BRANCH100-3945-2#show route-map dynamic
route-map OER_INTERNAL_RMAP, permit, sequence 0, identifier 2013265922Match clauses:ip address (access-lists): oer#2Set clauses:ip next-hop 172.17.254.1interface GigabitEthernet0/2Policy routing matches: 1210675 packets, 273516000 bytesCurrent active dynamic routemaps = 1Enterprise Wide Application Velocity Advantage
In the previous sections, various technologies and products that make up three Application Velocity Components are deployed in the network. This section covers how network administrators gain visibility into end-to-end traffic flows, understand the load characteristics, validate the optimization advantages, and verify network/application agility. It must however be pointed out that this section only covers some of the most common reports and captures that network administrators need to gain visibility into the characteristics and health of their network. The tools shown here (NAM, CA NetQoS, WAAS Central Manager, etc.) are capable of producing hundreds of different reports that can be customized for each individual network.
Customizing Cisco NAM
To run meaningful reports and to gather WAAS statistics, it is helpful to customize the Cisco NAM.
Setting up WAAS Devices as Data Source
Cisco NAM, with the configuration covered so far, gathers network and application statistic captured through SPAN or sent via NetFlow. Cisco NAM can also report statistics from Cisco WAAS. All the WAAS devices should be configured to export the statistics to Cisco NAM. These setting can be applied through WAAS Central Manager GUI:
Figure 48 WAAS Central Manager—Configuring Flow Monitor to Export to NAM
On NAM, these WAAS devices have to be added as Data Source, as shown in Figure 49.
Figure 49 Adding WAAS Devices as Data Sources
Remote WAAS devices (SREs) can be used to gather client and client-WAN statistics while the data center WAEs are configured to gather server and server-WAN statistics.
Adding WAAS Servers
All application servers are added as WAAS servers by going to:
Setup -> Monitoring -> WAAS Servers
And adding the following servers:
•
•
•
•
•
•
Configuring Sites
Since NAM captures data from a lot of networks and sources, sites can be defined in order to create filters for reporting. A site can be host, network, or a combination of address ranges and data sources. For the CVD network, following sites were defined:
Setup -> Network -> Sites
•
•
•
•
•
•
•
After these customizations, a number of useful reports can be run.
Configuring Customer Applications
In addition to a pre-built list of well-known applications, NAM allows users to add their own custom applications as well. This task can be performed by following:
Setup -> Classification -> Applications
Click Create and add Application Information (ports, etc).
In this CVD, Oracle_Ebiz was added by setting TCP port 8000 as the application port.
NAM—Reporting Branch Traffic
To gather the traffic rate, protocol, and host breakdown at the branch router, the following settings can be utilized in the NAM Monitoring and Netflow-based traffic report for the branch can be viewed.
Monitor -> Overview -> Traffic Summary
Filter -> Site = BRANCH100 & Data Source = NetFlow Data From Branch Router
Figure 50 NAM—Reporting Branch Traffic
NAM—Reporting Response Time
Since NAM is capturing traffic at the data center aggregation layer, NAM can report server response time for any client-server flow. Figure 51 shows server response time for the Oracle E-Business Server.
Analyze -> Response Time -> Client-Server
Filter -> Client = 172.17.4.170 & Server = 10.41.102.136 & Application = Oracle_EBiz
Figure 51 Cisco NAM—Client Server Statistics
Setting the client value is optional and NAM can also report on server response times by sites. Figure 52 shows response time based on the site "SharePoint":
Monitor -> Overview -> Response Time Summary
Fiter: Site=SharePoint & Site Client/Server = Local Only
Figure 52 NAM Reporting Server Response Time
NAM—Reporting Inter-Server Traffic
By utilizing the SPAN port, NAM can report communication between data center servers as well. In Figure 53, traffic captured on NAM DATA PORT is displayed and various server IP addresses and their traffic rates are reported.
Monitor -> Overview -> Traffic Summary
Filter = Data Source = Data Port 1
Figure 53 NAM—Server Traffic Captured using Data Port
WAAS Central Manager (CM)—Traffic Overview
Cisco WAAS Central Manager provides a number of useful statistics for the optimized traffic. As soon as one logs into the WAAS Central Manager GUI:
https://<WAAS CM's IP>:8443/login.jsp
An overview of the traffic being optimized is displayed, as shown in Figure 54.
Figure 54 WAAS Central Manager—Traffic Overview
WAAS Central Manager—HTTP Acceleration
Cisco WAAS Central Manager provides protocol acceleration statistics including time saved due to local acknowledgements, connections handled, optimizations techniques, etc.
Figure 55 WAAS Central Manger—HTTP Acceleration
NAM Reporting WAAS Statistics
Cisco NAM can report client and server side latency, compression ratios, WAN latency, and a number of other useful statistics for end-to-end flows optimized through WAAS. Figure 56 and Figure 57 show these statistics captured by:
Analyze -> Wan Optimization -> Application Performance Analysis
Filter: Client Site = Branch100 & Server Site = DC & Application = HTTP
Figure 56 NAM Provided Historical Trending of Transaction Times
Figure 57 NAM Reports Compression Ratios and WAN and Server Latencies
CA NetQoS ReporterAnalyzer—Custom Reports
In addition to gathering interface-level NetFlow statistics, CA NetQoS ReporterAnalyzer was utilized to to run custom reports across the network to identify all the interfaces and related statistics for application traffic. For example, Figure 58 and Figure 59 both show the output of a report that captures all the interfaces in the network which carried Exchange traffic.
Figure 58 CA NetQoS ReporterAnalyzer—Custom Report Showing Host Distribution
Figure 59 CA NetQoS ReporterAnalyzer—Custom Report Showing Interface and Traffic Reported
CA NetQoS SuperAgent—WAAS Optimization Statistics
Previously WAAS was configured to export flow statistics to Cisco NAM. WAAS can alternately be configured to export these statistics to CA NetQoS SuperAgent. Based on the statistics received, SuperAgent reports response times seen by the client, server, and over the WAN.
Figure 60 CA NetQoS SuperAgent—Application Response Time Reported by Client Side WAAS
Figure 61 CA NetQoS SuperAgent—WAN Response Time—WAAS Reduced 75 ms Latency to 32 ms
Figure 62 CA NetQoS SuperAgent—Server Response Time Reported by Server Side WAAS
Application Optimization Observation
Data and Response Time Reduction
All the applications showed considerable benefits after the network traffic was optimized. When the applications were individually tested using the test tools, the optimization in Figure 63 through Figure 66 was observed (WAAS Central Manger Report).
Figure 63 Oracle E-Business Traffic—Bandwidth Percentage Reduction of 88%
Figure 64 MS Exchange 2010—Bandwidth Percentage Reduction of 78%
Figure 65 MS SharePoint 2010—Bandwidth Percentage Reduction of 77%
Figure 66 Web Traffic—Bandwidth Percentage Reduction of 88%
Table 9 Application Optimization Statistics
Oracle E-Business
88%
80
SharePoint
77%
Exchange
78%
40
Web
88%
80
Note
Bandwidth and Time to Download Reduction
To demonstrate the WAAS advantage, the following test was performed on downloading a SharePoint document from SharePoint server.
"Cold" (first time) download
•
•
•
•
"Hot" (second time) download
•
•
•
•
The times across the board were reduced drastically on the second download as seen in Figure 67 and Figure 68 (tool captures).
Figure 67 SharePoint Document Download—First Time (Cold)
On the first attempt, the time to download the file was 4.172 seconds.
Figure 68 SharePoint Document Download—Second Time (Hot)
On the second attempt, the time to download the file was 0.251 seconds. Wait time was also reduced from 1.454 seconds to 0.109 seconds.
Note that the optimization advantages provided by WAAS are across the board for all applications and SharePoint document download is just one example of what WAAS can do.
Appendix A—Caveats
Appendix B—CA NetQoS Performance Center
Adequate monitoring, reporting, and troubleshooting are essential elements of a successful Application Velocity Solution. The value provided by these features transcends functional teams:
•
•
•
When deployed in combination with Service Assurance solutions from CA Technologies and Cisco monitoring products that are specifically designed for use in Cisco optimized environments, users can benefit from end-to-end and tier-to-tier visibility of application performance, accurate reporting of all traffic traversing the network, detailed device performance metrics, and before and after comparisons that help prove the value of optimization investments.
CA NetQoS Performance Center—Network-Wide Monitoring and Reporting
Today's best-of-breed network performance management products draw from multiple data sources to expedite problem resolution and improve infrastructure planning. The CA NetQoS Performance Center is a suite of management modules that, within a single interface, presents a rich set of analytical data derived strictly from passive monitors and instrumentation already present in network and data center devices. Cisco's Application Velocity Solution incorporates CA NetQoS Performance Center to deliver powerful and integrated WAN traffic and performance monitoring. Note that not all the features of the CA NetQoS Performance Center are applicable to the Application Velocity Phase 1 CVD. These unused features are covered to provide an overview of the product capability.
The CA NetQoS Performance Center is designed to provide an accurate and comprehensive understanding of how an organization is supporting application delivery by capturing and analyzing data from applications, devices, and the network itself. CA NetQoS Performance Center provides:
•
•
•
•
•
Figure 69 CA Technologies Products Analyze and Present Comprehensive Performance Metrics from a Rich Set of Cisco Data Sources
CA NetQoS SuperAgent (SuperAgent)—Measuring Application Response Times
CA NetQoS SuperAgent is a passive, end-to-end response time monitoring and reporting module that is installed in the data center. Through the continuous analysis of the performance of TCP/IP applications, CA NetQoS SuperAgent calculates performance baselines for applications, servers, and network links and alerts the user when performance degrades. This enables rapid troubleshooting of network performance bottlenecks and provides insight into the duration, frequency, pervasiveness, and severity of problems.
CA NetQoS SuperAgent monitors all the TCP application packets from the network into the data center, from tier to tier within the data center, and back out over the network to the end user. CA NetQoS SuperAgent measures Network Round Trip Time, Server Response Time, Data Transfer Time, and much more. It separates response time into application, network, and server delay components, enabling faster problem resolution by pinpointing the source of performance degradation.
CA NetQoS SuperAgent is composed of one or more collection device and a management console. A collection device monitors and collects data from network devices and sends the data to the SuperAgent Management Console. CA NetQoS SuperAgent uses three types of collection devices: any data center Cisco NAM device (blade or appliance), the SuperAgent Multi-Port Collector, and the SuperAgent Single-Port Collector. SuperAgent Collectors process SPAN data from switches on their monitor ports, but also process FlowAgent data from Cisco WAE devices on their Management NICs. Similarly, Cisco NAM devices process both SPAN data and FlowAgent data. FlowAgent is an agent residing in Cisco WAAS WAEs which exports raw TCP data to Cisco NAM and other SuperAgent Collectors. The integration of CA NetQoS SuperAgent and WAAS FlowAgent enables accurate response time reporting on optimized traffic where WAAS is deployed. Figure 70 shows a typical CA NetQoS SuperAgent deployment consisting of one SuperAgent Collector for processing FlowAgent data, one SuperAgent Collector for processing SPAN data, and a SuperAgent Management Console for long-term data storage and reporting. In a more simplified deployment, one SuperAgent Collector or one Cisco NAM device can receive both the SPAN data and the FlowAgent data, process that data, and provide computed metric data to the Management Console. CA NetQoS SuperAgent is designed to monitor end-to-end application delivery in both Cisco WAAS optimized environments, non-optimized environments, and mixed environments. It can be quickly installed and configured to monitor very large environments, making it a practical choice for complex data centers and networks.
Figure 70 CA NetQoS SuperAgent Application Response Time Collection Architecture in a Cisco WAAS-Optimized Environment
With a relatively small number of collection appliances (Cisco NAM blades, NAM appliances, or SuperAgent Collectors) and without the introduction of client or server agents, CA NetQoS SuperAgent can help determine:
•
•
•
•
The CA NetQoS SuperAgent reporting dashboard from the Management Console provides:
•
•
Figure 71 CA NetQoS SuperAgent Response Time Composition Graphs Show How Server, Application, and Network Delay Impacts Application Performance
The CA NetQoS SuperAgent Management Console also provides a drill-down to the Cisco NAM user interface for detailed troubleshooting and additional functionality.
CA NetQoS ReporterAnalyzer—Analyzing Link Traffic
CA NetQoS ReporterAnalyzer is a traffic analysis module that analyzes and reports how application traffic is affecting network performance by leveraging IOS NetFlow instrumentation present on Cisco routers and switches. It provides insight into which applications are using bandwidth, who is using the bandwidth, and when. In a single reporting interface CA NetQoS ReporterAnalyzer can display trends that impact a global WAN infrastructure (for purposes of traffic policy monitoring, capacity planning, and control) alongside reports of traffic anomalies (for example, malware, peer-to-peer, and unauthorized service protocols) detected from individual devices among many thousands on the network.
CA NetQoS ReporterAnalyzer includes the following components:
•
•
•
In a typical CA NetQoS ReporterAnalyzer implementation (Figure 72) a Harvester collects raw NetFlow data transmitted from configured routers and switches, processes the data for collection by the Flow Manager, and creates local archives for use in detailed flow analysis and reporting.
Figure 72 CA NetQoS ReporterAnalyzer Link Traffic Analysis Architecture
After deploying a small number of passive NetFlow collection devices, CA NetQoS ReporterAnalyzer can:
•
•
•
•
•
•
•
The CA NetQoS ReporterAnalyzer user interface provides views and analytics that support network troubleshooting and forensics, policy monitoring, capacity planning, and management reporting. CA NetQoS ReporterAnalyzer provides the following views.
•
•
Figure 73 CA NetQoS ReporterAnalyzer Stacked Trend Plot Shows ToS Distribution on a Link
•
Figure 74 CA NetQoS ReporterAnalyzer Custom Reports can be Created to Show Information about Interfaces, Protocols, ToS, Hosts, and Conversations for Any Time Frame
•
•
Summary
Service Assurance solutions from CA Technologies work closely with Cisco technologies to provide end-to-end and tier-to-tier visibility of application performance, traffic analysis, and device performance. The CA NetQoS Performance Center is designed to provide an accurate and comprehensive understanding of how well an organization is supporting application delivery via:
•
No single data source is adequate for understanding how the network is supporting applications, so the CA NetQoS Performance Center collects data across a variety of sources, including end-to-end application response times, packets, network traffic data, and infrastructure device MIBs. To minimize overhead, it leverages embedded network instrumentation (Cisco IOS NetFlow, IPFIX, and Cisco NAM) along with passive, data center-oriented collection devices. Avoiding remote probes and server or desktop agents speeds deployments, improves scalability, and reduces management labor costs and complexity.
•
Multiple analytical capabilities—baselines, thresholds, trending, anomaly detection, and automatic investigations—are applied to define "normal" network and application performance. This helps highlight issues before they impact end users, while correlation of multiple metrics helps the evolution from fault-based management to performance-based management.
•
The CA NetQoS Performance center provides a single reporting interface with role-based access and profiles. Flexible, customizable report formats and alerts can be tailored to the needs of not only network engineers, but also operations staff, server and application teams, and IT executives. The CA NetQoS Performance Center offers the flexibility to build customized views that include maps, dashboards, and charts generated from the full suite of underlying data sources and analytics.
The CA NetQoS Performance Center is an intuitive, Web-based network monitoring management console that provides a top-down view of all applications—data, video, voice—for your entire network infrastructure and provides drill down capabilities into the detailed information provided by the underlying data sources. It integrates (both inbound and outbound) with third-party applications; views can be exported to Web-based applications or even Microsoft Excel. The CA NetQoS Performance Center is designed to unlock the infrastructure intelligence needed to manage the network for application performance.