Feedback
Table Of Contents
Prime Infrastructure User Interface
Prime Infrastructure UI Components
Getting Device Details Using the 360° View
Searching for Devices or SSIDs
Prime Infrastructure User Interface
Prime Infrastructure is a web-based application. Tabs on the user interface are either specific to a particular Cisco Prime product or can be shared across multiple Cisco Prime products. The options on application tabs are displayed when you rest your cursor on the tab.
Not all tabs or options are activated if any of your installed Cisco Prime products are not enabled through licensing.
This chapter contains the following sections:
•
Prime Infrastructure UI Components
•
Prime Infrastructure UI Components
The following sections provide details on the Prime Infrastructure user interface components that are visible on most of the pages:
Global Toolbars
Prime Infrastructure contains static global toolbars at the top-right of the page (see Figure 30-1):
Figure 30-1 Global Toolbar—Top-right
•
•
Click the downward arrow next to your login name to switch to a different Prime Infrastructure view:
–
–
•
•
•
•
•
•
Prime Infrastructure contains the following static global toolbar at the bottom-right of the page (see Figure 30-2):
Figure 30-2 Global Toolbar—Bottom-right
•
•
•
Filters
You can use the Filter feature to display specific information on the Prime Infrastructure interface. The Filter icon is provided wherever the data is displayed in a tabular format. The following types of filters are available:
Quick Filter
This filter allows you to narrow down the data inside a table by applying a filter to a specific table column or columns. To apply different operators, use the Advanced Filter option.
To launch the quick filter, choose Quick Filter from the Filter drop-down menu.
To clear the Quick Filter, click the Filter button.
Advanced Filter
This filter allows you to narrow down the data in a table by applying a filter using multiple operators such as Does not contain, Does not equal, Ends with, Is empty, and so on. For example, you can choose the filter pattern by table column names and operator from the drop-down menu. In addition, you must enter filter criteria based on the data available in the Prime Infrastructure database.
To launch advance filtering, choose Advanced Filter from the Filter drop-down list.
Figure 30-3 Advance Filter
To save the filter criteria used in the Advance filter (see Figure 30-3):
1.
The data is filtered based on the filter criteria.
2.
The Save Preset Filter window appears.
3.
Data Entry Features
In addition to the checkboxes, dropdown lists and data entry fields common in most user interfaces, Prime Infrastructure uses some specialized data-entry features. These are designed to keep your view of the network as uncluttered as possible, while still making it possible for you to add, update, and save your settings when needed. These specialized data-entry features include:
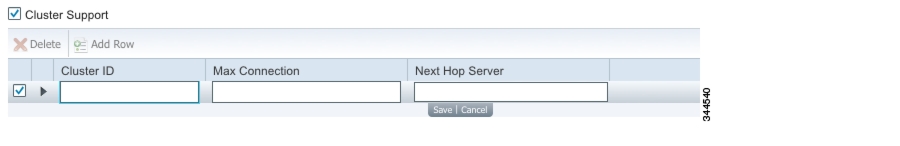
Anchored Fields
Anchored fields are recognizable by the plus sign {+} embedded in the field at the far right (see Figure 30-4).
Figure 30-4 Anchored Field
Clicking on the plus sign allows you to display an associated data popup (see Data Popups). You can use the data popup to view or update the settings you want. When you finished, you can "close" the anchored field by clicking the minus (-) sign displayed at the top of the data popup (see Figure 30-5).
Figure 30-5 Anchored Field with Popup
To use anchored fields:
1.
2.
3.
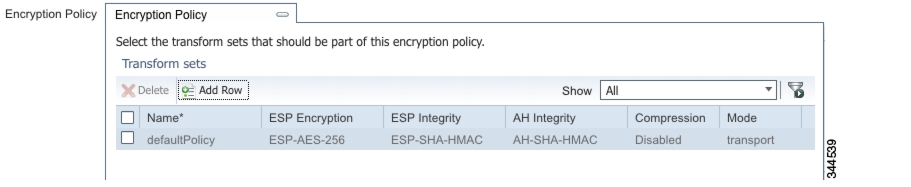
Edit Tables
Prime Infrastructure uses tables to display many kind of data, including lists of sites, devices, and events. The data is arranged in rows and columns, much like a spreadsheet.
An edit table differs from other tables in that you can add, edit, or delete the data it contains (see Figure 30-6). Some edit tables also give you access to filters (see Filters). Edit tables are often displayed in data pop-ups triggered by checkboxes or anchored fields (see Figure 30-5).
Figure 30-6 Edit Table
To use edit tables:
1.
a.
b.
c.
2.
d.
e.
3.
a.
b.
c.
Data Popups
A data popup is a window associated with a checkbox, anchored field (see Anchored Fields), or other data-entry feature. They are displayed automatically when you select the feature, so you can view or update the data associated with that feature. In addition to normal checkboxes, dropdown lists and data-entry fields, data popups can contain edit tables (see Edit Tables).
To use a data popup:
1.
2.
3.
Common UI Tasks
You can perform the following actions from nearly any Prime Infrastructure screen:
•
Changing Your Password
Step 1
Step 2
Step 3
Step 4
Changing Your Active Domain
Step 1
Step 2
Monitoring Alarms
At the bottom of the window, rest your cursor on Alarm Summary or Alarm Browser to get information on the latest active alarms.
Getting Device Details Using the 360° View
The 360° view provides detailed device information including device status, interface status, and associated device information. You can see the 360° view from nearly all screens in which device IP addresses are displayed.
To launch the 360° view of any device, rest your cursor on a device IP address, then click the icon that appears.
Note
Table 30-1 360° Features
Device status
Indicates whether the device is reachable, is being managed, and is synchronized with the Prime Infrastructure database.
Tool icons
Click one of the following icons on top right of the device 360° view:
•
•
•
•
•
Modules tab
Lists the device modules and their name, type, state, and ports.
Alarms tab
Lists alarms on the device, including the alarm status, time stamp, and category.
Interfaces tab
Lists the device interfaces and the top three applications for each interface.
Neighbors
Lists the device neighbors, including their index, port, duplex status, and sysname.
Getting Help
You can access online help by clicking the question mark icon at the top right of any Prime Infrastructure screen.
Dashboards and Dashlets
Dashboards display at-a-glance views of the most important data in your network. A quick scan of a dashboard should let you know if anything needs attention. Dashboards generally provide status and alerts, monitoring, and reporting information. Dashboards contain dashlets with visual displays such as tables and charts.
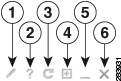
Dashboards contains dashlets with visual displays such as tables and charts. Rest your cursor on any dashlet, and the icons shown in Figure 30-7 appear at the top-right corner of the dashboard.
Figure 30-7 Dashlet Icons
See Configuring Dashboards for more information.
Configuring Dashboards
Dashboards contains dashlets with visual displays such as tables and charts. Click the Settings icon to change the dashboards.
Note
Adding Dashboards
Step 1
Step 2
Step 3
Restoring Default Dashboards
Step 1
Step 2
Step 3
Step 4
Searching for Devices or SSIDs
Prime Infrastructure provides the following methods for searching for devices or SSIDs:
•
You can access the search options from any page within Prime Infrastructure.
Performing a Quick Search
For a quick search, enter a partial or complete IP address or name.
Note
To quickly search for a device, follow these steps:
Step 1
Step 2
The search results display the matching item type, the number of items that match your search parameter, and links to the list of matching results.
Step 3
Performing an Advanced Search
To perform a more specific search for a device in Prime Infrastructure, follow these steps:
Step 1
Step 2
Step 3
Note
Step 4
Step 5
Running a Saved Search
Note
To access and run a previously saved search, follow these steps:
Step 1
Step 2
Step 3
Step 4
Step 5
Need to move the following section:
Monitoring Background Tasks
A background task is a scheduled program running in the background with no visible pages or other user interfaces. In Prime Infrastructure, background tasks can be anything from data collection to backing up configurations. You can monitor background tasks to see which background tasks are running, check their schedules, and find out whether the task was successfully completed.
Step 1
Step 2
–
–
–