Feedback
Table Of Contents
Using the Cisco Multicast Manager
Solaris Installation Instructions
Linux Installation Instructions
Adding Layer 2 Switches to Discovery
Performing Multicast Discovery
Adding or Re-discovering a Single Device
Downloading Router Configurations
Validating Router Configurations
Configuring Domain-Specific Trap Receivers and Email Addresses
Using the Multicast Manager Tool
Application Maintenance and Troubleshooting
Using the Cisco Multicast Manager
This chapter covers:
•
Solaris Installation Instructions
•
•
•
•
System Requirements
Operating Systems:
•
•
•
Minimum Recommended Systems:
Sun Fire V100 with:
•
•
•
•
Sun Fire V210 with:
•
•
•
•
Sun Fire 280R with:
•
•
•
•
Note
Intel PIII 1GHz (running RHEL AS 4) (Taroon Update 4) with:
•
•
Note
<INSTALLDIR>/mmtsys/sys/events.log
<INSTALLDIR>/mmtsys/sys/rmspolld.log
<INSTALLDIR>/httpd_perl/logs/error_log
Solaris Installation Instructions
To install the CMM for Solaris 2.8 or Solaris 2.9, log in as the root user and follow one of the approaches outlined below.
Note
1.
/opt/RMSMMTIf there is not enough room in the /opt directory, create the RMSMMT directory on another partition and create a symbolic link to it from /opt. For example:
# mkdir /space/RMSMMT# cd /opt# ln -s /space/RMSMMT RMSMMT# chown -h mmtuser:mmtuser RMSMMTIf you symbolically link /opt/RMSMMT to the actual installation directory as shown above, when installation is complete, you must cd to the actual installation directory, similar to:
# cd /spaceand issue the following command:
# chown -R mmtuser:mmtuser RMSMMTOtherwise, the installation will create the directory and set the ownership for you.
2.
# cd /cdrom/cdrom0# ./setup.sh(Optional) If for some reason vold is not running, you will have to manually mount the cdrom by entering:
# mount -rt hsfs /dev/sr0 /cdromor
# mount -rt hsfs /dev/dsk/c0t6d0s2 /cdrom3.
# cd /tmp# mkdir rms# cd rms# gunzip -c mmt-sol-2.1-X-full.tar.gz | tar xvf -# ./setup.shYou should then be able to start and stop the server by entering:
/opt/RMSMMT/S98mmtand
/opt/RMSMMT/K98mmtThe default login is admin/rmsmmt.
Note
The S98mmt script will only start the apache server. You will have to manually start the polling daemon through the application if desired.
During installation, the K98mmt script is installed in the /etc/rc0.d directory.
This will ensure that the polling daemon shuts down properly upon system reboot.
The server is configured by default to run on port 8080. If you want to change the port, edit the following file:
/opt/RMSMMT/httpd_perl/conf/httpd.confOutput from a sample installation:
#=====[ Sample Installation ]=====#root@ganymede/export/home/mike/mmtinstall-> ./setup.shInstalling Cisco Multicast Manager Version 2.1Copyright (c) 2003-2004 Cisco Systems, Inc. All Rights Reserved.The application installs in /opt/RMSMMT. Do you wish to continue? [y/n]: yCreating mmtuser gid...Creating mmtuser uid...Locking mmtuser account...Installing Apache...Installing Perl...Installing MIBS...Installing support files...Installing K98mmt to /etc/rc0.d to ensure proper shutdown of application...Would you like the S98mmt script installed in /etc/rc3.d to start the application upon system boot? [y/n]: ySeeding IP Address database with reserved Multicast Addresses...Modifying httpd.conf file for this system...Installation Finished.Linux Installation Instructions
To install the CMM for Red Hat Enterprise Linux AS Release 3 (Taroon Update 4), log in as the root user and follow one of the approaches outlined below.
Note
1.
/usr/local/netmanIf there is not enough room in the /usr/local directory, create the netman directory on another partition and create a symbolic link to it from /usr/local. For example:
# mkdir /space/netman# cd /usr/local# ln -s /space/netman netman# chown -h mmtuser:mmtuser netmanIf you symbolically link /usr/local/netman to the actual installation directory as shown above, when installation is complete, you must cd to the actual installation directory, similar to:
# cd /spaceand issue the following command:
# chown -R mmtuser:mmtuser netmanOtherwise, the installation will create the directory and set the ownership for you.
2.
# cd /mnt/cdrom# ./setup.sh3.
# cd /tmp# mkdir rms# cd rms# gunzip -c mmt-linux-2.1-X-full.tar.gz | tar xvf -# ./setup.shYou should then be able to start and stop the server by entering:
/usr/local/netman/S98mmtand
/usr/local/netman/K98mmtThe default login is admin/rmsmmt.
Note
The S98mmt script will only start the apache server. You will have to manually start the polling daemon through the application if desired.
During installation, the K98mmt script is installed in the /etc/rc0.d directory.
This will ensure that the polling daemon shuts down properly upon system reboot.
The server is configured by default to run on port 8080. If you want to change the port, edit the following file:
/usr/local/netman/httpd_perl/conf/httpd.confOutput from a sample installation:
#=====[ Sample Installation ]=====#root@ganymede/export/home/mike/mmtinstall-> ./setup.shInstalling Cisco Multicast Manager Version 2.3Copyright (c) 2003-2004 Cisco Systems, Inc. All Rights Reserved.The application installs in /usr/local/netman. Do you wish to continue? [y/n]: yCreating mmtuser gid...Creating mmtuser uid...Locking mmtuser account...Installing Apache...Installing Perl...Installing MIBS...Installing support files...Installing K98mmt to /etc/rc0.d to ensure proper shutdown of application...Would you like the S98mmt script installed in /etc/rc3.d to start the application upon system boot? [y/n]: ySeeding IP Address database with reserved Multicast Addresses...Modifying httpd.conf file for this system...Installation Finished.Licensing
CMM 2.3.3 requires a license file. The application license is contained in the license.key file. This file should be placed in the following directory:
On Solaris:
/opt/RMSMMT/mmtsys/sysOn Linux:
/usr/local/netman/mmtsys/sysThe file should be owned by mmtuser (chown mmtuser:mmtuser license.key) and be set to read-only (chmod 0444 license.key). The license is tied to the IP address of the CMM server.
Starting and Stopping CMM
To start the application:
On Solaris:
From the CMM home directory (by default, /opt/RMSMMT) run the S98mmt script.
On Linux:
From the CMM home directory (by default, /usr/local/netman) run the S98mmt script.on Linux.
To stop the application, run the K98mmt script.
The S98mmt script also runs the S98mmtpolld script, which starts the polling daemon. The S98mmtpolld script can also be used as a watchdog script to ensure that the polling daemon is up and running. The root crontab configuration would be:
On Solaris:
0,5,10,15,20,25,30,35,40,45,50,55 * * * * /opt/RMSMMT/S98mmtpolldOn Linux:
*/5 * * * * /usr/local/netman/S98mmtpolldThese entries will run the script every 5 minutes.
Logging Into CMM
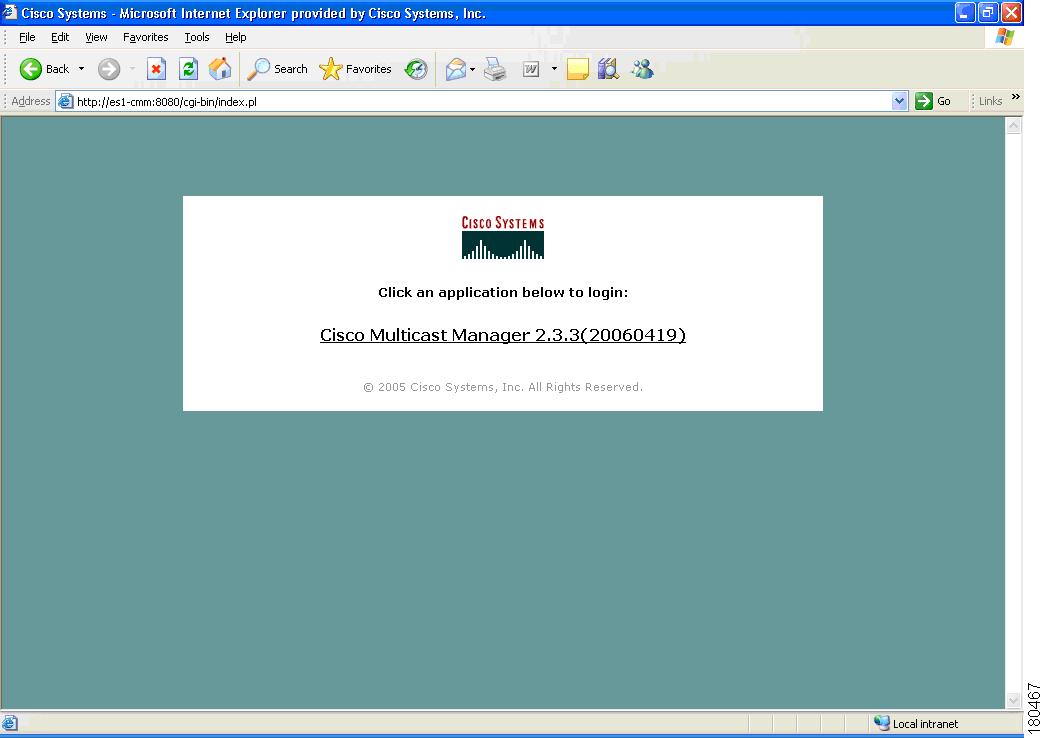
To access CMM, enter the IP address or the name of the server where the software is installed. For example: http://192.168.1.9:8080. The default port of 8080 can be changed as described in the installation instructions.
Figure 1-1 Login Page for CMM 2.3.3
To enter CMM, click on Cisco Multicast Manager 2.3.3. You are prompted for a username and a password. The default CMM username is admin, and the default CMM password is rmsmmt.
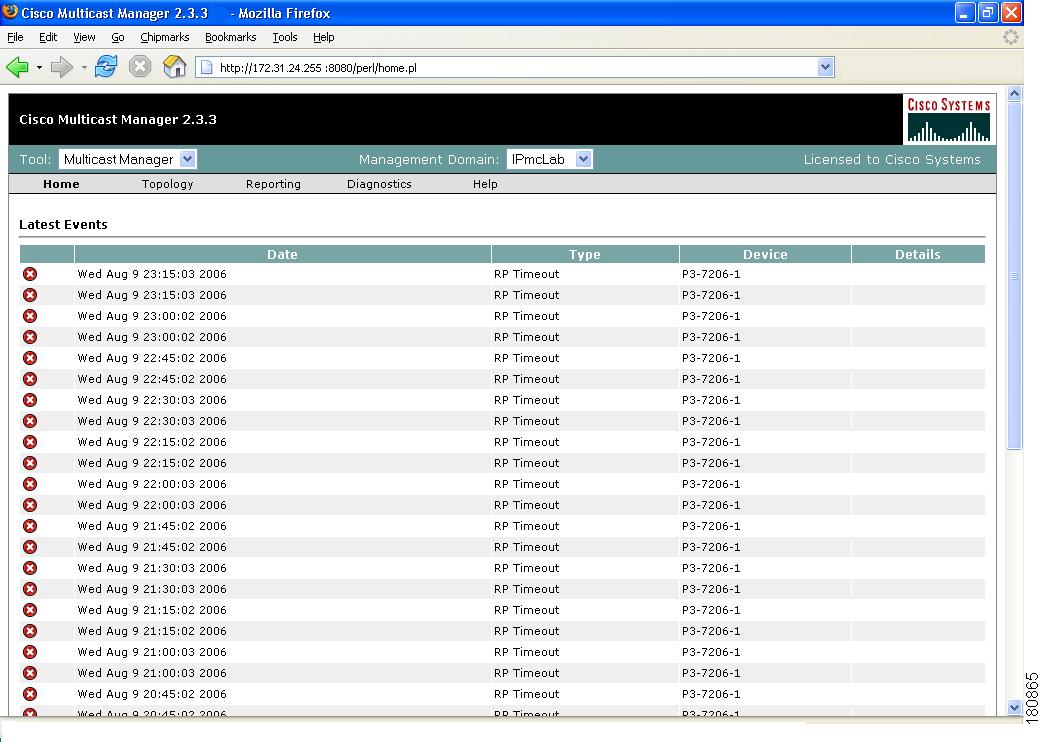
The Multicast Manager Home page appears.
Figure 1-2 Multicast Manager Home Page
For detailed information on this window, see the "Using the Multicast Manager Tool" section.
CMM 2.3.3 has two main Tools:
•
•
You can find these Tools listed at the top left of the CMM 2.3.3 Web interface.
Using the Administration Tool
System administrators can configure their network using the CMM Administration Tool, containing these web pages:
Domain Management
Using Domain Management, you can create and edit domains. A domain is a collection of multicast routers. Multiple domains may exist, and routers can belong to multiple domains.
The first step in using the CMM is to create a domain:
Step 1
Step 2
Step 3
Step 4
The System Configuration page contains:
Management Domain
A management domain is defined as a contiguous group of PIM neighbors sharing the same SNMP community string.
Default Read Only
SNMP read-only community string.
Default Read Write
SNMP read-write community string. This is required for retrieving and validating device configurations.
SNMP Timeout
Retry period if node does not respond. Default value is 0.8.
SNMP Retries
Number of retries to contact a node before issuing a timeout. Default value is 2.
TFTP Server
TFTP server IP address. Default is the IP address of the CMM server.
VTY Password
The VTY password is required if you want to issue show commands from the application. Certain features, such as querying Layer 2 switches, also require this. If TACACS is being used, then a username and password can be supplied instead of the VTY password.
Enable Password
(Not currently used.)
TACACS/RADIUS Username
If you are using TACACS/RADIUS then you can enter a username here. See VTY Password above.
Note
TACACS/RADIUS Password
If you are using TACACS/RADIUS then you can enter a password here. See VTY Password above.
Note
Cache TACACS Info
If this box is checked, CMM will cache the TACACS username and password until the browser is closed. This eliminates having to enter the username and password each time you issue a router command from the application.
Resolve Addresses
Performs DNS lookups on all sources found. The DNS name appears alongside the IP address on the "Show All Groups" screen. If the server is not configured for DNS, then DO NOT check the box. If the box is checked, you may receiver a slower response, due to the fact that the application is trying to resolve names. This option is not recommended if your network contains a large number of S,Gs.
Use SG Cache
Some networks contain thousands of S,Gs. During discovery,CMM caches all the S,Gs found in the RPs. If this box is checked, CMM reads the SG cache when showing lists of sources and groups, rather then retrieving them again from the RPs in the network. The cache is automatically refreshed if RPs are being polled as described later in this document (see the "RP Polling" section). The cache can also be refreshed manually by clicking the Refresh Cache button in the Multicast Diagnostics window (see the "Show All Groups" section). This button only appears if you have the Use SG Cache option selected. It is highly recommended to use the SG cache option. If there are no RPs in the domain being discovered, then the SG cache is created by querying all the devices that have been discovered, as would be the case in a PIM Dense-Mode network. In this case, the SG cache is only updated when you click the Refresh Cache button.
Discovery
Once you have created a domain, the second step in using the CMM is to discover your network using one of these choices, found within the Discovery menu:
•
•
•
•
The discovery process is multicast-specific and only finds devices that are PIM-enabled. CMM builds a database of all found devices. Discovery adds support for multiple community strings per domain, along with device-specific SNMP timeout and retries.
Note
A single router may also be added or rediscovered on the network. A router being added must have a connection to a device that already exists in the database. A router that is being re-discovered is initially removed from the database, along with any neighbors that exist in the database. The router, and its neighbors, are then added back into the database. This option would be used if a change on a device has caused a change in the SNMP ifIndexes.
Note
Adding Layer 2 Switches to Discovery
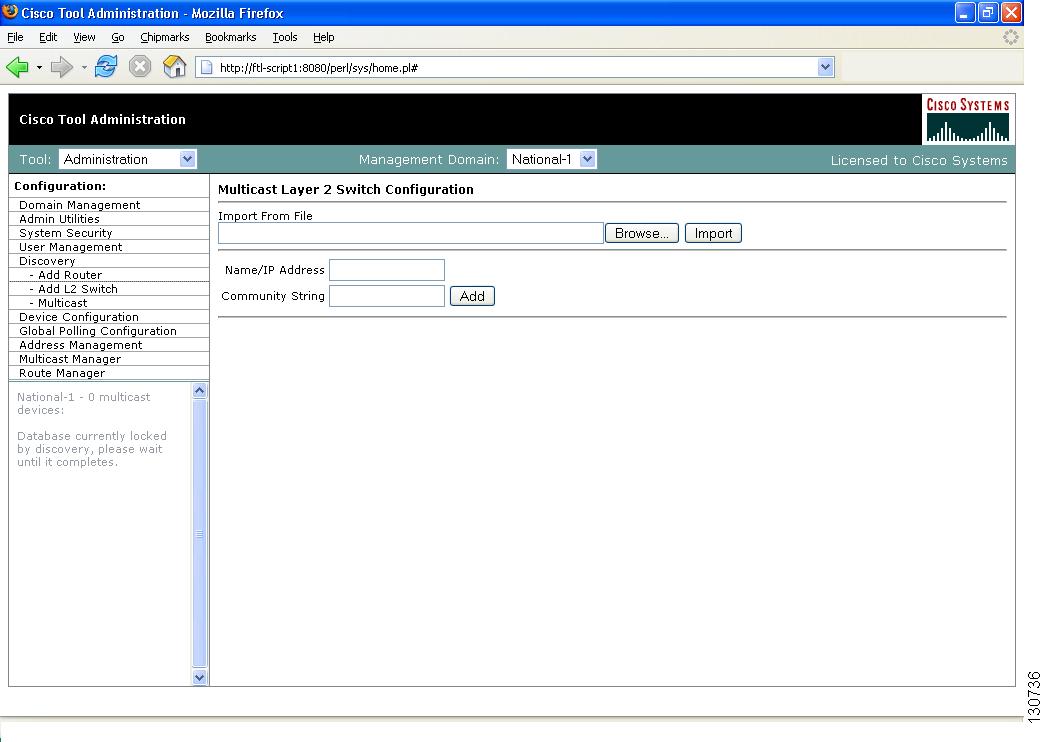
Layer 2 switches are not included in discovery and must be added manually. You can add switches individually, or you can import a list of switches in a csv file.
To add switches individually, enter the switch name or IP address and the community string, then click Add.
To import a list of switches:
Step 1
#import file format switch IP address or switch name# this line will be skippedswitchA192.168.1.1switchC10.10.10.1Step 2
Step 3
Step 4
Figure 1-3 Multicast Layer 2 Switch Configuration
Step 5
Step 6
Note
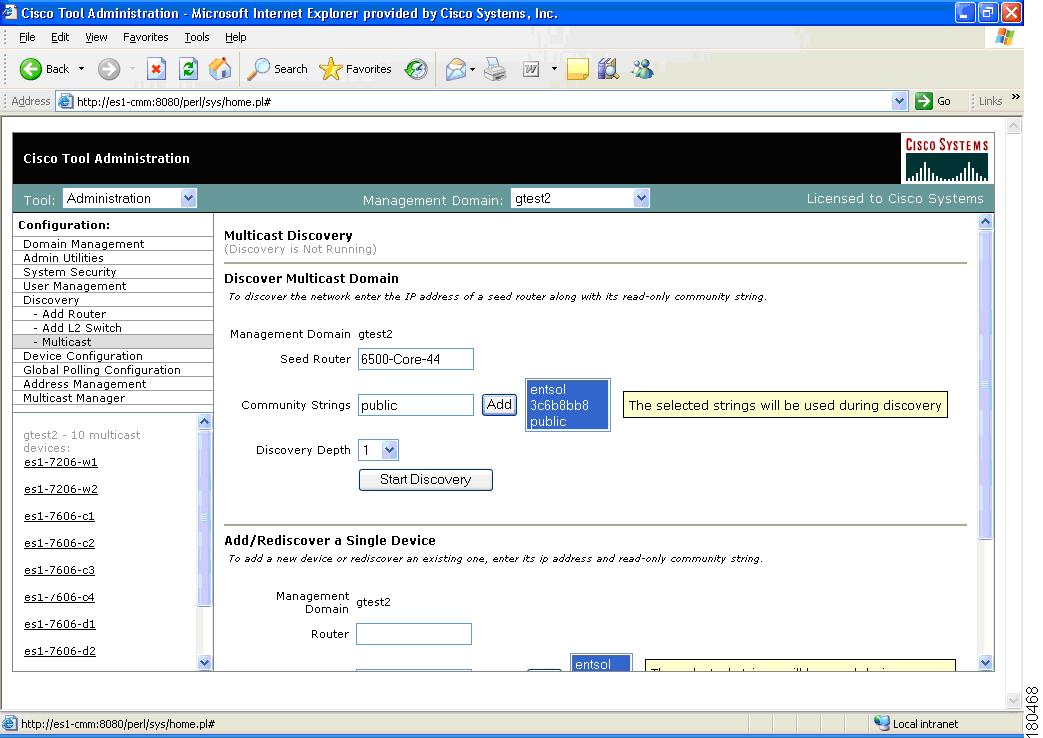
Performing Multicast Discovery
To perform a new multicast discovery:
Step 1
Step 2
Figure 1-4 Multicast Discovery
Step 3
Step 4
Step 5
Note
The Discover Multicast Domain pane of the Multicast Discovery page contains:
CMM discovers all routers in the network that are multicast enabled and have interfaces participating in multicast routing. If the discovery fails to find any routers, or if there are routers in the network that you expected to discover but did not, check the following:
•
•
•
•
When discovery is complete, the browser window displays the time it took to discover the network, and the number of devices discovered:
Discovery took 15 secondsDiscovered 5 routersThe amount of time the discovery takes depends on the number of routers, number of interfaces, and router types.
If the discovery seems to stop at a particular router, or seems to pause, check that particular router's connectivity to its PIM neighbors. Also, check the PIM neighbor to see if it supports the PIM and IPMROUTE MIBs. Again, because the discovery is multicast specific, unless these MIBs are supported, the device will not be included in the database. Issuing the sh snmp mib command on a router gives this information.
When discovery has finished, you can view the discovered routers in the lower left pane.
Adding or Re-discovering a Single Device
To add or re-discover a single device:
Step 1
Step 2
Step 3
Step 4
Step 5
The Add/Rediscover a Single Device pane of the Multicast Discovery page contains:
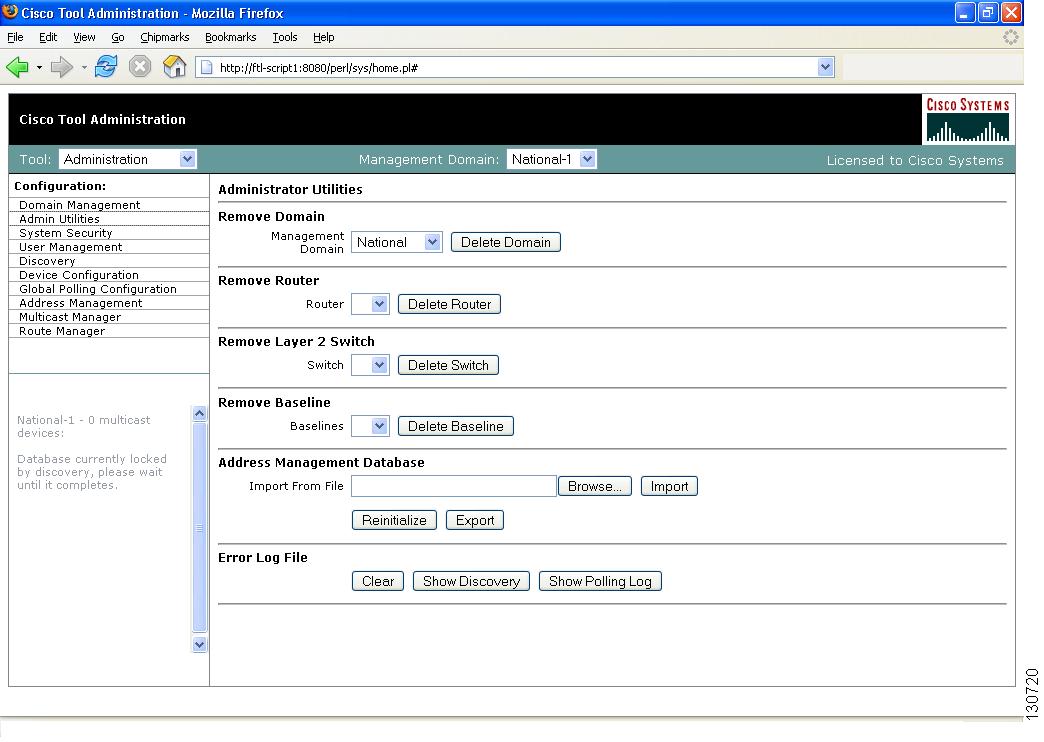
Admin Utilities
The Administrative Utilities page provides maintenance tools for the system administrator.
Figure 1-5 Administrative Utilities
The Administrative Utilities page contains:
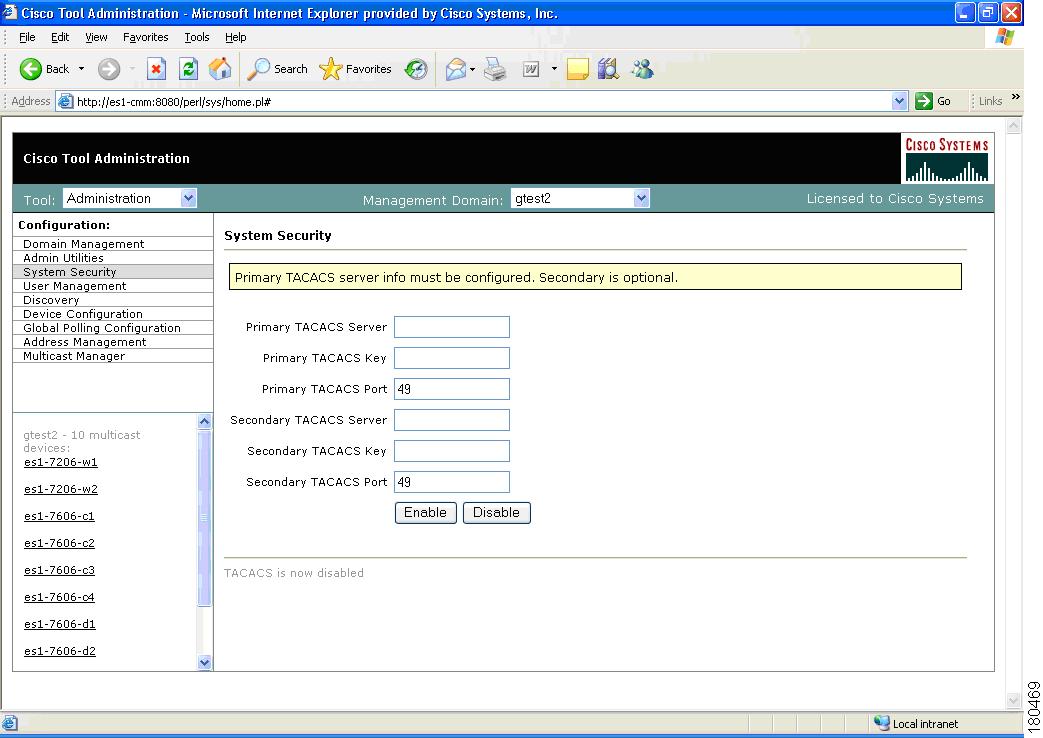
System Security
The System Security page provides TACACS login support for the CMM.
To configure TACACS login, enter the IP address of the TACACS server within the Primary TACACS Server field.
If the keys are configured incorrectly, they will have to be manually changed in the /opt/RMSMMT/httpd_perl/conf/httpd.conf file, as follows:
Tacacs_Pri_Key tac_plus_keyTacacs_Sec_Key tac_plus_key<Sample AAA Server Config>group = admins {service = connection {priv-lvl=15}group = netop {service = connection {}}user = mike {member = netoplogin = des mRm6KucrBaoHY}user = admin {member = adminslogin = cleartext "ciscocmm"}</Sample AAA Server Config>Figure 1-6 System Security
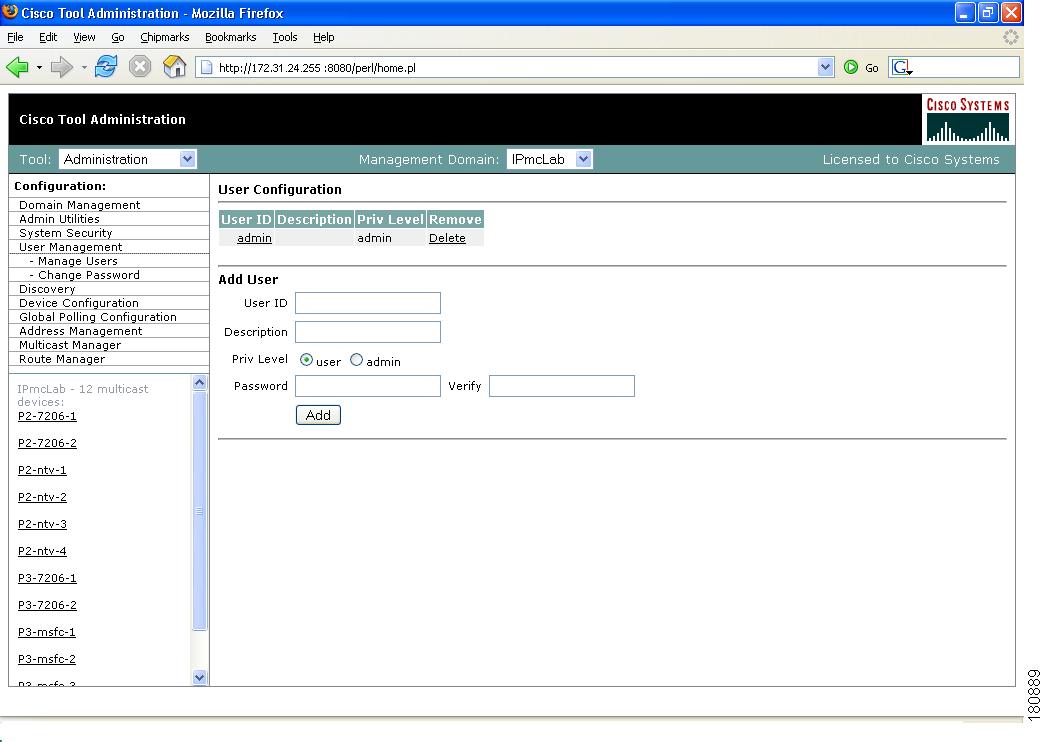
User Management
The CMM provides two privilege levels: user and admin. You need an administrator account to configure multicast domains, run discovery, create users, create health checks, and use the Admin Utilities functions.
You can configure users and passwords using the User Management pages:
•
•
Figure 1-7 Manage Users—User Configuration
To add a new user:
Step 1
Step 2
Step 3
Step 4
Step 5
Clicking on the User ID link in the table allows you to edit the user's description. Click Delete to delete a user (only an administrator can delete users).
Note
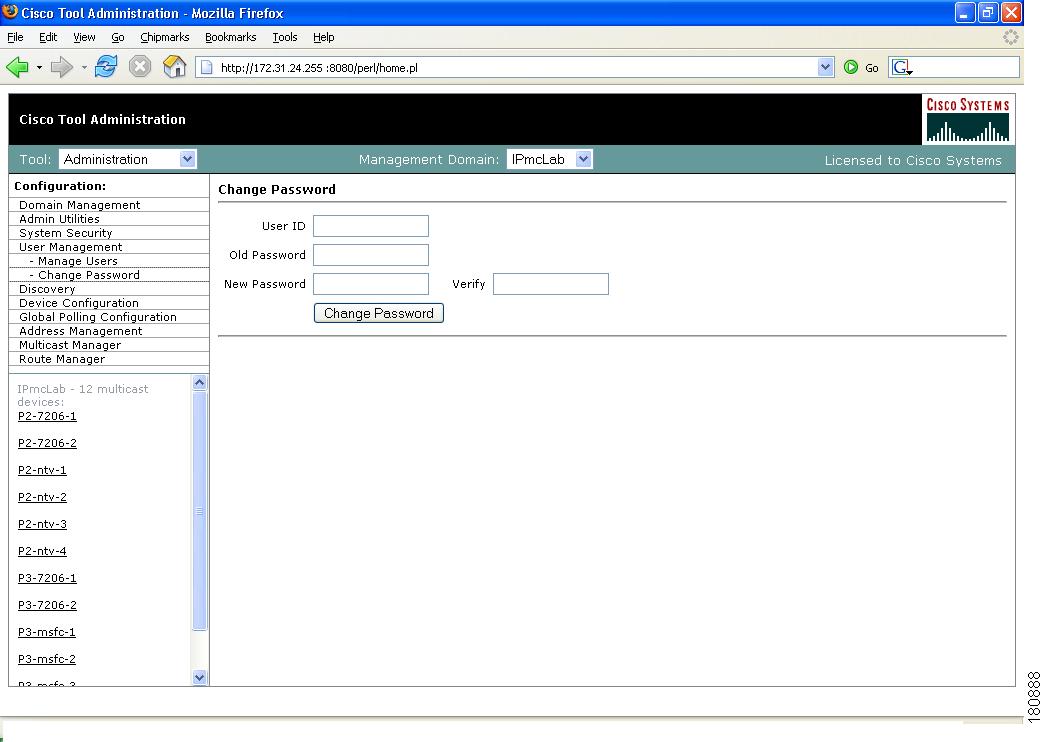
Users can change their password by clicking Change Password.
Figure 1-8 Manage Users—Change Password
To change your password:
Step 1
Step 2
Step 3
Step 4
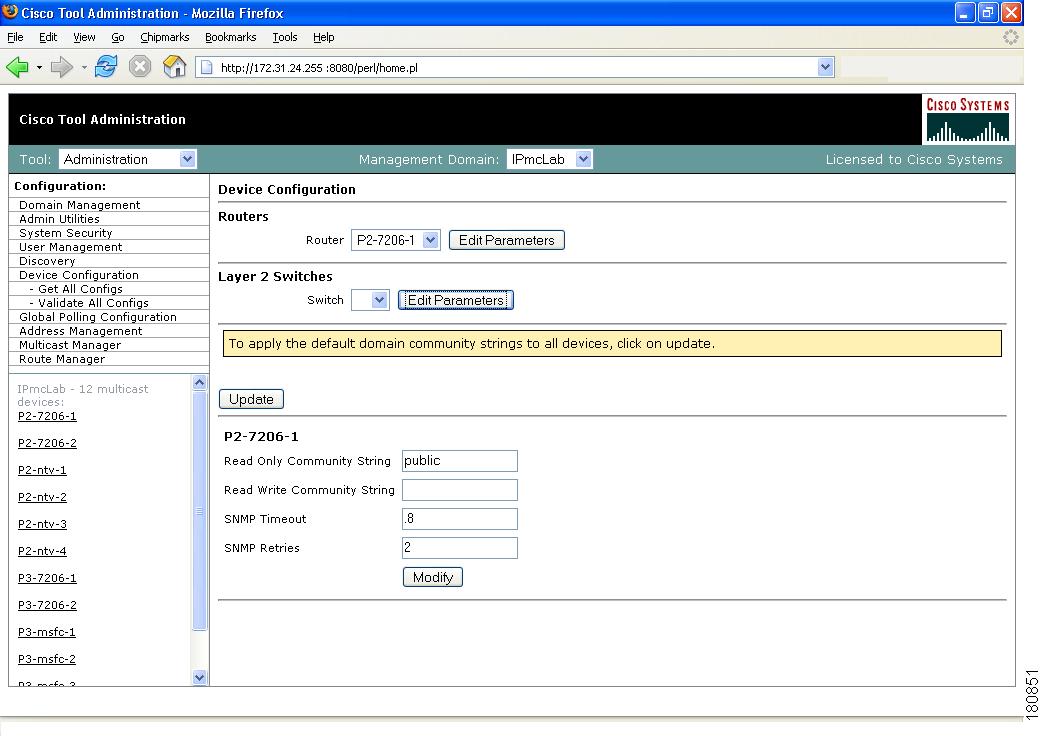
Device Configuration
Using the Device Configuration page, you can change the SNMP read key of a single device. Select a Router or Switch, then click Edit Parameters.
Figure 1-9 Device Configuration—Edit Parameters
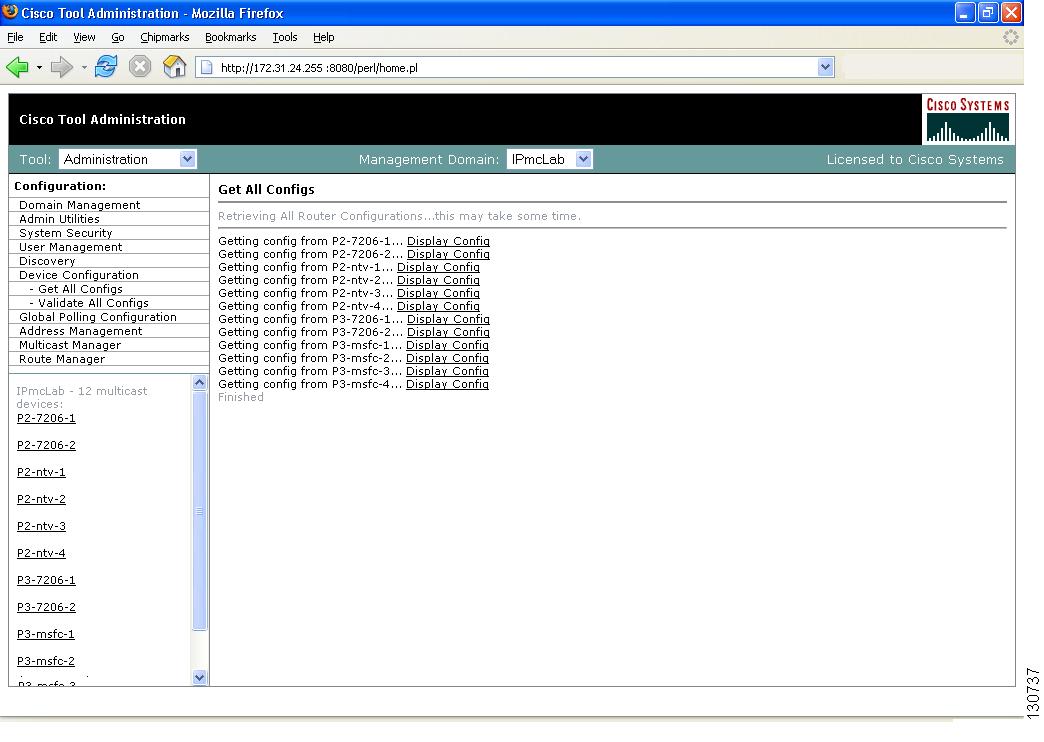
Downloading Router Configurations
You can download the router configuration for each router in the database to the CMM. Under the Device Configuration menu at left, click Get All Configs.
If you entered the SNMP write key for the router when you set up the domain, CMM can download and display configuration files for the router.
Note
Figure 1-10 Get All Configs
This process may take some time, depending on the number of routers in the current domain.
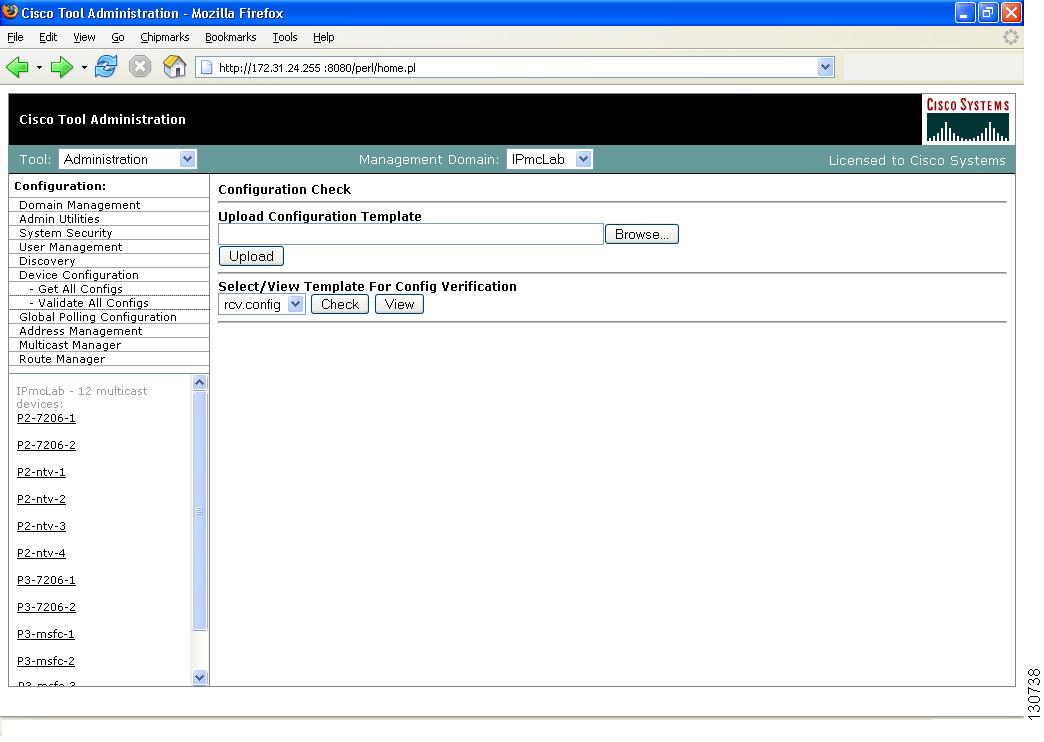
Validating Router Configurations
Using the CMM, you can verify if IOS commands exist on a router, either globally, or on a single interface. Router configurations for a domain are verified against a template. Several sample templates are included with the application, or you can create a user-defined template, which must be a text (.txt) file containing a list of IOS commands to check. For example, to check for global commands, start the text file with the word "global." To check interface commands as well, add the word "interface" and so on. You can check for global and interface at the same time, as in the example:
GLOBALservice timestamps log datetime msec localtime show-timezoneservice password-encryptionloggingno logging consoleno ip source-routeip subnet zeroip classlessINTERFACEip pim-sparse-modeTo select a template and initiate validation:
Note
Step 1
Step 2
Step 3
a.
b.
Step 4
Step 5
Step 6
Figure 1-11 Configuration Check
The CMM checks each router in the database for the existence of the commands in the template you specified. Output looks similar to Figure 1-12.
Figure 1-12 Configuration Check—Output
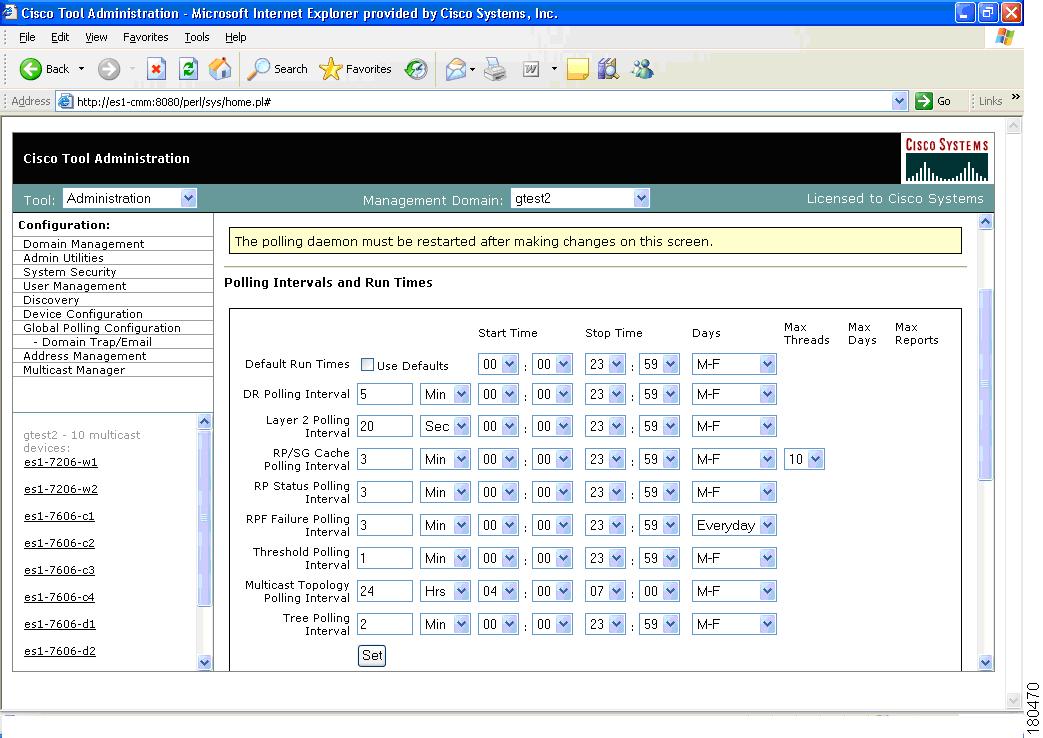
Global Polling Configuration
You can configure each polling element to start and stop at specific times. Each element also has their own polling intervals. You can configure these values through the Global Polling Configuration page.
Note
Figure 1-13 Global Polling Configuration
The Global Polling Configuration page contains:
Note
Refresh Status
The status line indicates how long the polling daemon has been running and how it was started. Click Refresh Status to update the status information.
Start
Starts the polling daemon globally.
Stop
Stops the polling daemon globally.
Restart
Restarts the polling daemon globally. Each time you change a polling interval, click Restart.
Default Run Times—Use Defaults
Selecting the Use Defaults checkbox sets all the start/stop times and days to the default values.
DR Polling Interval
Checks the status of all DRs in the network. If a user changes a DR, an SNMP trap is sent.
Layer 2 Polling Interval
Amount of time between polling of the Layer 2 ports.
RP/SG Cache Polling Interval
For certain CMM data, such as the data within the Multicast Diagnostics page (see the "Show All Groups" section) the CMM queries each RP, collates a list of active sources, and groups and displays them. There are 2 ways the CMM can accomplish this: dynamically when the command is entered, or the CMM can build a cache of this information, and when the command is entered, the cache is queried. Caching is enabled on the System Configuration page (see the "Domain Management" section) and the RP/SG Cache Polling Interval is the time period that this cache is refreshed.
Deciding whether caching should be turned on depends upon the number of RPs, sources, and groups. If the Multicast Diagnostics page takes a while to display all groups, you may want to turn caching on.
The Max Threads value controls how many devices are queried simultaneously. Values can be 1-10. Queries used for RP/SG Cache Polling are SNMP getbulk queries that can potentially return large amounts of data. To address timeouts, you can reduce the number of Max Threads and/or adjust the SNMP timeout and retry values on the System Configuration page (see the "Domain Management" section).
RP Status Polling Interval
RP Status Polling queries the sysUpTime of the RPs configured on the RP Polling Configuration page (see the "RP Polling" section).
The purpose of this query is to report availability of the RPs. If the RP responds, an rpReachable trap is sent. If the RP does not respond, an rpUnreachable trap is sent. Since at least one of these traps is sent at each polling interval, you can also use them to ensure that the polling daemon is up and running.
RPF Failure Polling Interval
Time interval that each router will be polled for each source and group configured to check the number of RPF failures.
Threshold Polling Interval
Time interval that each router will be polled for the existence of each source and group configured, and CMM will ensure that no thresholds are exceeded.
Multicast Topology Polling Interval
Topology polling queries the sysUpTime of each router in the multicast domain to see if it has been reloaded. If it has, the polling daemon launches a Single Router Discovery of that device in the background, to ensure the SNMP ifIndexes have not changed.
Tree Polling Interval
Time interval that the monitored trees are drawn and compared with their baselines.
Set
Sets the values you enter.
You can enable or disable the continuous sending of PPS threshold traps using the Enable Rising/Falling and Normalized Traps for Thresholds section:
•
•
•
You can add or remove trap receivers using the Configure Global Default SNMP Trap Receivers section. The SNMP trap receivers specified here are only used if domain-specific SNMP trap receivers are not specified. Domain-specific trap receivers are specified from the Trap Receiver/Email Polling Configuration page (see the "Configuring Domain-Specific Trap Receivers and Email Addresses" section).
You can add or remove Email addresses using the Configure Global Default Email Addresses for Event Notification section. Email addresses are notified of SSG exceptions and threshold and existence events. The Email addresses specified here are only used if domain-specific Email addresses are not specified. Domain-specific Email addresses are specified from the Trap Receiver/Email Polling Configuration page (see the "Configuring Domain-Specific Trap Receivers and Email Addresses" section).
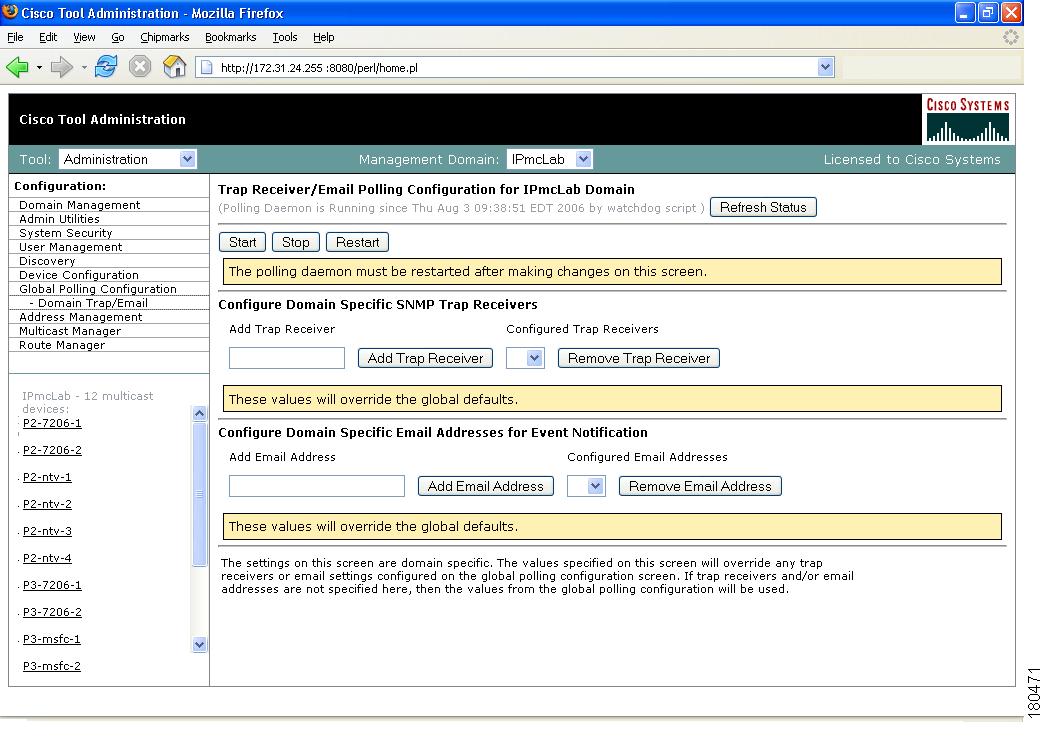
Configuring Domain-Specific Trap Receivers and Email Addresses
You can configure the CMM to send domain-specific SNMP trap receivers or emails. Under the Global Polling Configuration menu at left, click Domain Trap/Email. The Trap Receiver/Email Polling Configuration page appears.
Figure 1-14 Trap Receiver/Email Polling Configuration
You can add or remove trap receivers using the Configure Domain Specific SNMP Trap Receivers section. The SNMP trap receivers specified here are only used if global SNMP trap receivers are not specified. Global trap receivers are specified from the Configure Global Default SNMP Trap Receivers page (see the "Global Polling Configuration" section).
You can add or remove Email addresses using the Configure Domain Specific Email Addresses for Event Notification section. Email addresses are notified of SSG exceptions and threshold and existence events. The Email addresses specified here are only used if global Email addresses are not specified. Global Email addresses are specified from the Configure Global Default SNMP Trap Receivers page (see the "Global Polling Configuration" section).
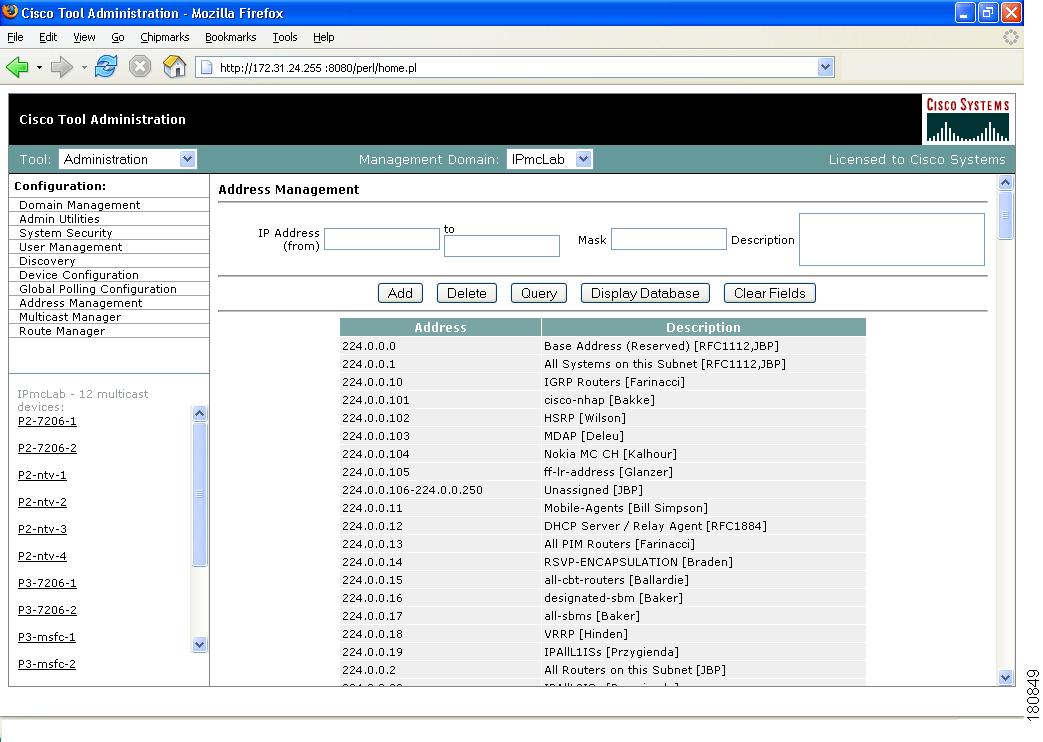
Address Management
Using the Address Management page, you can enter multicast group and source addresses into the database with a description. When the CMM displays these sources and groups, the descriptions will be added for easy recognition.
The database is pre-populated with all of the reserved address space.
Figure 1-15 Address Management
Multicast Manager
The Multicast Manager contains:
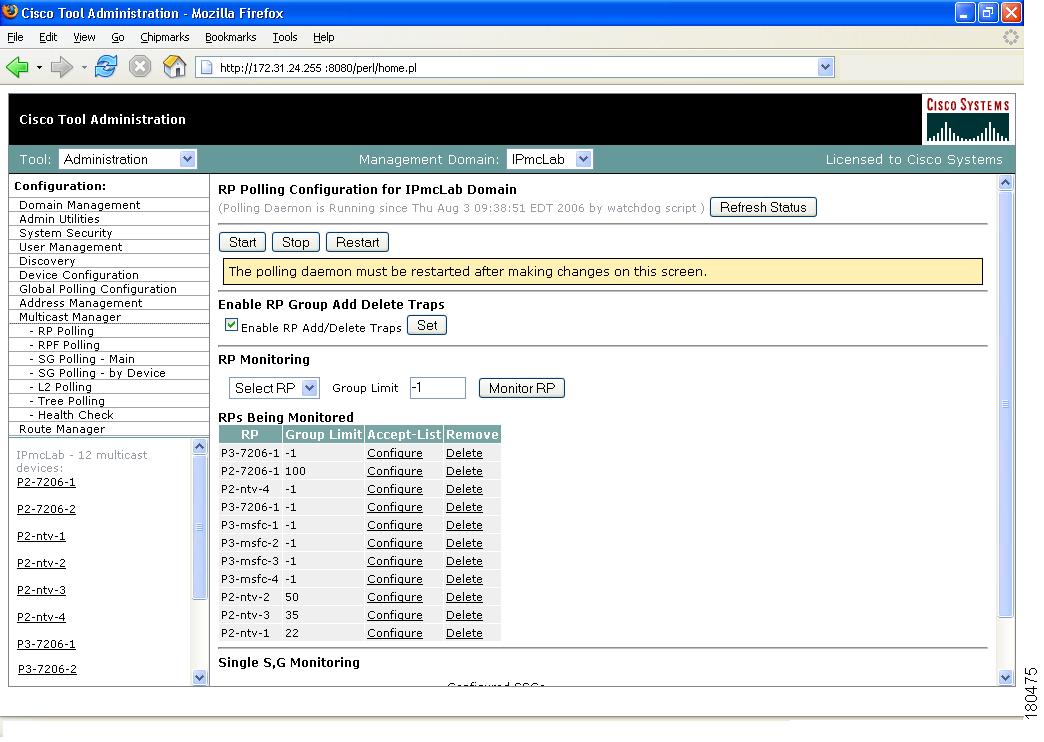
RP Polling
Using the RP Polling Configuration page, you can enable the CMM to:
1.
2.
3.
4.
Note
Figure 1-16 RP Polling Configuration
The RP Polling Configuration page contains:
Refresh Status
The status line indicates how long the polling daemon has been running and how it was started. Click Refresh Status to update the status information.
Start
Starts the polling daemon globally.
Stop
Stops the polling daemon globally.
Restart
Restarts the polling daemon globally. Each time you change a polling interval, click Restart.
Enable RP Group Add Delete Traps
Click the checkbox to monitor all leaves and joins, which are then reported within the RP Polling Report page (see the "RP Polling Report" section).
RP Monitoring
To monitor an RP, select the RP from the box.
To monitor a specific number of groups, enter a number in the Group Limit box.
Click Monitor RP.
If the group limit is exceeded, a report is generated within the RP Group Threshold Report page (see the "RP Group Threshold Report" section).
RPs Being Monitored
Lists:
•
•
•
•
Single S, G Monitoring
Enter the group IP address. If more than one source becomes active for this group, a report is generated.
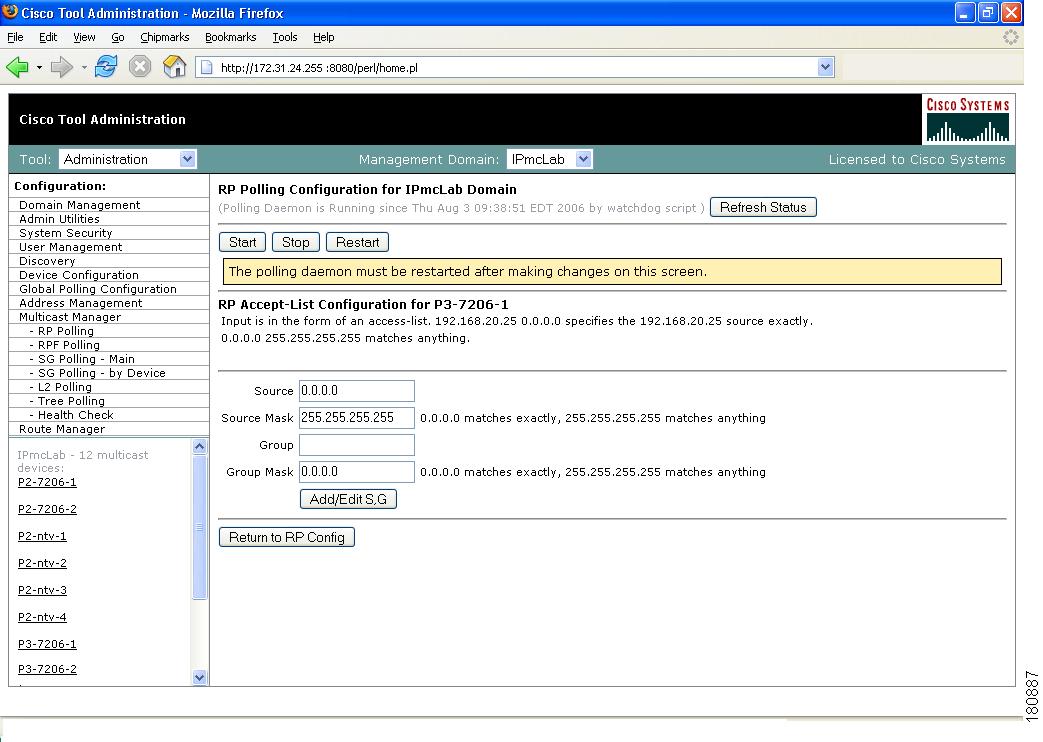
RP Accept List Configuration
The RP Accept List Configuration section lets you monitor the active sources and groups on a specific RP.
Figure 1-17 RP Accept List Configuration
The RP Accept List Configuration section contains:
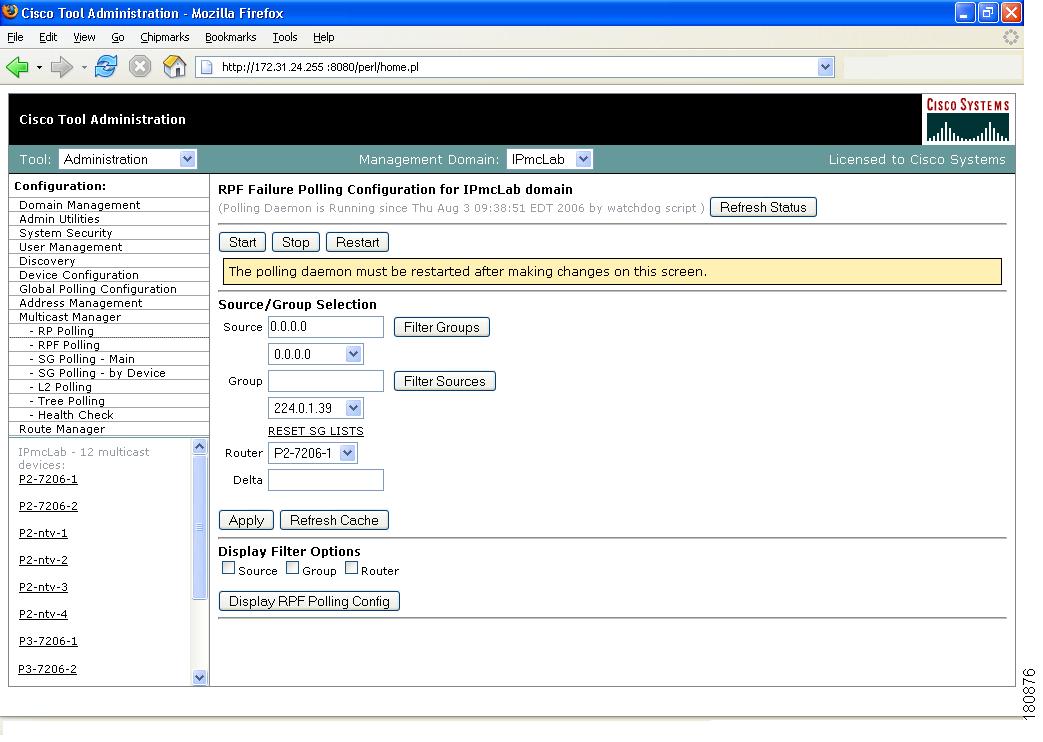
RPF Polling
Using the CMM, you can monitor RPF failures for a particular source and group on any selected router.
If any monitored source and group begins to experience RPF failures that rise above the delta, then SNMP traps can be sent, and a report generated, which you can view under RPF Failures (see the "RPF Failures" section).
You can select the source and group from the list, or you can enter them manually. If there are a lot of sources and/or groups, you can use the filter option, to ensure you are selecting an S,G that actually exists in the network. The filter option displays only the sources for a selected group, or only the groups for a selected source. To reset the lists, click Reset S,G Lists.
Figure 1-18 RPF Failure Polling Configuration
The RP Failure Polling Configuration page contains:
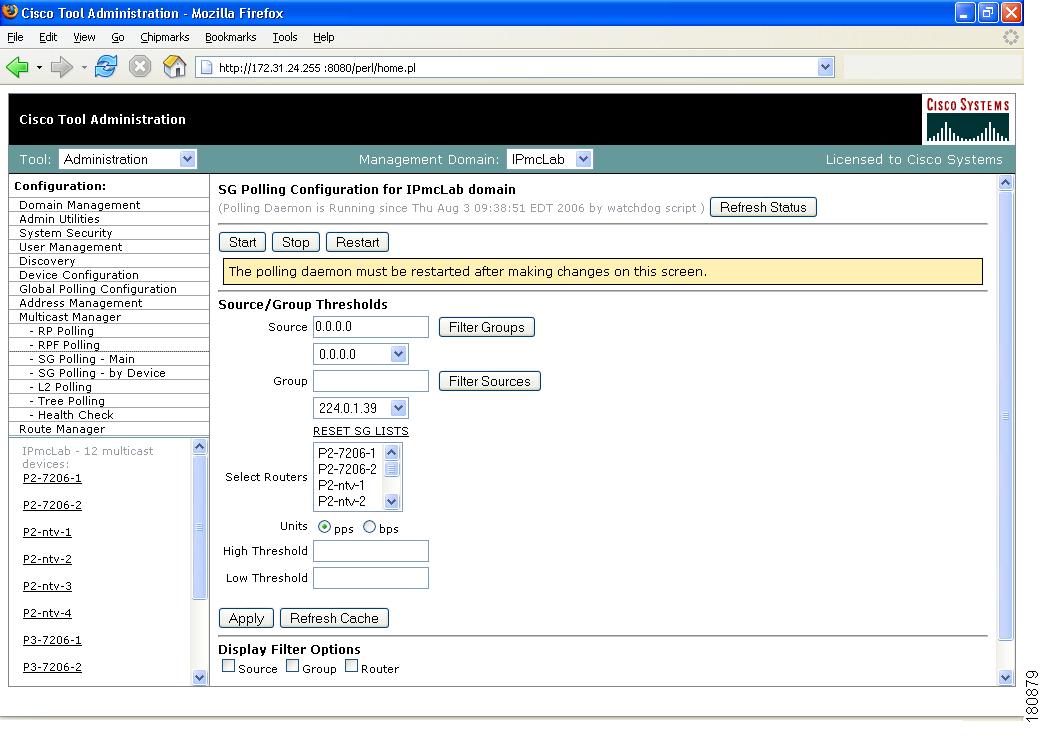
SG Polling—Main
Using the CMM, you can poll sources and groups with high and low thresholds.
You can select the source and group from the list, or you can enter them manually. If there are a lot of sources and/or groups, you can use the filter option, to ensure you are selecting an S,G that actually exists in the network. The filter option displays only the sources for a selected group, or only the groups for a selected source.
Figure 1-19 SG Polling Configuration
The SG Polling Configuration page contains:
Refresh Status
The status line indicates how long the polling daemon has been running and how it was started. Click Refresh Status to update the status information.
Start
Starts the polling daemon globally.
Stop
Stops the polling daemon globally.
Restart
Restarts the polling daemon globally. Each time you change a polling interval, click Restart.
Source
Enter or select the IP address of the source to monitor.
Filter Groups
Filters the output to contain only the relevant groups.
Group
Enter or select the IP address of the group to monitor.
Filter Sources
Filters the output to contain only the relevant sources.
Reset SG Lists
Clears any entries and refreshes the source and group lists.
Select Routers
Enter the router name.
Units
Select either packets per sampling period (pps) or bits per sampling period (bps).
High Threshold
Enter the high threshold that, if exceeded, generates a report.
Low Threshold
Enter the low threshold that, if exceeded, generates a report.
Apply
Applies and saves the changes.
Refresh Cache
If you are using S,G caching, the cache contents appear. Click Refresh Cache to refresh the table of sources and groups.
Display Filter Options
You can filter the list of monitored sources and groups by limiting to source, group, and/or router.
Display Configured SGs
Displays all the sources and groups you are currently monitoring (see the "Current Source/Group Polling Configuration" section).
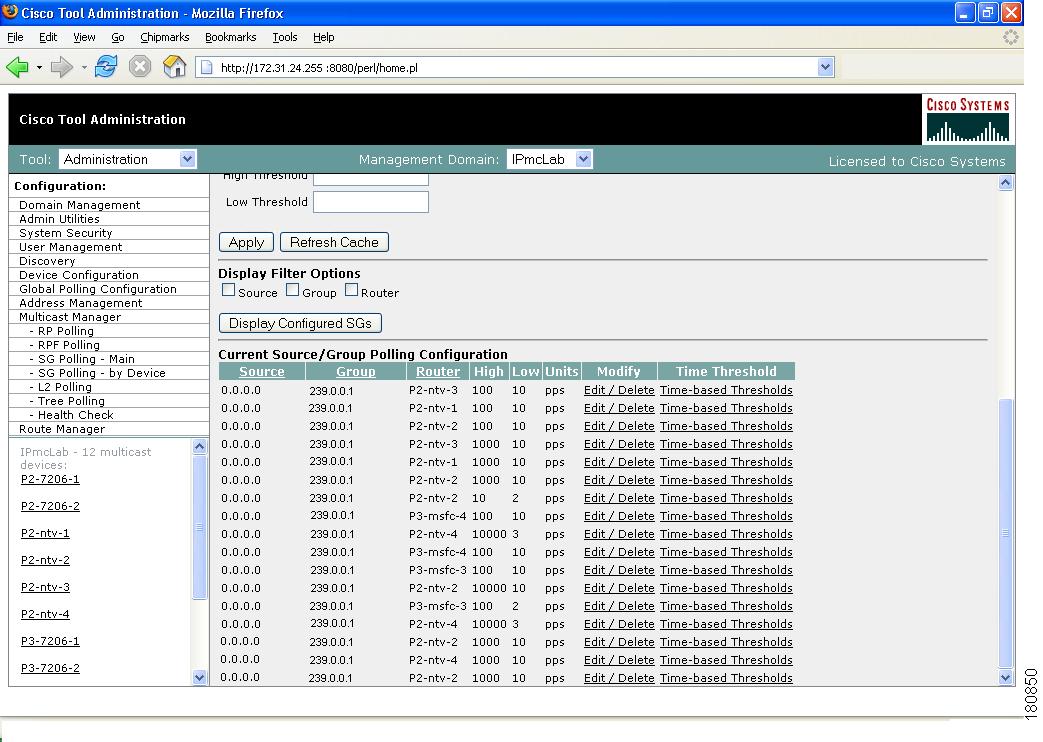
Current Source/Group Polling Configuration
The Current Source/Group Polling Configuration section displays all the sources and groups you are currently monitoring.
Figure 1-20 Current Source/Group Polling Configuration
The Current Source/Group Polling Configuration section shows you all monitored sources and groups in a tabular format.
•
•
Each time a source and group exceeds a threshold, a trap is sent and a report is generated.
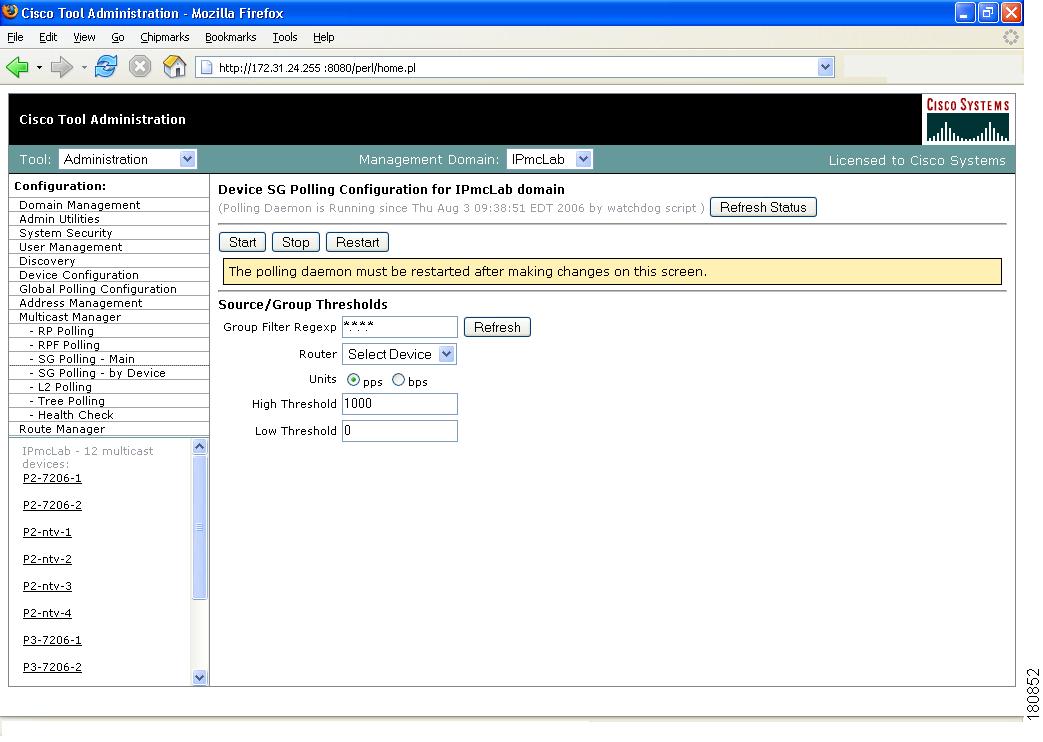
SG Polling—by Device
You can select a particular router using the The Device SG Polling Configuration page, and you can configure which sources and routers to monitor on the specific device.
Figure 1-21 Device SG Polling Configuration
The Device SG Polling Configuration page contains:
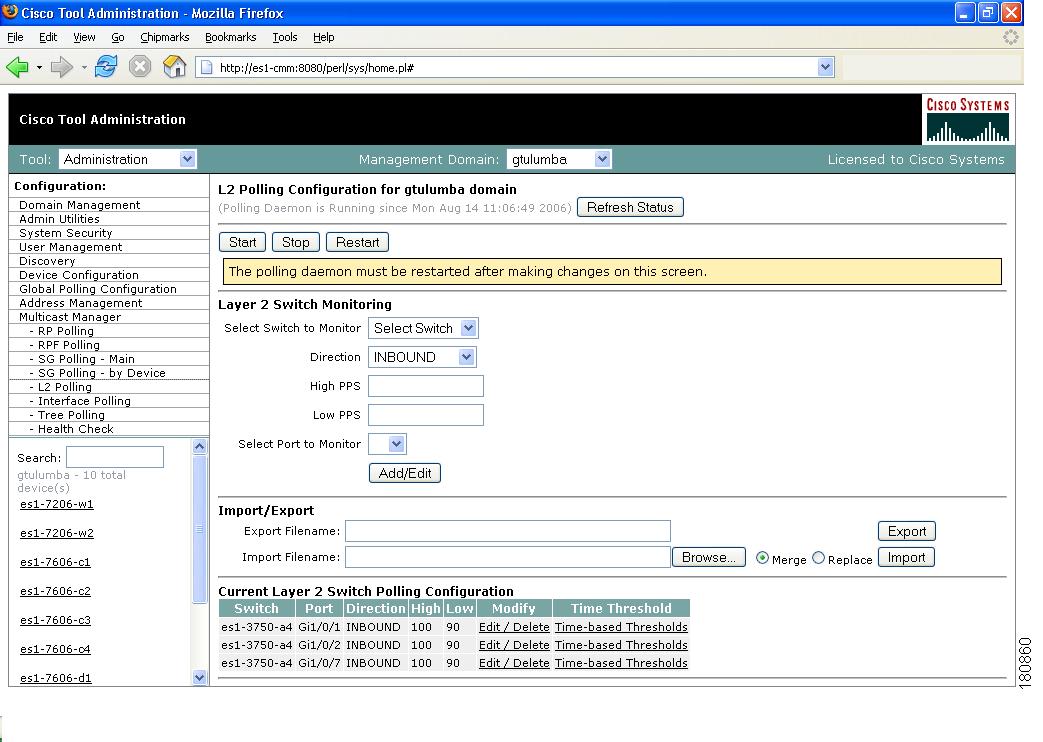
L2 Polling
You can add Layer 2 switches to the CMM individually, or you can import a list (see the "Adding Layer 2 Switches to Discovery" section). The CMM can monitor the total number of multicast packets inbound and/or outbound from any Layer 2 port.
You can also configure up to 50 different time of day thresholds for each port.
Figure 1-22 L2 Polling Configuration
The L2 Polling Configuration page contains:
The Current Layer 2 Switch Polling Configuration section shows you all monitored switches and ports in a tabular format.
•
•
Each time a port exceeds a threshold, a trap is sent and a report is generated.
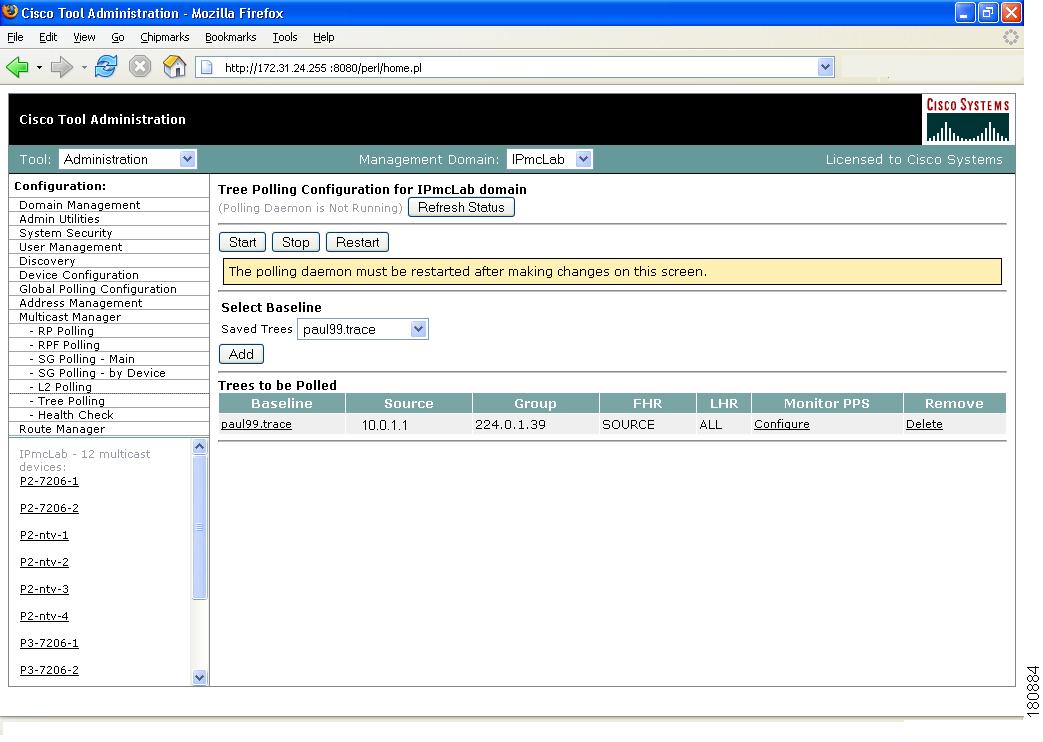
Tree Polling
Before you can monitor a tree using the Tree Polling Configuration page, you must build a multicast tree and save it to the database as a baseline (see the "Show All Groups" section).
Once saved, the trees appear in the Saved Trees list of the Tree Polling Configuration page. To monitor a tree, select the tree name, and click Add. The tree is drawn in the background for every interval that you set up for tree polling (see the Global Polling Configuration). This tree is compared with the tree saved in the database. If it is different, a trap is sent, and a report generated.
Figure 1-23 Tree Polling Configuration
The Tree Polling Configuration page contains:
Trees to be Polled
Using the Trees to be Polled table, you can:
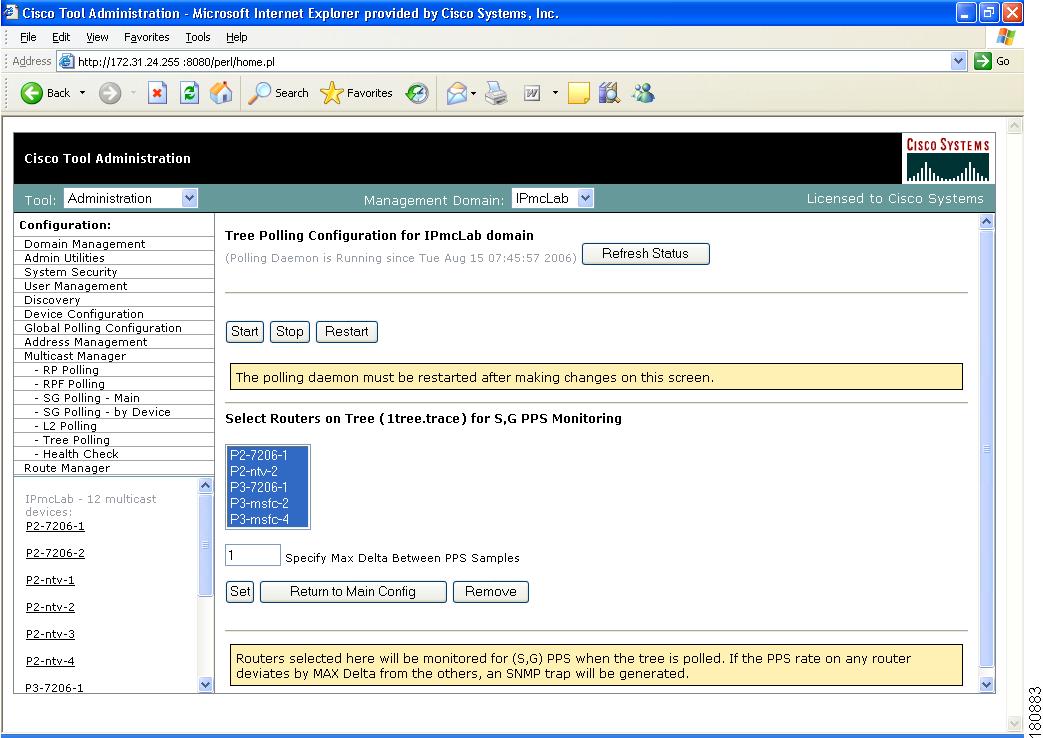
•
•
Figure 1-24 Tree Polling Configuration—Configure
•
Note
•
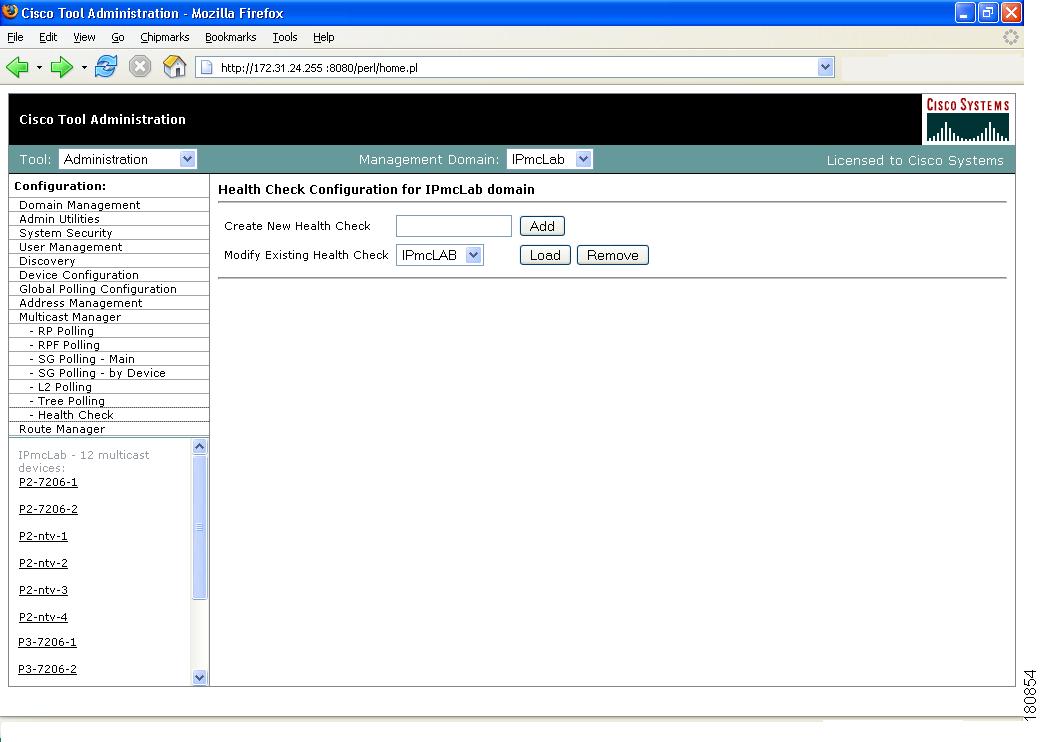
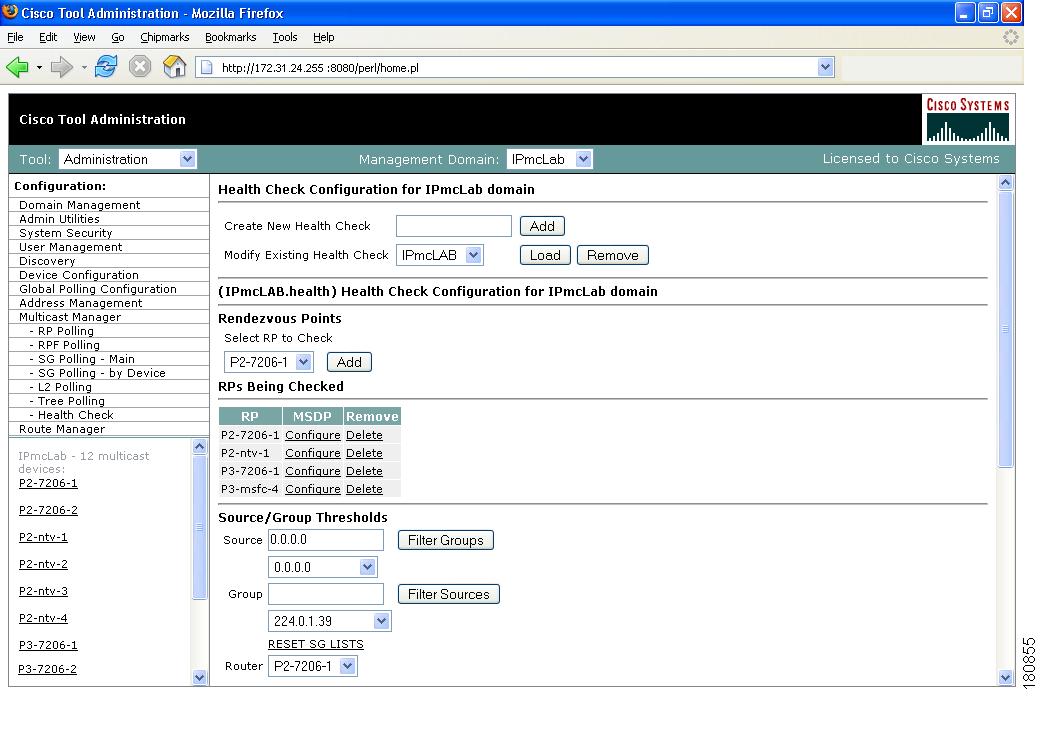
Health Check
Health checks give you an immediate status update on several key multicast network indicators, including:
•
•
•
•
You can create several health checks. Health checks run dynamically, meaning they must be user-initiated.
Figure 1-25 Health Check Configuration
The Health Check page contains:
Create New Health Check
Type a name for the health check.
Add
Adds a new named health check.
Modify Existing Health Check
Select the named health check you want to modify.
Load
Loads an existing named health check for modification (see the "Modifying Health Checks" section).
Remove
Deletes the health check selected in the Modify Existing Health Check box.
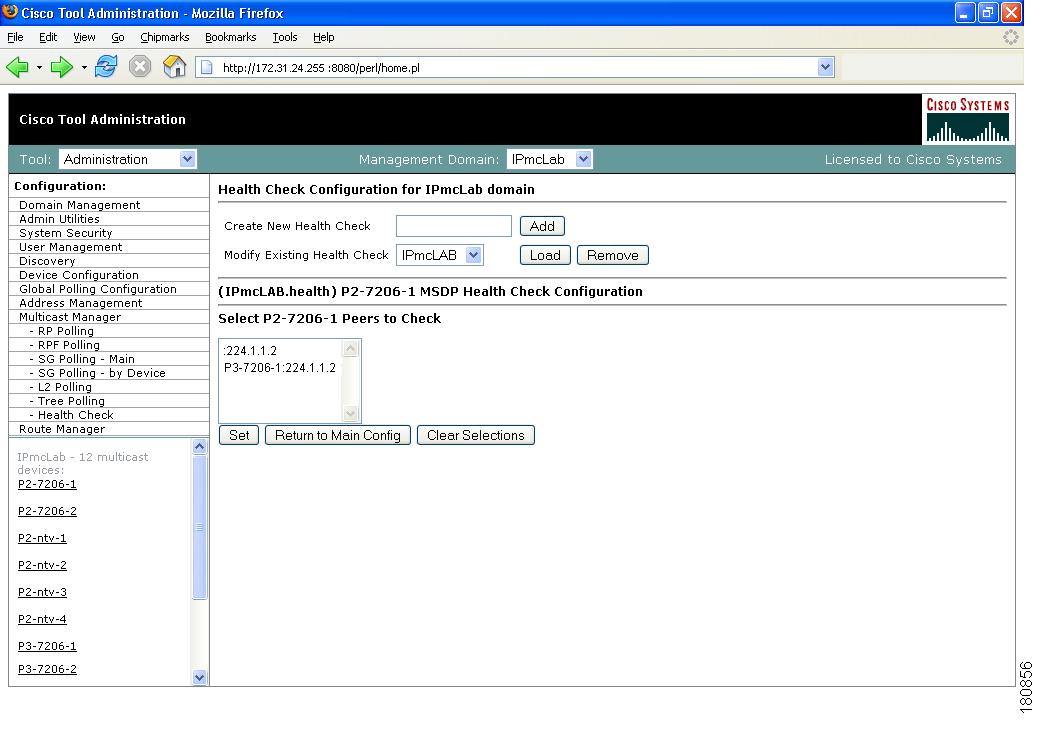
Modifying Health Checks
The Health Check Configuration—Modification section lets you modify a selected health check.
Figure 1-26 Health Check Configuration—Modification
You can also check MSDP peering of the selected router by clicking Configure within the RPs Being Checked table.
Figure 1-27 Health Check Configuration—Peers
Select the peers you want to check, then click Set. You are returned to the Health Check Configuration Modification page. Select the sources, groups and routers to check. To check the status of multicast trees, select the baseline under Forwarding Trees and click Add.
To run the actual health check, see the "Health Check" section.
Using the Multicast Manager Tool
You can view or monitor data using the CMM Multicast Manager Tool, containing these web pages:
•
•
Home
The Home page shows the last 20 events (see the "Latest Events" section).
Figure 1-28 Multicast Manager Home Page
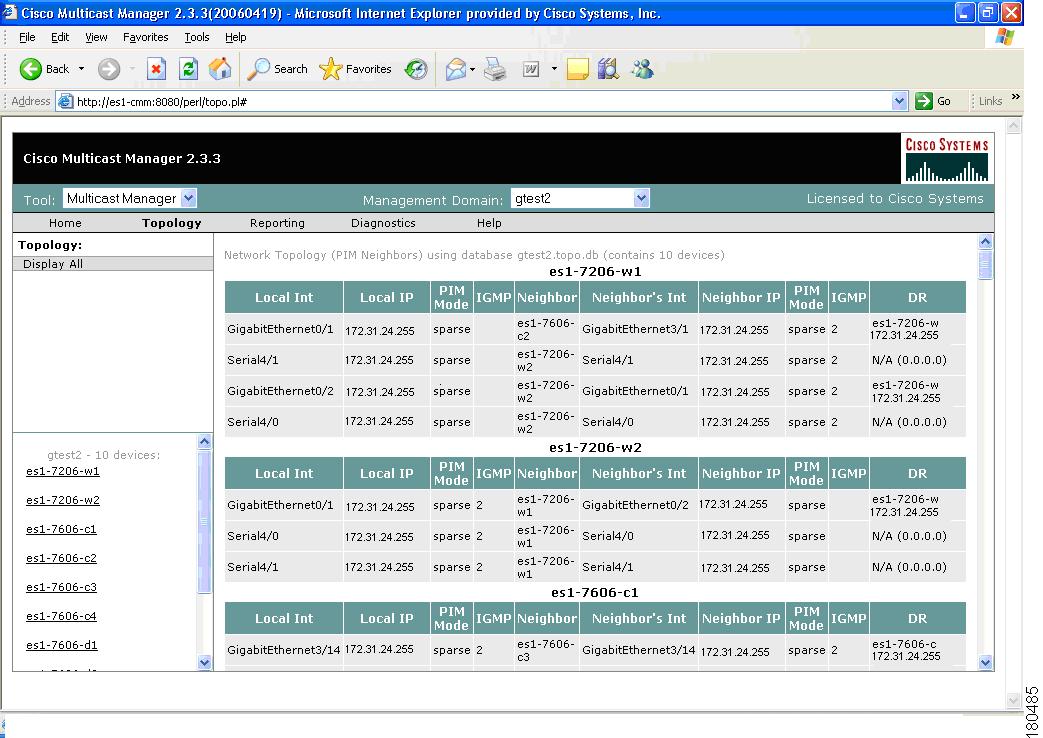
Topology
Using Topology, you can display routers and their multicast information in the database, on an individual basis, or by showing the complete database.
To see the complete database, click Display All. Router names appear at the top of each table.
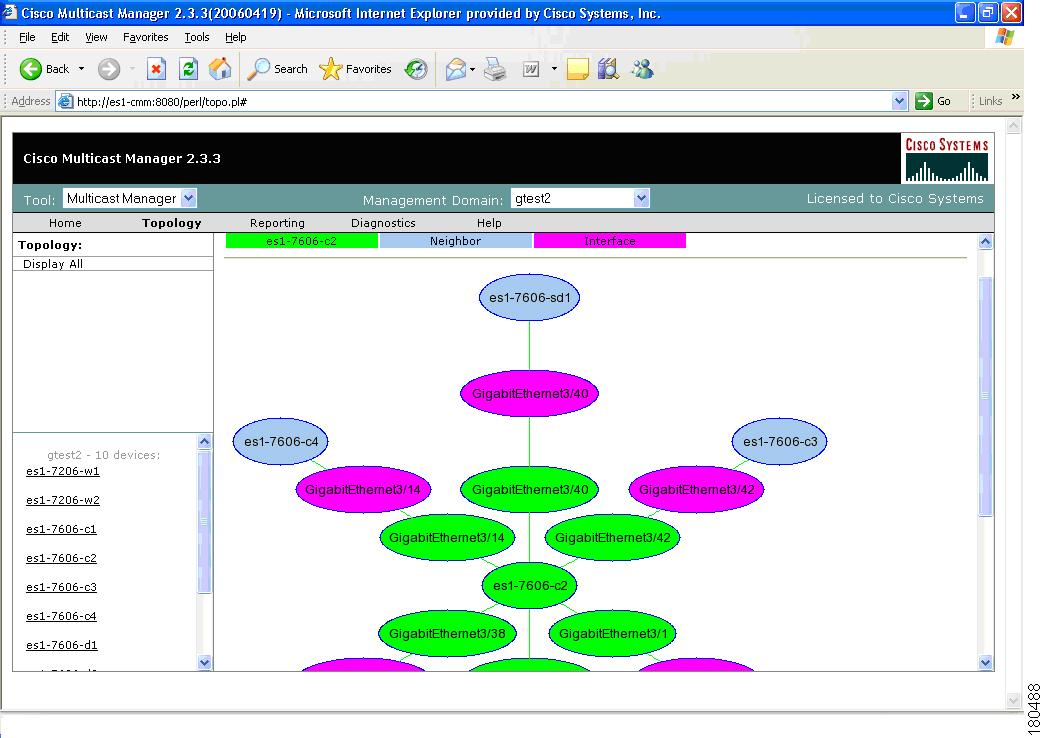
Figure 1-29 Topology Display All
The Topology Display All page contains:
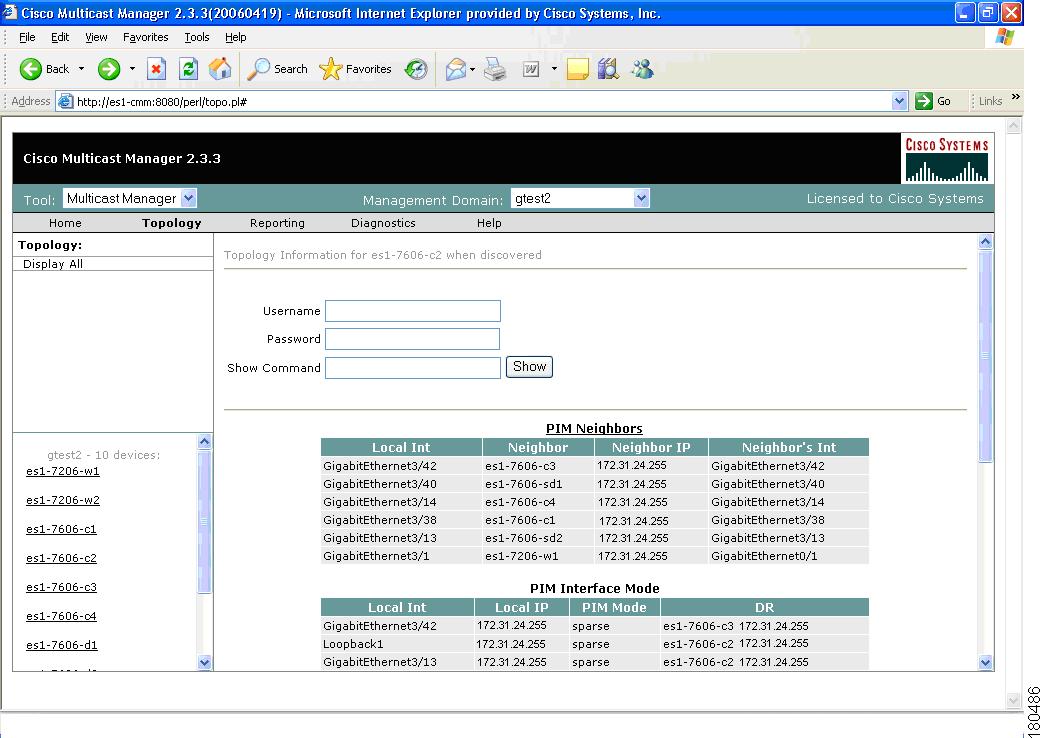
To see topology for an individual router, click a router from the list pane at lower left.
Figure 1-30 Topology for an Individual Router
The Topology for an Individual Router page contains:
Note
To see a topological display of the routers, click on PIM Neighbors.
Figure 1-31 PIM Neighbors
On the PIM Neighbors page:
•
•
•
Reporting
With the Reporting tool, you can view:
•
•
•
The following options are available under reporting:
Note
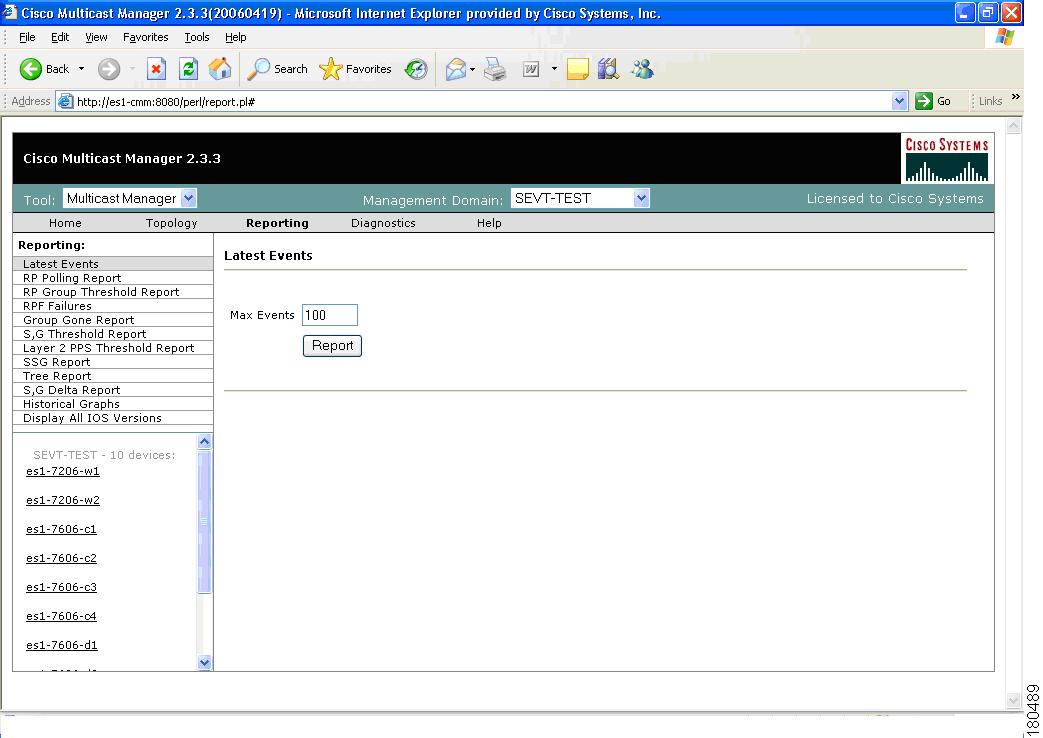
Latest Events
Using the Latest Events page, you can set a configurable amount of the latest events generated by the CMM. Clicking Report lists the traps in time order.
Figure 1-32 Latest Events
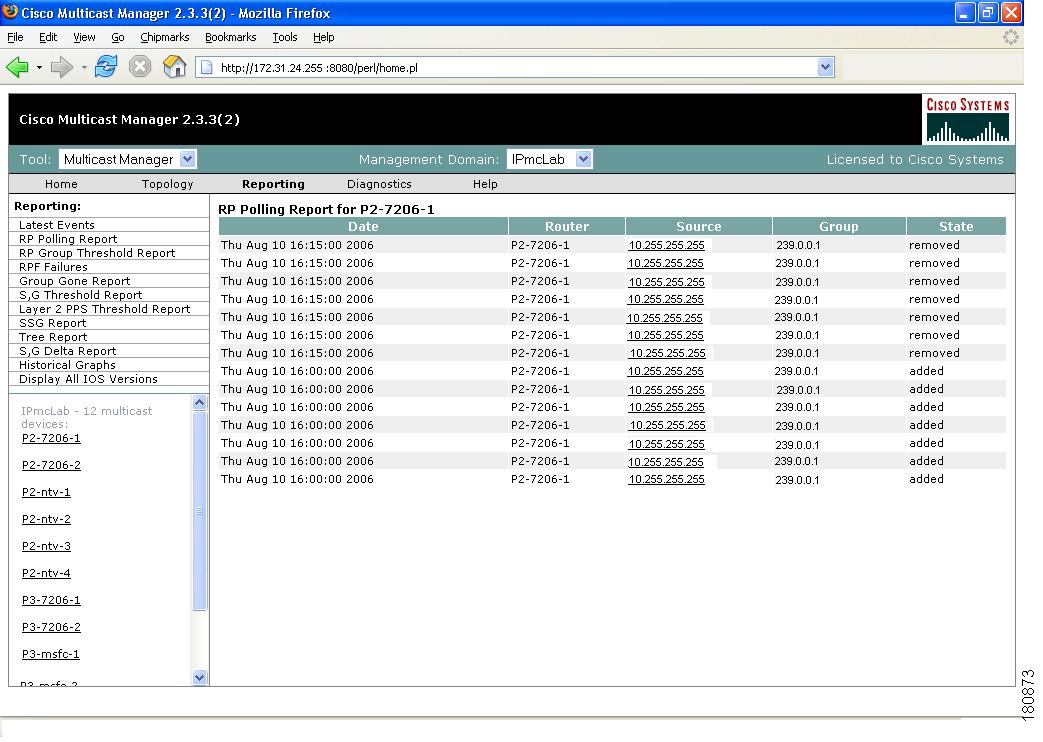
RP Polling Report
Using the RP Polling Report, you can monitor:
•
•
•
To generate an RP Polling report:
Step 1
Step 2
Step 3
Figure 1-33 RP Polling Report
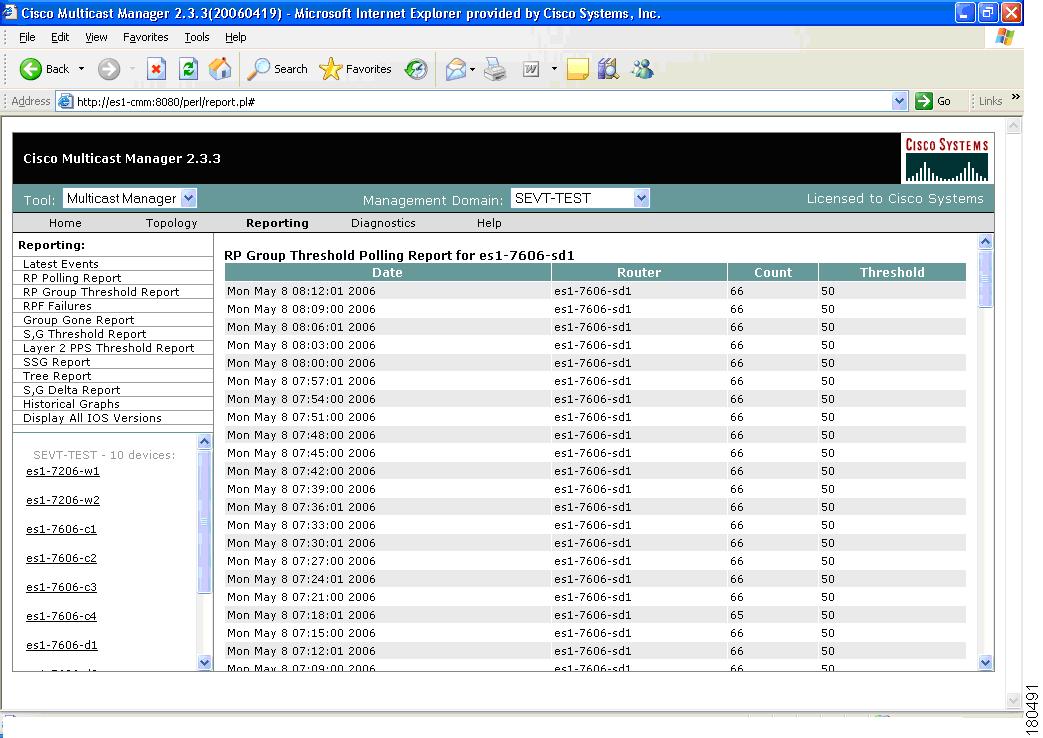
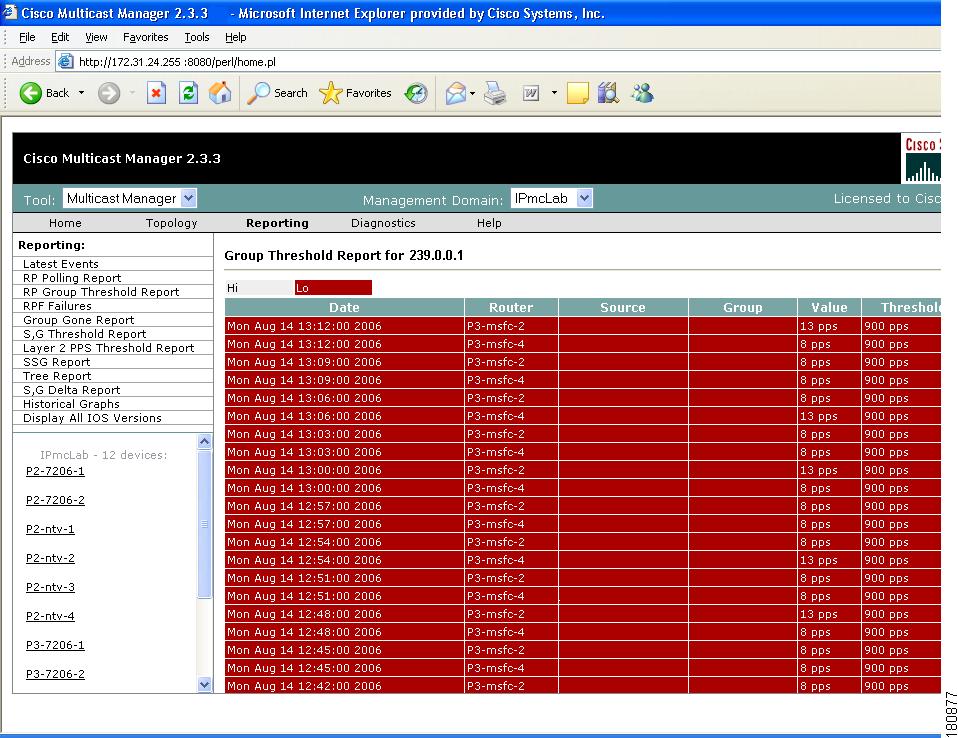
RP Group Threshold Report
Using the RP Group Threshold Report, you can monitor a list of RPs that have exceeded their active number of groups limit.
To generate an RP Group Threshold report:
Step 1
Step 2
Step 3
Figure 1-34 RP Group Threshold Polling Report
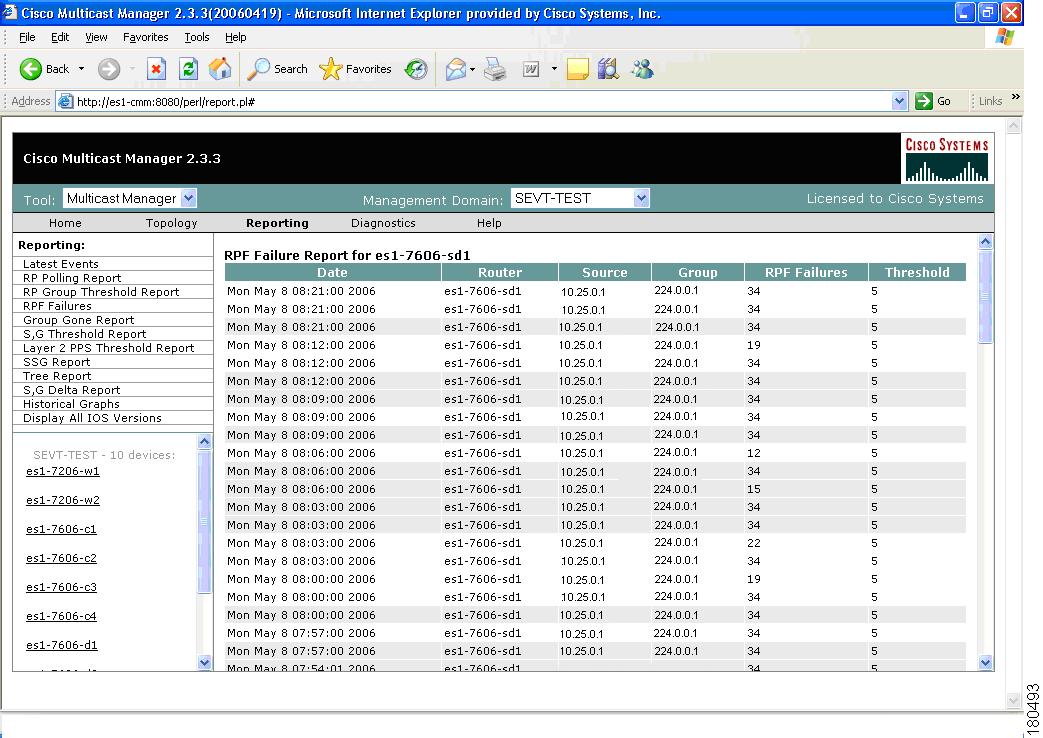
RPF Failures
Using the RPF Failures Report, you can monitor all routers that are experiencing RPF failures above the configured threshold for the configured sources and groups.
To generate an RPF Failures report:
Step 1
Step 2
Step 3
Figure 1-35 RPF Failures Report
Group Gone Report
The Group Gone Report is currently unsupported. Functionality in this page has moved to the S,G Polling Report.
S,G Threshold Report
Using the S,G Threshold Report, you can monitor every source and group that has exceeded its configured threshold.
To generate an S,G Threshold report:
Step 1
Step 2
Step 3
Figure 1-36 S,G Threshold Report
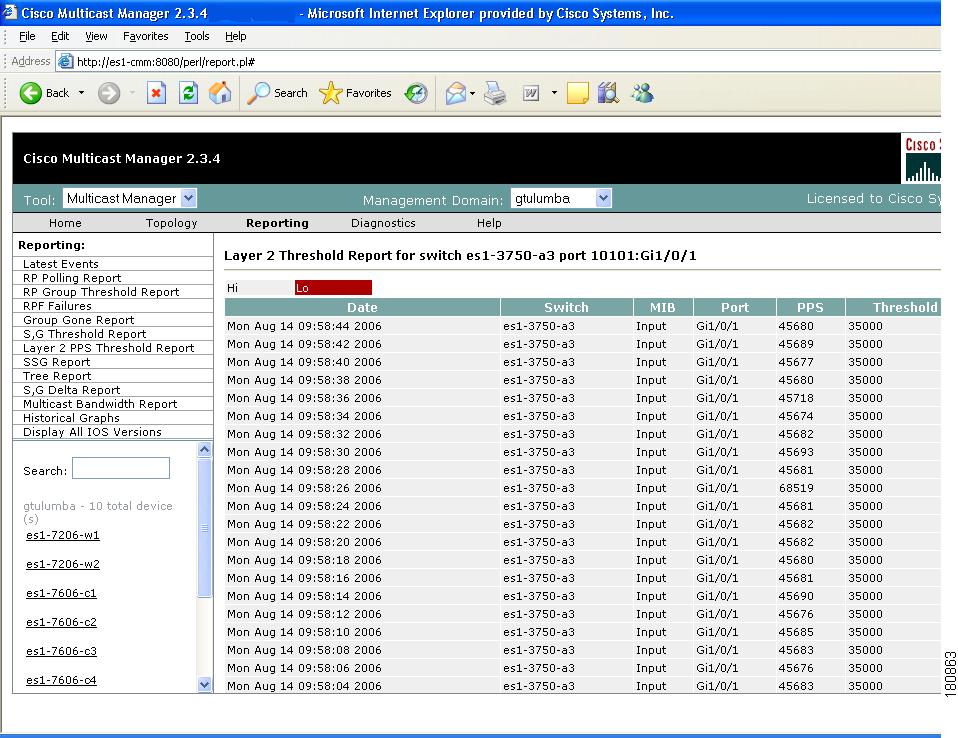
Layer 2 PPS Threshold Report
Using the Layer 2 PPS Threshold Report, you can monitor all Layer 2 ports that have exceeded their configured thresholds.
To generate a Layer 2 PPS Threshold Report:
Step 1
Step 2
Step 3
Note
Figure 1-37 Layer 2 PPS Threshold Report
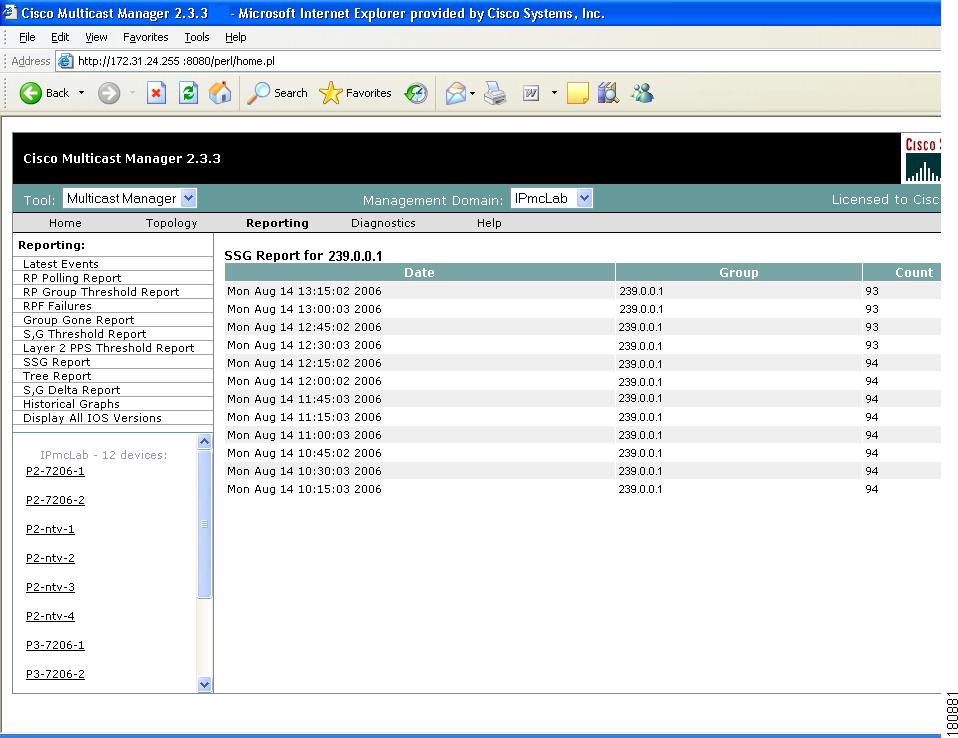
SSG Report
Using the SSG Report, you can display information about groups that have more than one sender.
To generate an SSG Report:
Step 1
Step 2
Figure 1-38 SSG Report
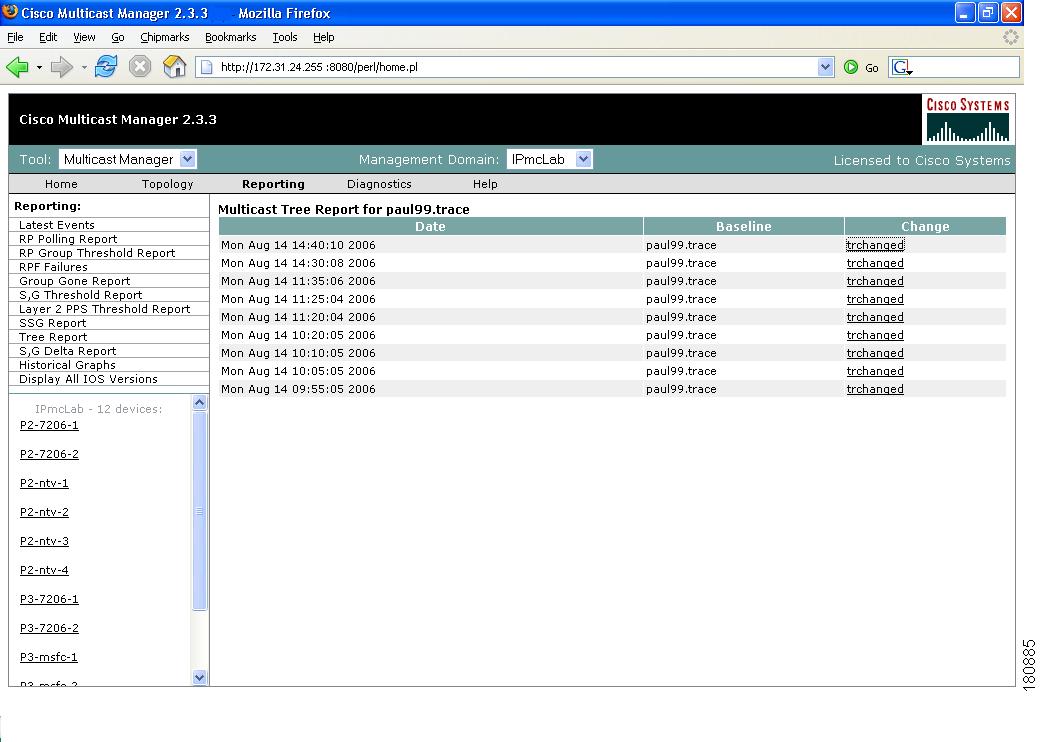
Tree Report
Using the Multicast Tree Report, you can draw and save multicast trees (called baselines). You can then set up the CMM to draw trees that have been saved in the background, and report any changes (only changes to Layer 3 devices are reported).
Note
If a multicast tree you are monitoring changes, a trap is generated. You can then view the baseline and the changed tree. Changes are highlighted in the text and also in the drawing.
To generate a Multicast Tree Report:
Step 1
Step 2
Step 3
Figure 1-39 Tree Report
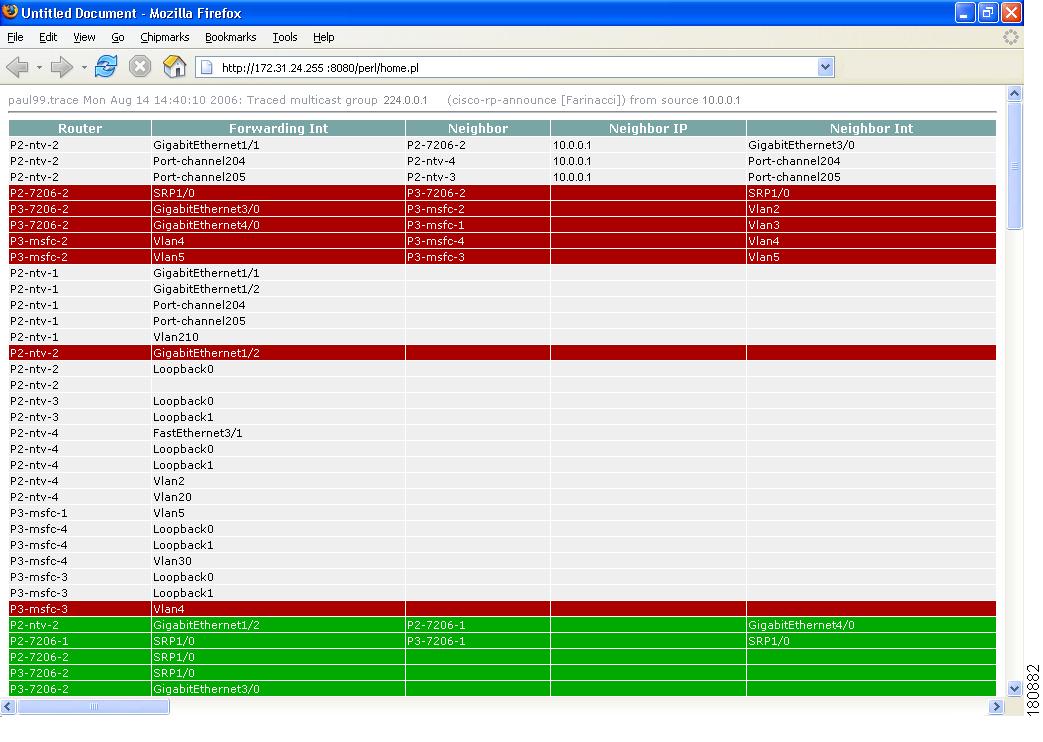
Clicking "trchanged" in the third column in the report will graphically show the baseline, along with the changed tree. Changes to the tree are highlighted in the table at the top as shown in the figure. The baseline and the current tree are also shown graphically.
Figure 1-40 Tree Report Page—Trchanged
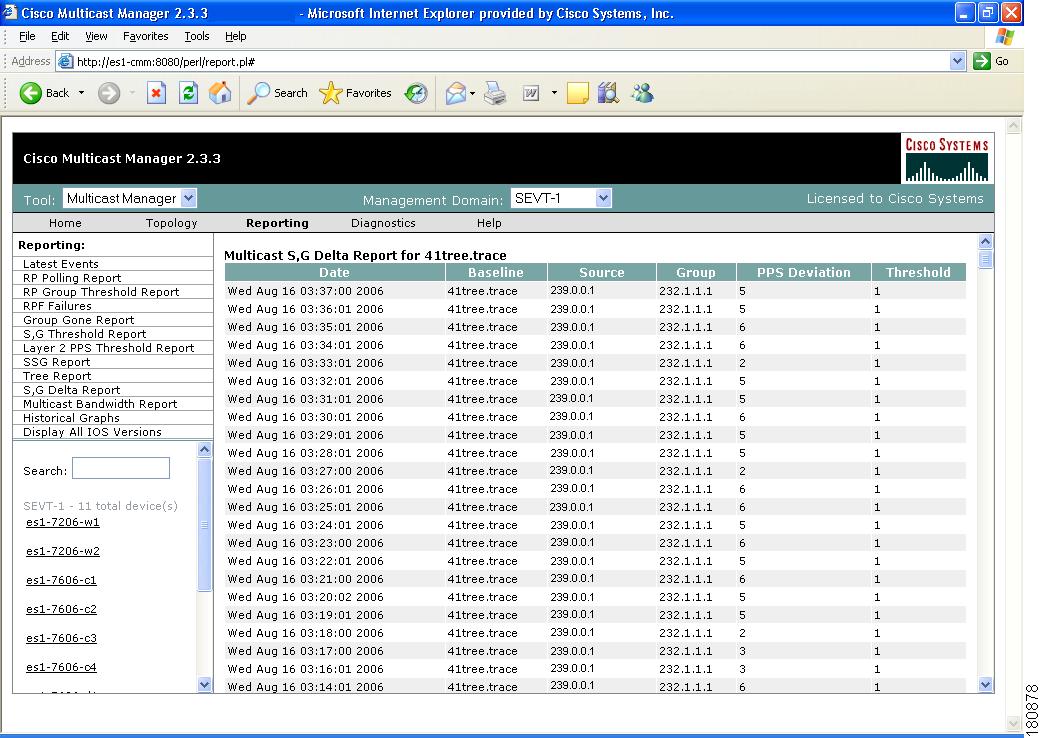
S,G Delta Report
Using the Multicast S,G Delta Report, you can view information about PPS rate deviation on multicast trees.
To generate a Multicast S,G Delta Report:
Step 1
Step 2
Step 3
Figure 1-41 Multicast S,G Delta Report
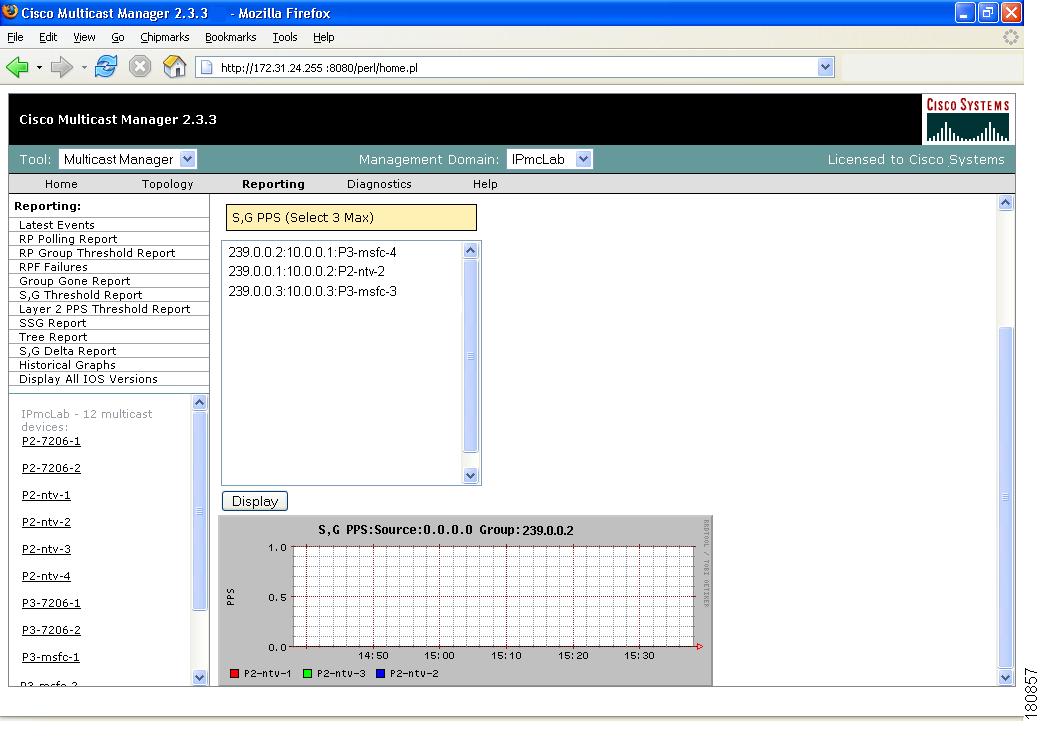
Historical Graphs
Using Historical Graphs, you can view historical data in a graph format. Historical data is collected when you start to monitor:
•
or
•
or
•
To view Historical Graphs:
Step 1
•
•
•
•
Step 2
•
•
•
•
•
Then select a Start and End range.
Step 3
Note
Figure 1-42 Historical Graphs
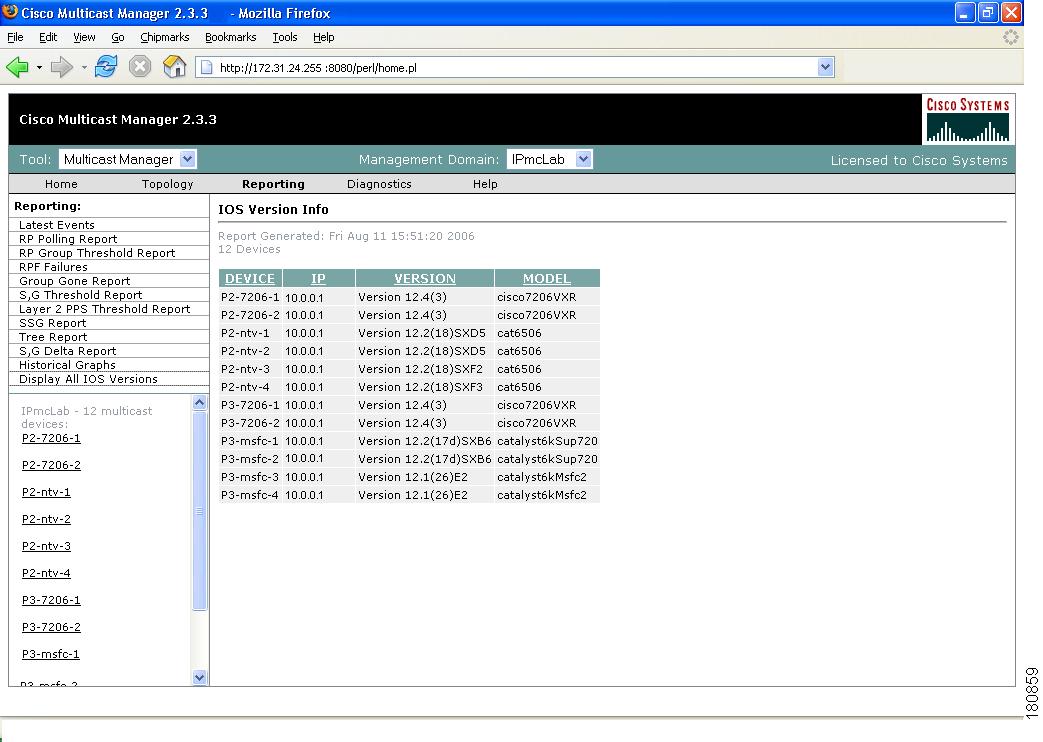
Display All IOS Versions
Using the IOS Version Info page, you can view the IOS version of all discovered routers in the current domain. You can sort the table by device, IP address, IOS version, or model by clicking on the corresponding column heading.
Figure 1-43 IOS Version Info
Diagnostics
The Diagnostics tool gives you a global view and a router-specific view of your network. The following sections describe global diagnostics:
The following section describes router-specific diagnostics:
Show All Groups
With the Show All Groups page, you can:
1.
2.
3.
4.
Figure 1-44 Multicast Diagnostics
(Optional) If you are using S,G caching, the cache contents appear. Click Refresh Cache to refresh the table of sources and groups.
If there are a lot of sources and groups present, you can filter the display to show only those you are interested in:
•
•
•
•
•
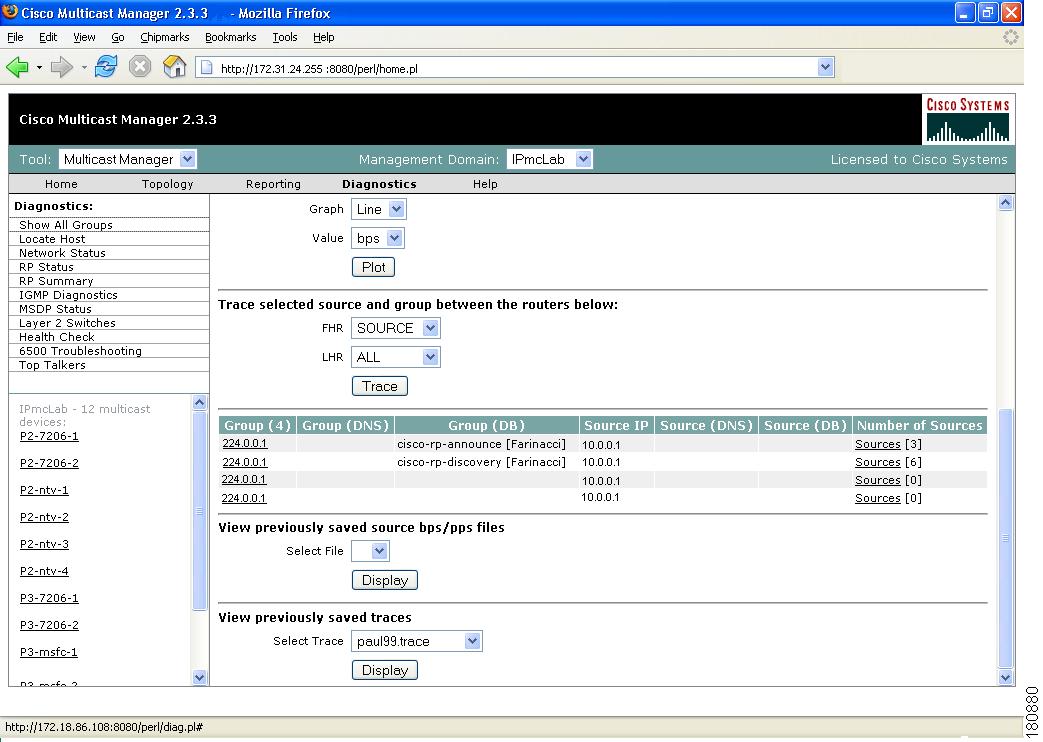
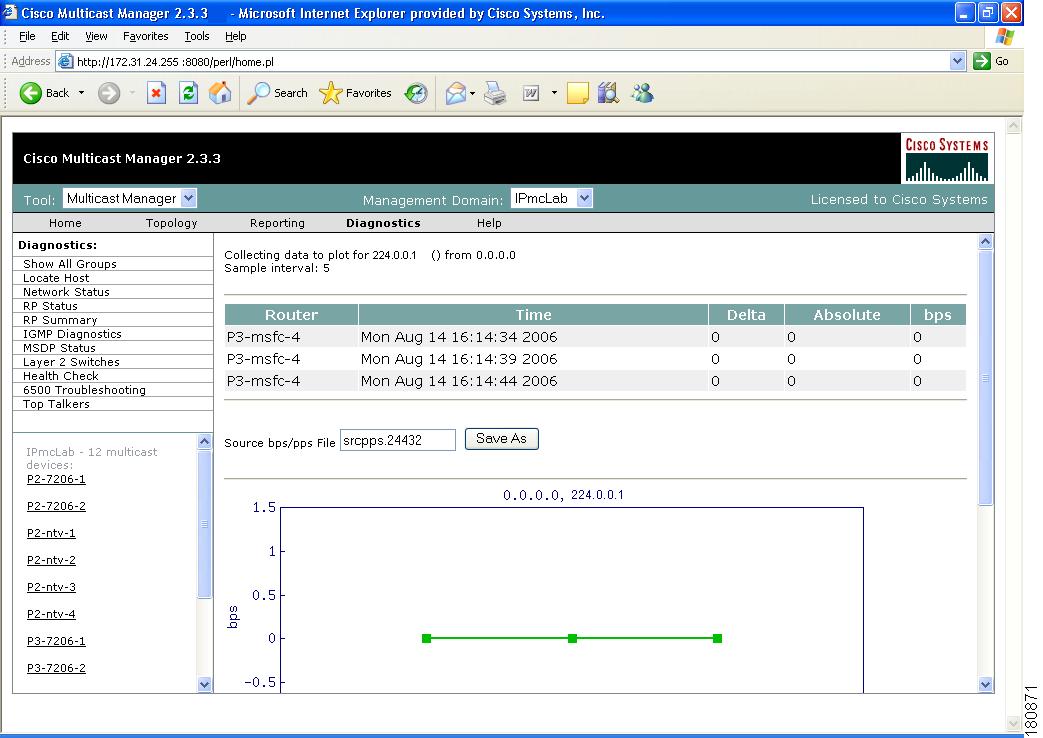
To ensure a source is sending data, you can plot traffic over a period of time:
•
•
Note
•
•
•
•
Note
Figure 1-45 Multicast Diagnostics—Plotting Traffic
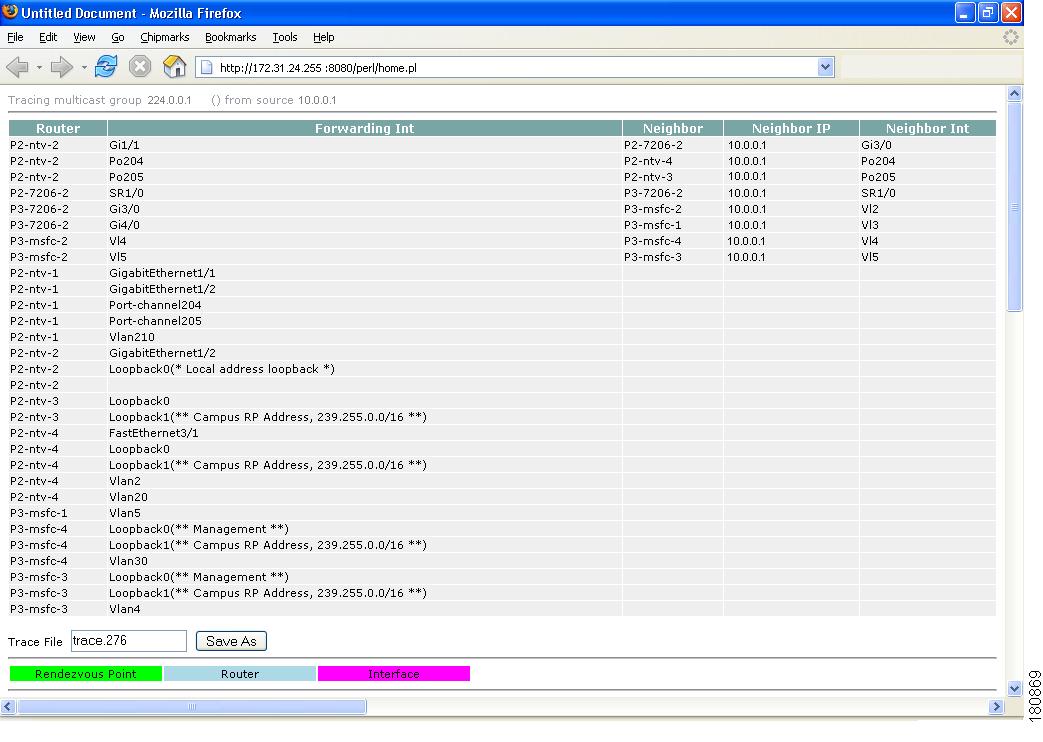
To draw a graphical tree between two particular routers:
•
•
•
View the list of active sources and groups:
•
Note
Figure 1-46 Drawing a Multicast Tree (Baseline)
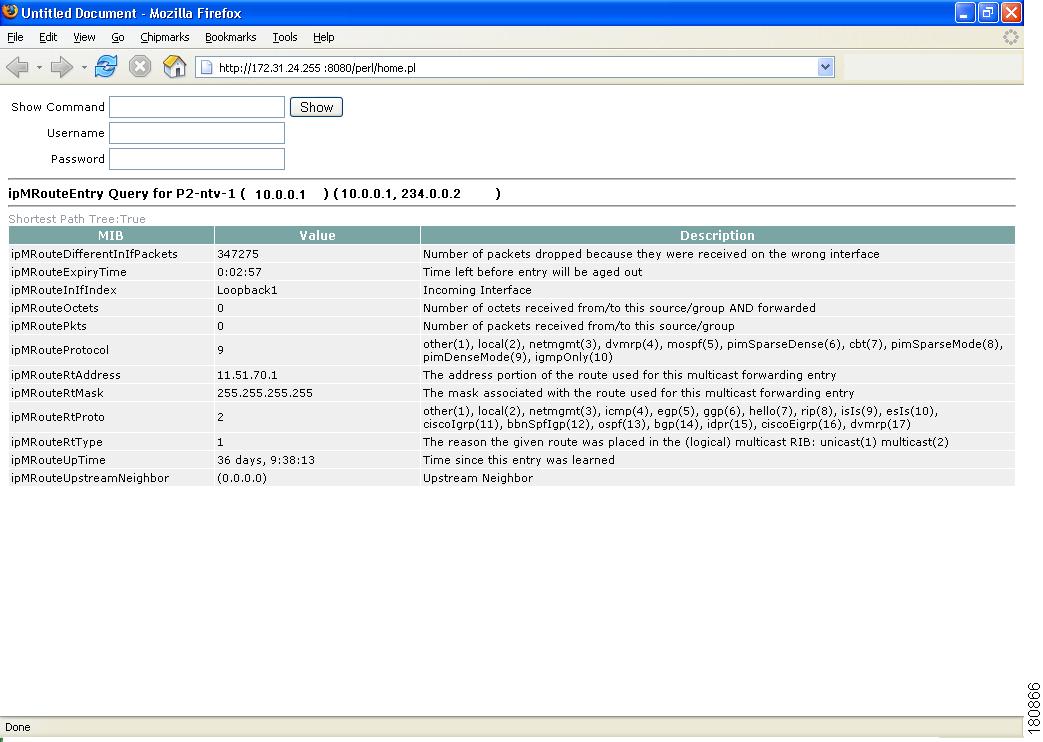
•
Note
Figure 1-47 Viewing IP Multicast Routing Information
•
–
–
–
–
–
–
Figure 1-48 Multicast Diagnostics
•
•
•
•
Note
•
•
•
•
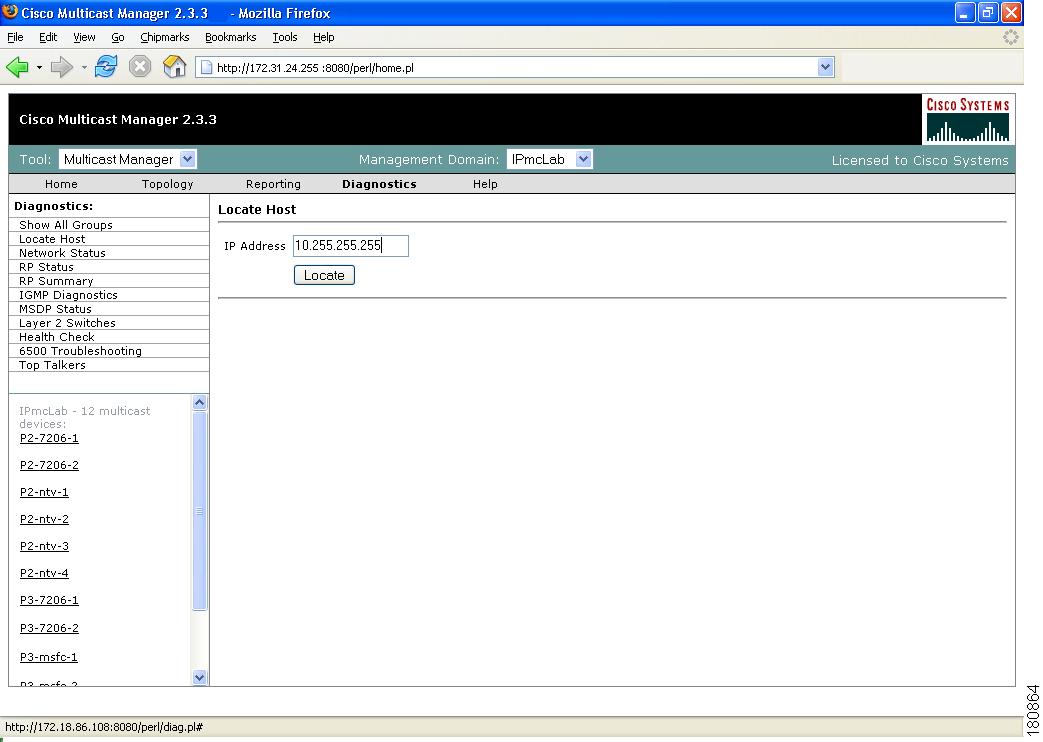
Locate Host
Using the Locate Host page, you can find sources and receivers in the network. Enter the IP Address or hostname (if DNS is configured) and click Locate.
Figure 1-49 Locate Host
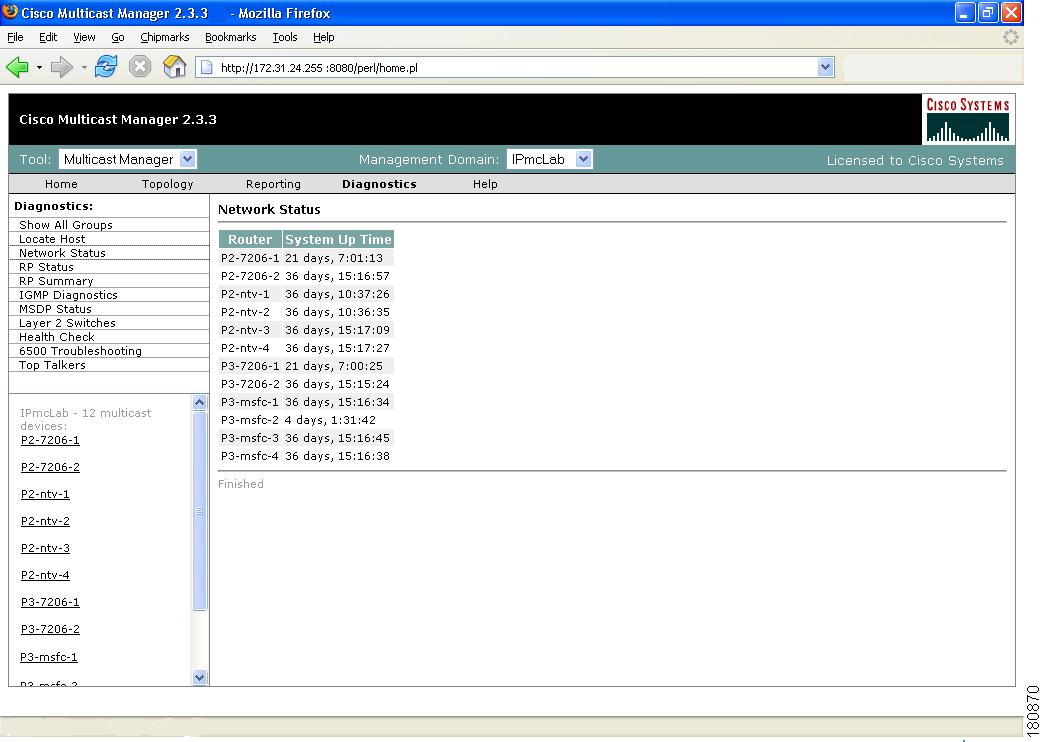
Network Status
Using the Network Status page, you can view the status of all devices in the current multicast domain. The System Up Time appears for all devices that are up. Devices that are down or unreachable appear in red.
Figure 1-50 Network Status
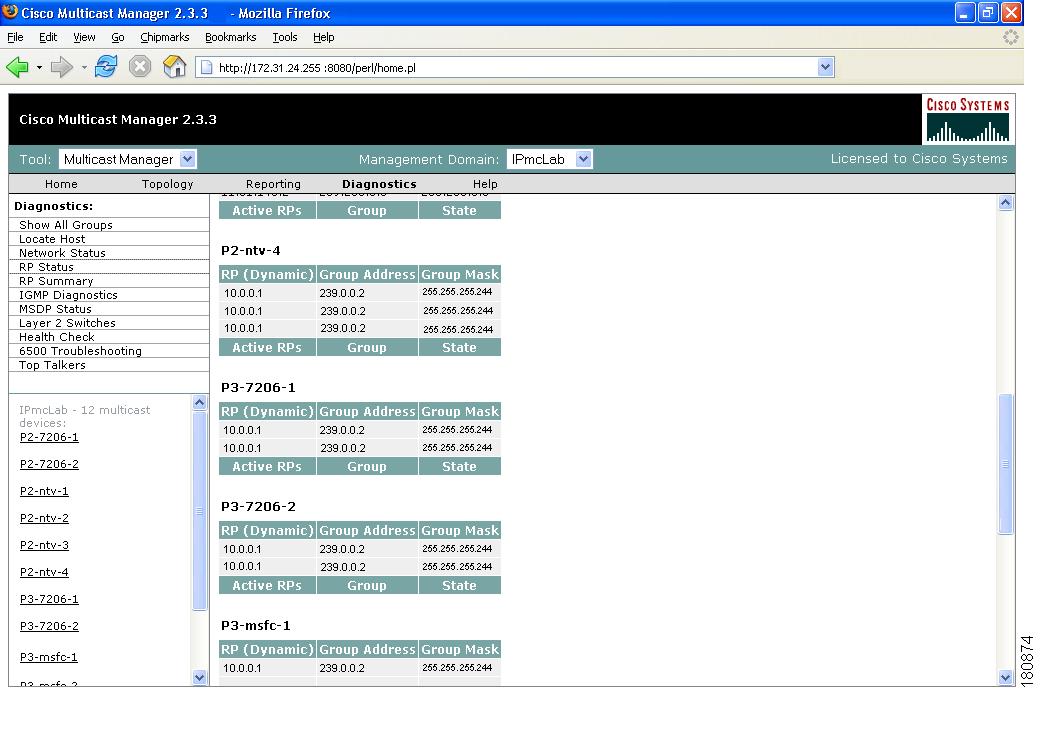
RP Status
Using the RP Status page, you can view all routers in the database, their RPs, and the active groups. In a large network with, many S,Gs, it may take some time for this data to appear, since each router in the multicast domain is queried.
Figure 1-51 RP Status
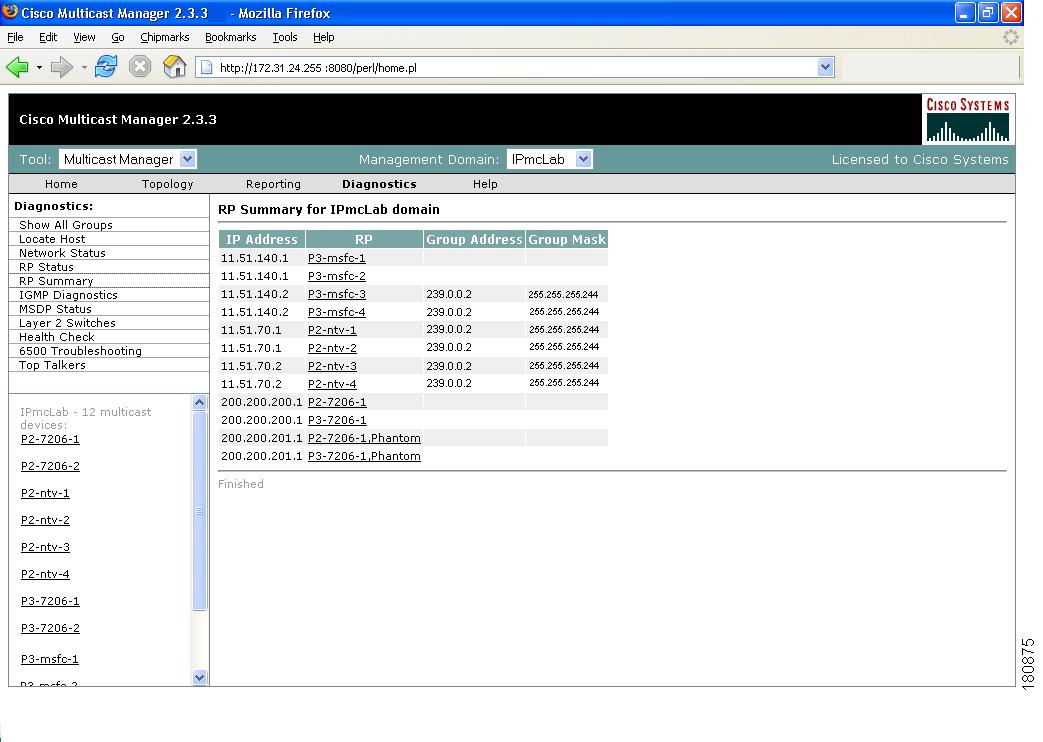
RP Summary
Using the RP Summary, you can view all the RPs that the CMM is aware of, based upon the discovery.
Figure 1-52 RP Summary
For details on clicking on an RP, see the "Topology" section.
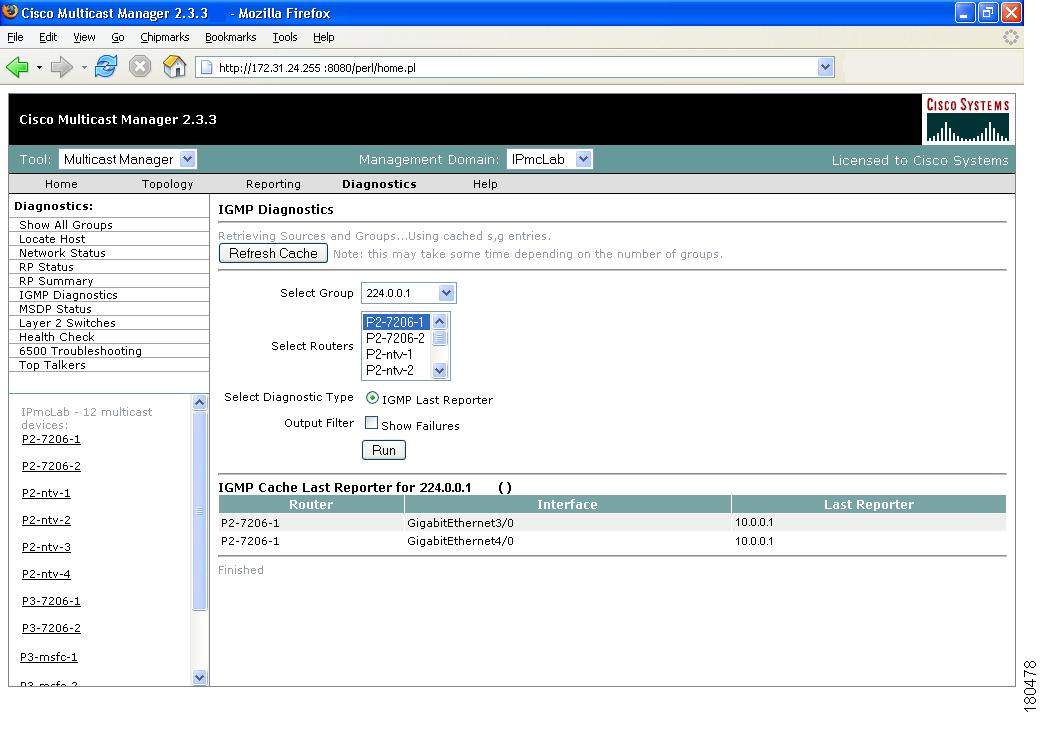
IGMP Diagnostics
Note
Using the IGMP Diagnostics page, you can see the interfaces that have joined onto a particular group:
Step 1
Step 2
Step 3
Step 4
Figure 1-53 IGMP Diagnostics
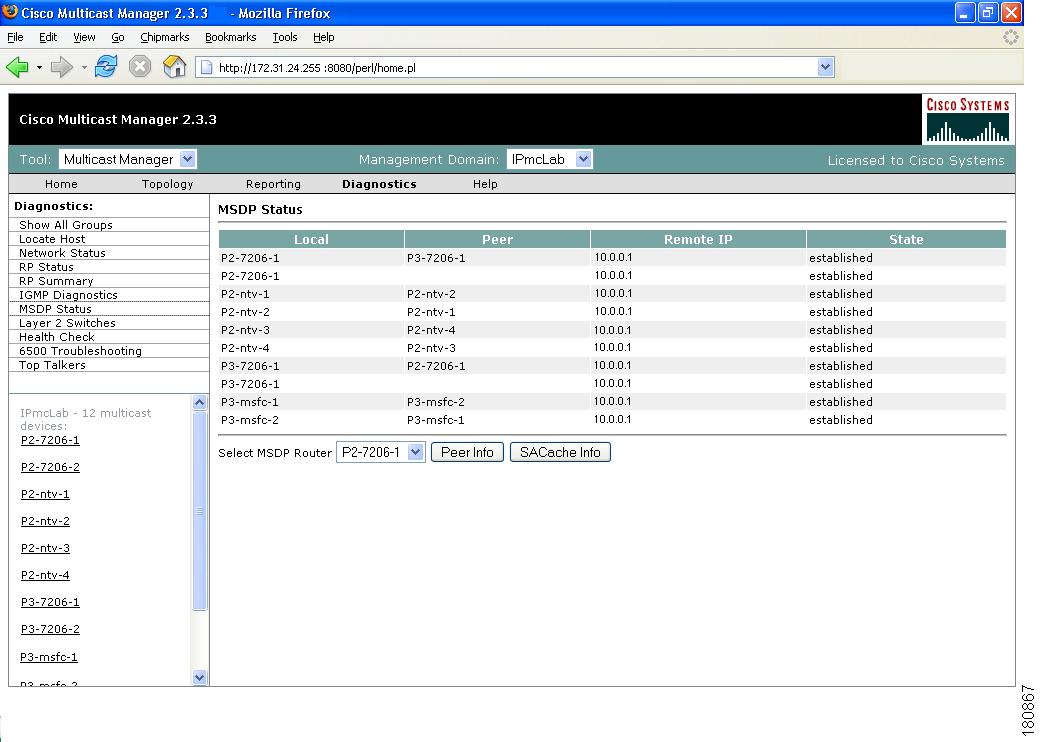
MSDP Status
Using the MSPD Status page, you can view all routers running MSDP and their peering connectivity. You can also view details for a specific router, such as peering information and the SA cache.
Note
To view peer information or SA cache information, select a router from the list and click the corresponding button.
Figure 1-54 MSDP Status
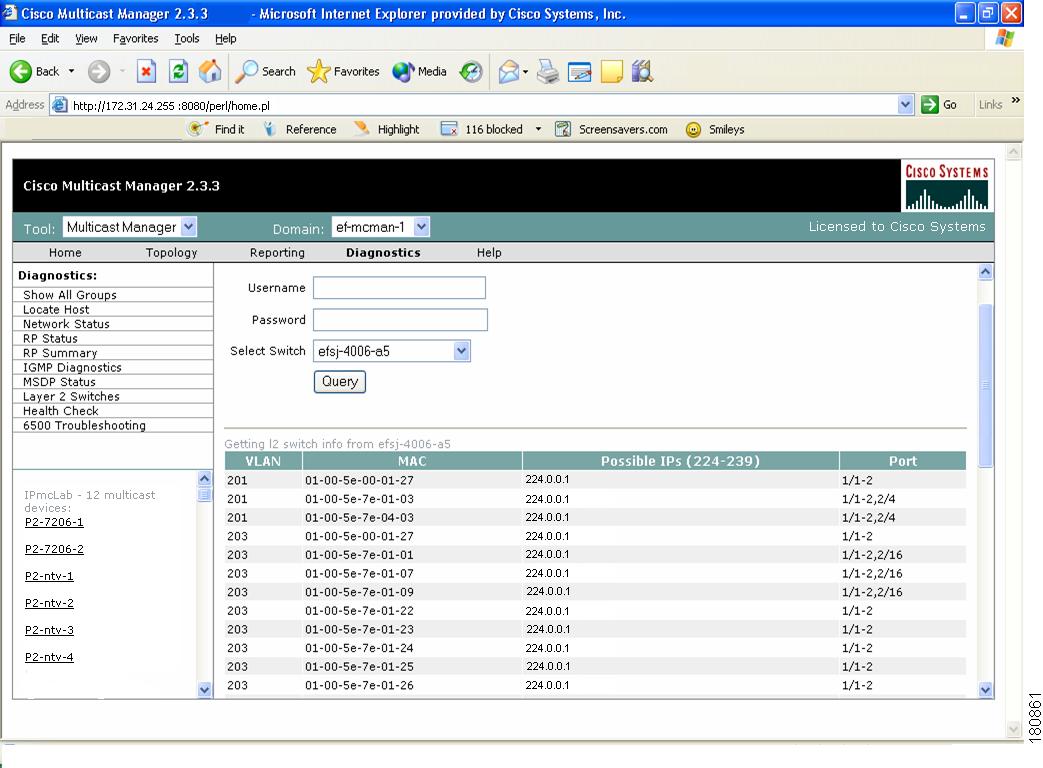
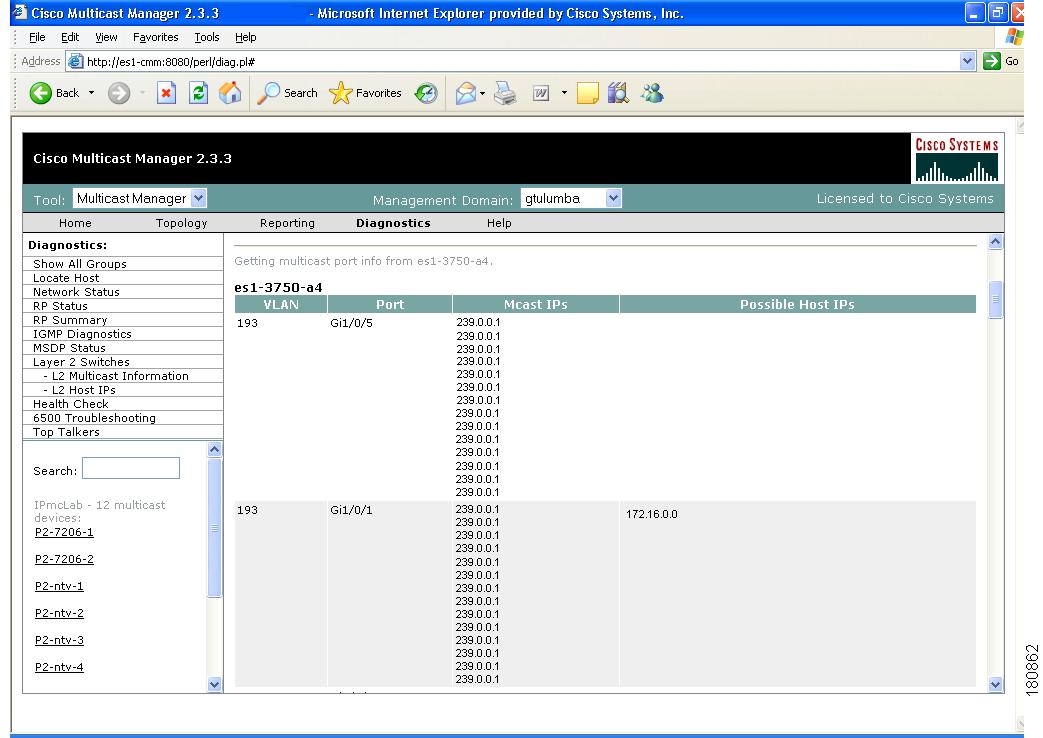
Layer 2 Switches
Using the Layer 2 Switches pages, you can view:
•
•
Note
To view Layer 2 multicast information or host IPs:
Step 1
Step 2
Step 3
Step 4
The possible IP addresses which can be mapped to the MAC address are also shown.
Figure 1-55 Layer 2 Multicast Information
Figure 1-56 Layer 2 Host IPs
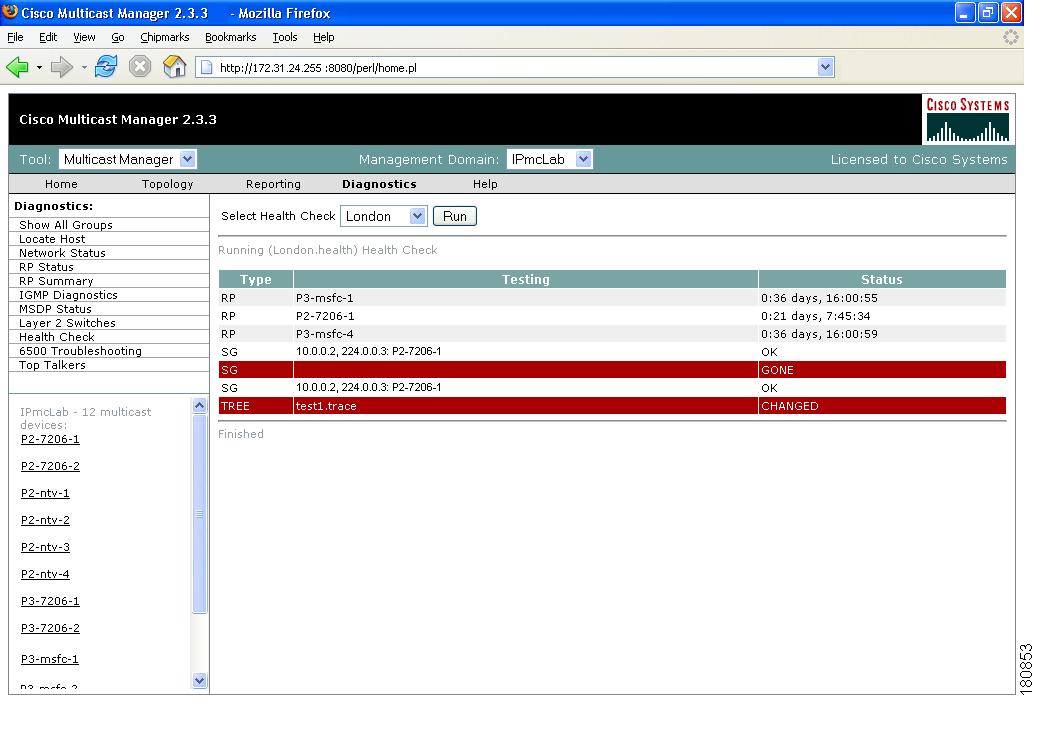
Health Check
Using the Health Check page, you can run a health check on a domain. To run a health check, select it from the drop-down box, and click Run.
Figure 1-57 Health Check
•
•
•
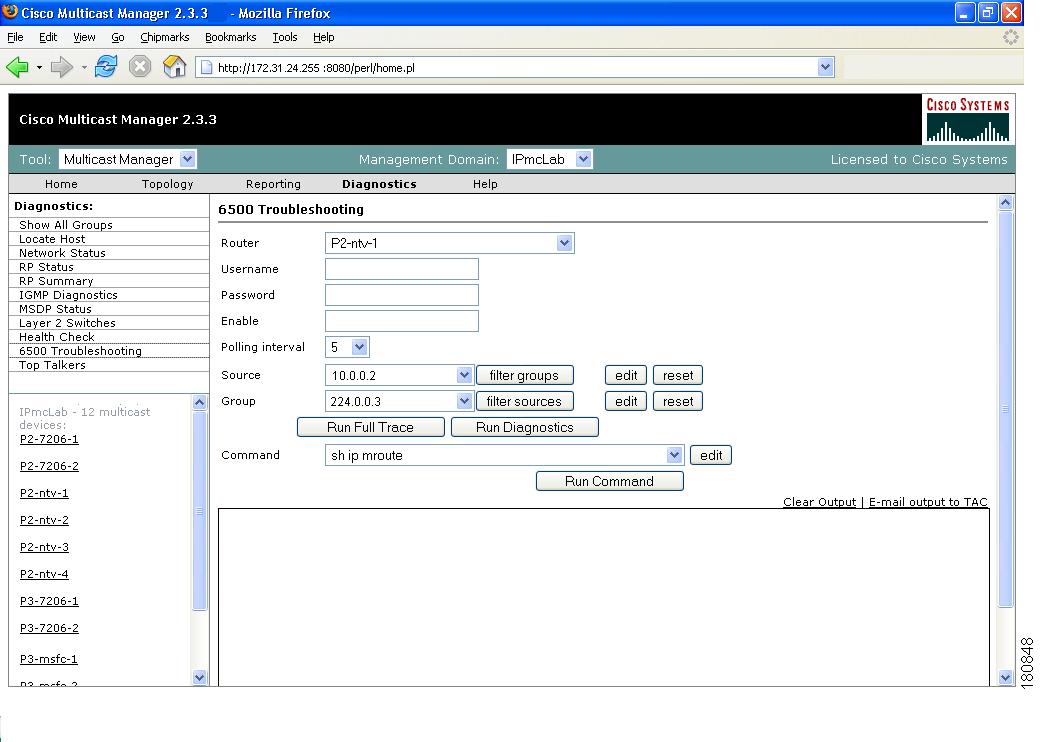
6500 Troubleshooting
Using the 6500 Troubleshooting page, you can enable the CMM to gather accurate packet forwarding statistics and other information in a timely manner. This option initiates a rlogin session into the PFC. A persistent telnet session issues show commands and displays live statistics. These sessions are terminated once the windows are closed.
Tip
Figure 1-58 6500 Troubleshooting
The 6500 Troubleshooting page contains:
Router
Select a 6500 or 7600 router.
Username
Enter your username.
Password
Enter the MSFC password.
Enable
Enter the enable password.
Polling Interval
Interval at which the statistics are updated.
Source
IP address of the source.
Group
IP address of the group.
Edit
Lets you manually type in a group or source address.
Reset
Re-populates the source and group lists.
Run Full Trace
Starts the tree at the source instead of the selected router. For details, see the "Show All Groups" section.
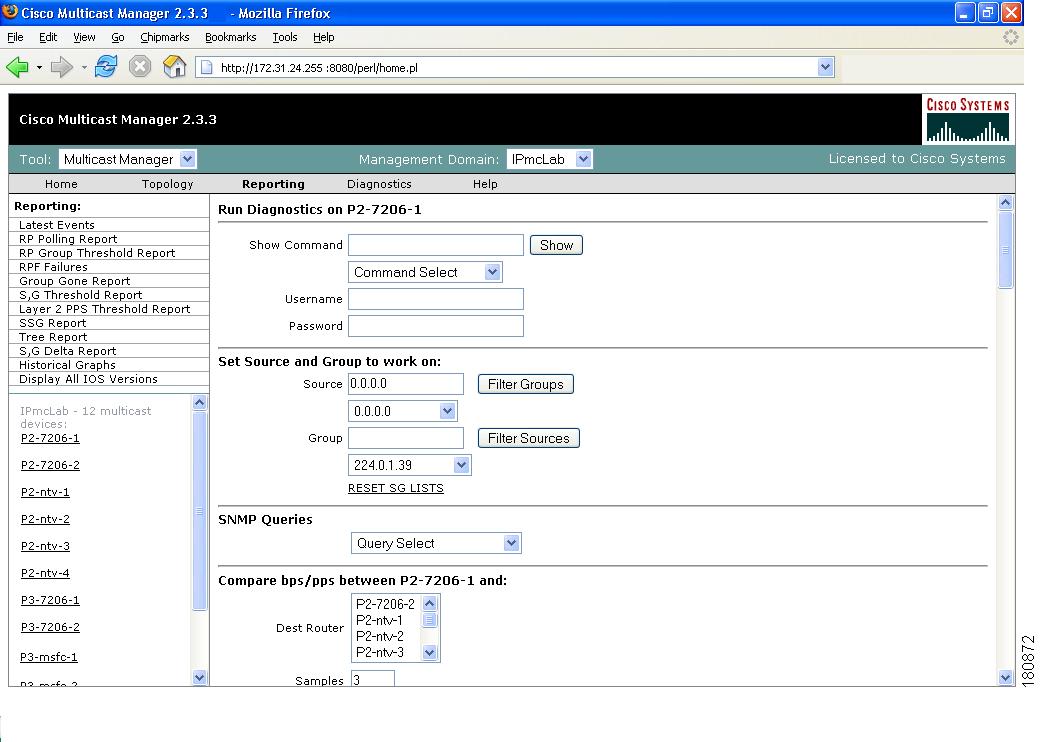
Run Diagnostics
Draws a graphical tree of the source and group selected, starting at the router selected. Live traffic statistics also appear for this source and group at this router. You can click on any other router in the picture to see live packets statistics for them (see the "Show All Groups" section).
Ensure pop-up blockers are disabled.
Command
Provides a drop-down list of show commands.
Edit
Add your own command by clicking on Edit, typing in your command, and click Run Command.
Run Command
Runs the selected show command. Output appears in the text box below.
Clear Output
Clears the output.
E-mail output to TAC
Emails the output to Cisco TAC.
Note
When troubleshooting a problem, you can keep a record of the command output:
Step 1
Step 2
Step 3
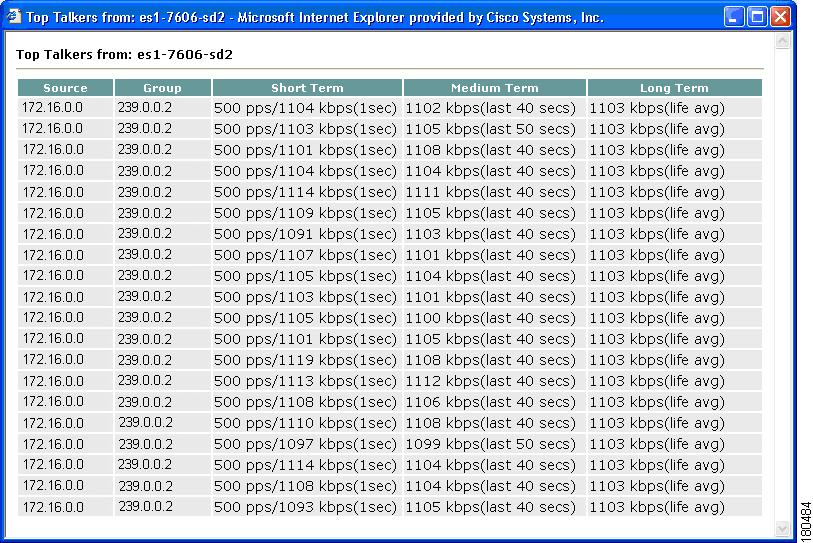
Top Talkers
Using the Top Talkers page, you can view the top 20 talkers, sorted by long term. The top 20 talkers are dynamically updated at every polling interval.
Step 1
Step 2
Step 3
Step 4
Figure 1-59 Top Talkers
Router Diagnostics
You can view specific multicast diagnostics on a router by clicking the router in the lower left pane.
Figure 1-60 Router Diagnostics
The Router Diagnostics page is similar to the Multicast Diagnostics page (under Show All Groups), except data is for the selected router only.
The following functions are not found on the Multicast Diagnostics page:
•
•
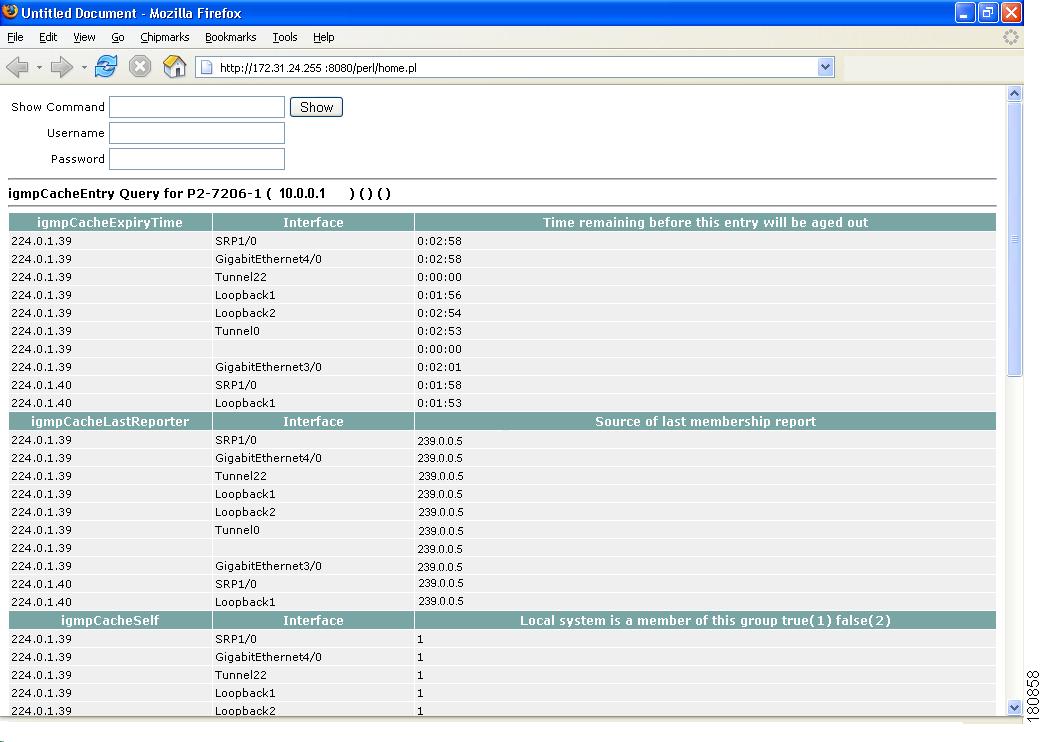
–
Figure 1-61 IGMP Cache Entries
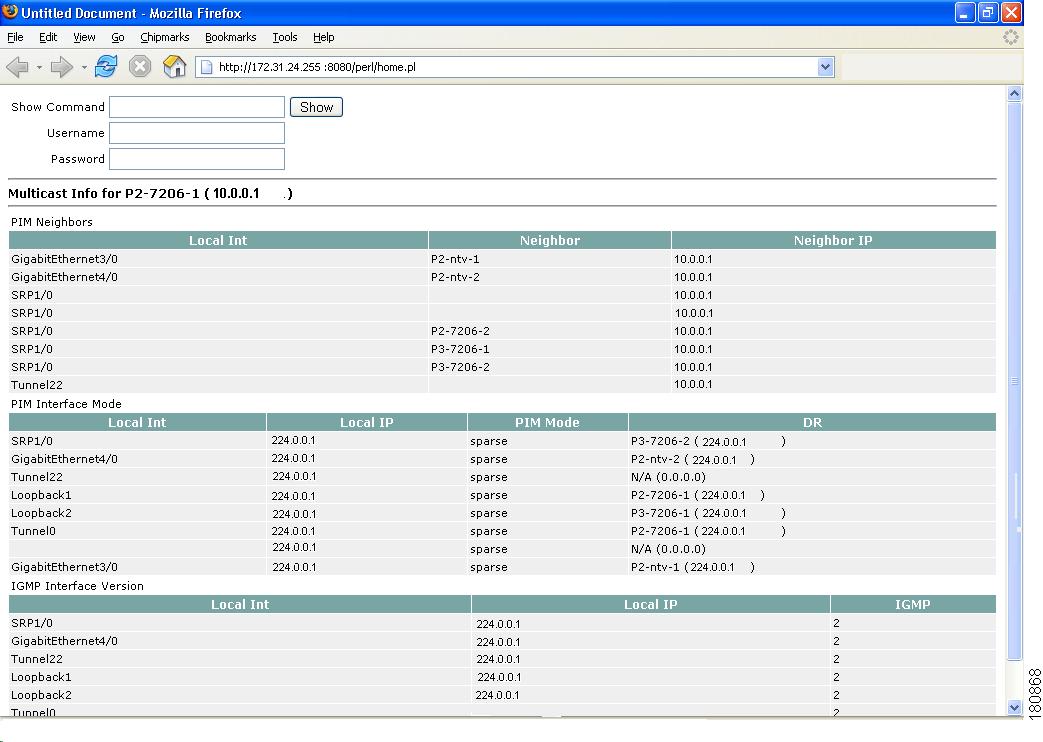
–
Figure 1-62 Multicast Information
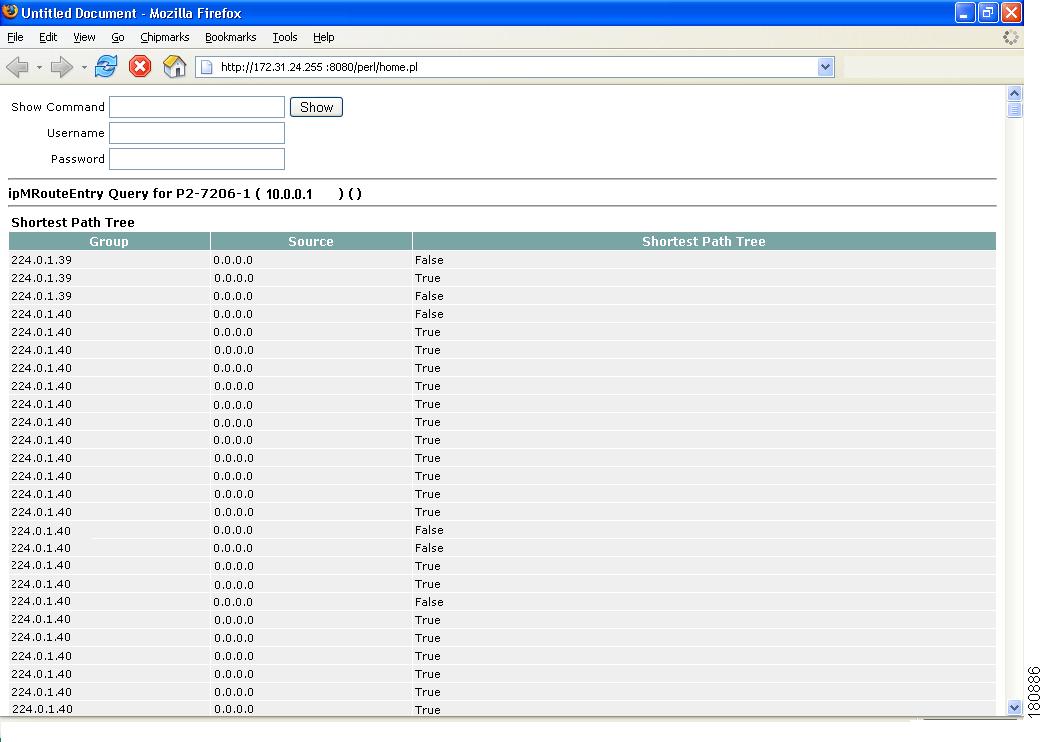
–
Figure 1-63 Multicast Routing Table
Help
You can view the Cisco Multicast Manager 2.3.3 User Guide PDF by clicking on Help.
Application Maintenance and Troubleshooting
This section contains information concerning the underlying operation of CMM and will be of most interest to the System Administrator that supports the application.
Configuration Files
Assuming the application is installed on Solaris, the directory location will be /opt/RMSMMT (on Linux it would be /usr/local/netman). Multicast domain configuration files are kept in /opt/RMSMMT/mmtsys/sys and named <domain>.mm.conf, where <domain> is the name of the multicast domain. The file is in the format of option=value. This file should not be edited manually. The polling daemon configuration files are also kept in this directory. The global polling configuration file is rmspoll.conf, and the domain specific files are rmspoll.<domain>.conf. Like the domain configuration files, these files should only be modified through the browser interface. The only time these files should be modified manually is with the assistance of RMS tech support.
Log Files
The /opt/RMSMMT/mmtsys/sys directory also contains two log files: events.log and rmspolld.log.events.log
The events.log file contains syslog type messages, shown below, that correspond to the SNMP traps sent by the polling daemon.
monlo:1082550198:172.16.1.9:1.3.6.1.2.1.31.1.1.1.2.10:0:10:631643:0:50
gone:1082550198:192.168.201.254:239.1.1.1:192.168.1.25:0:0:0:0
hi:1082550198:172.16.1.9:239.1.1.1:192.168.1.25:4116:92785:137:100
This file provides the information for the text-based reports provided by CMM. Depending on the polling interval, and number of objects being polled, this file may grow very quickly. It should be rotated along with all other syslog files on the server.
rmspolld.log
The rmspolld.log file contains log messages pertaining to the polling daemon.
04/23/2004 09:40:54 RMS Polling Agent v2.1(1) started successfully
04/23/2004 09:55:49 Exiting on SIGTERM
Apache Log Files
The Apache log files are located in /opt/RMSMMT/httpd_perl/logs. When troubleshooting the application, tailing the error_log file (tail -f error_log) will provide useful information. Additional application information can be logged to the error_log file by adding the line debug=1 to the <domain>.mm.conf file mentioned above.
Note
Databases
The database files used by CMM are located in /opt/RMSMMT/mmtsys/db. The topology database created by running discovery is <domain>.topo.db. The S,G cache, also created during discovery is <domain>.sg.db. The cache file is recreated when the polling daemon is running and polling the RPs. The lock files associated with each db file should never be manually removed. Removing these files could corrupt the databases.
Each domain also has a /opt/RMSMMT/mmtsys/db/<domain> directory associated with it. This directory contains the IOS versions (iosver.db) for the domain. Multicast forwarding tree baselines are also saved in this directory.
The IP address database (ipaddr.db) is also located in opt/RMSMMT/mmtsys/db.
Device Configurations
If TFTP is enabled on the server, and the SNMP read-write community string is supplied, then the application can download router configurations. The configurations are initially stored in the /tftpboot directory. If a configuration is saved from the "Display Router Config" screen, then a directory will be created (/opt/RMSMMT/configs/<device>) to hold the saved configurations.
Historical Data
PPS data collected by the polling daemon for S,G threshold polling and Layer 2 switch port polling, are stored in RRD files in /opt/RMSMMT/mmtsys/data.
Standard Multicast MIBs
Certain versions of IOS now support the standard based IPMROUTE and IGMP MIBs. The STDMIBS file in the /opt/RMSMMT/mmtsys/db controls which IOS versions the standard MIBs will be used for. The file currently contains the following entries:
# This file contains versions of IOS that use the standard multicast MIBs.12.3.*.*12.2.*.T*12.2.*.BC*Backups
To backup application specific data, the following directories should be included in any system backups:
/opt/RMSMMT/mmtsys/data/opt/RMSMMT/mmtsys/db/opt/RMSMMT/mmtsys/sys/opt/RMSMMT/configsPrior to performing backups, the /opt/RMSMMT/K98mmt script should be run to ensure that files are being changed while the backup is being performed.
Note