Feedback
Table Of Contents
Configuring Cisco Performance Monitor
Information About Cisco Performance Monitor
Overview of Cisco Performance Monitor
Prerequisites for Configuring Cisco Performance Monitor
Configuration Components of Cisco Performance Monitor
Data That You Can Monitor Using Cisco Performance Monitor
SNMP MIB Support for Cisco Performance Monitor
How to Configure, Troubleshoot, and Maintain Cisco Performance Monitor
Configuring a Flow Exporter for Cisco Performance Monitor
Configuring a Flow Record for Cisco Performance Monitor
Configuring a Flow Monitor for Cisco Performance Monitor
Configuring a Flow Class for Cisco Performance Monitor
Configuring a Flow Policy for Cisco Performance Monitor Using an Existing Flow Monitor
Configuring a Flow Policy for Cisco Performance Monitor Without Using an Existing Flow Monitor
Applying a Cisco Performance Monitor Policy to an Interface Using an Existing Flow Policy
Applying a Cisco Performance Monitor Policy to an Interface Without Using an Existing Flow Policy
Verifying That Cisco Performance Monitor Is Collecting Data
Displaying the Peformacne Monitor Cache and Clients
Displaying the Clock Rate for Cisco Performance Monitor Classes
Displaying the Current Status of a Flow Monitor
Verifying the Flow Monitor Configuration
Verifying That Cisco IOS Flexible NetFlow and Cisco Performance Monitor Is Enabled on an Interface
Displaying the Flow Monitor Cache
Displaying the Current Status of a Flow Exporter
Verifying the Flow Exporter Configuration
Configuration Example For Cisco Performacne Monitor
Example: Monitor for Lost RTP Packets and RTP Jitter
Feature Information for Cisco Performance Monitor
Configuring Cisco Performance Monitor
First Published: November 17, 2010Last Updated: June 16, 2011This document contains information about and instructions for configuring Cisco Performance Monitor.
Finding Feature Information
Your software release may not support all the features documented in this module. For the latest feature information and caveats, see the release notes for your platform and software release. To find information about the features documented in this module, and to see a list of the releases in which each feature is supported, see the "Feature Information for Cisco Performance Monitor" section.
Use Cisco Feature Navigator to find information about platform support and Cisco softwareimage support. To access Cisco Feature Navigator, go to http://www.cisco.com/go/cfn. An account on Cisco.com is not required.
Contents
•
Information About Cisco Performance Monitor
•
•
•
Information About Cisco Performance Monitor
•
•
•
•
•
Overview of Cisco Performance Monitor
Cisco Performance Monitor enables you to monitor the flow of packets in your network and become aware of any issues that might impact the flow before it starts to significantly impact the performance of the application in question. Performance monitoring is especially important for video traffic because high quality interactive video traffic is highly sensitive to network issues. Even minor issues that may not affect other applications can have dramatic effects on video quality.
Because Cisco Performance Monitor uses similar software components and commands as Cisco NetFlow and Cisco Flexible NetFlow, familiarity with these products will help you to understand how to configure Cisco Performance Monitor. These products provide statistics on packets flowing through a router and are the standard for acquiring IP operational data from IP networks. They provide data to support network and security monitoring, network planning, traffic analysis, and IP accounting. For more information about Cisco NetFlow and Cisco Flexible NetFlow, see the documents listed in the "Related Documents" section.
Prerequisites for Configuring Cisco Performance Monitor
The following prerequisites must be met before you can configure Cisco Performance Monitor:
•
•
IPv4 Traffic
•
•
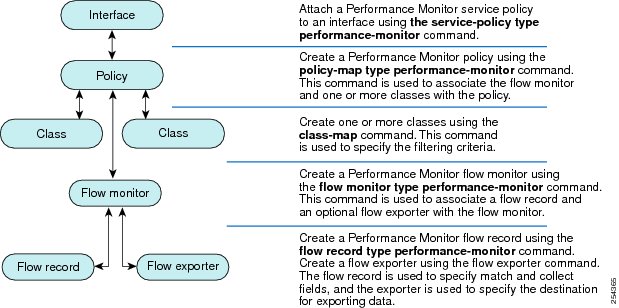
Configuration Components of Cisco Performance Monitor
To configure Cisco Performance Monitor, configure many of the same basic elements that you normally configure for Flexible NetFlow:
•
•
•
•
•
•
Figure 1 shows how these elements are related to each other. The elements at the bottom of the figure are configured first.
Figure 1
Cisco Performance Monitor Components
As shown above, a policy includes one or more classes. Each class has a flow monitor associated with it, and each flow monitor has a flow record and an optional flow exporter associated with it. These elements are configured in the following order:
1.
2.
3.
4.
5.
Data That You Can Monitor Using Cisco Performance Monitor
You can monitor the following information by configuring a flow record with collect or match commands for the corresponding non-key fields:
Tip
•
•
•
•
•
•
•
•
•
•
•
•
•
•
•
•
•
•
•
•
•
•
•
•
•
•
•
•
•
•
•
•
•
•
SNMP MIB Support for Cisco Performance Monitor
Cisco Performance Monitor provides support for the use of the industry-standard Simple Network Management Protocol (SNMP) to monitor media streams. This support is implemented with the addition of the following Cisco proprietary SNMP Management Information Base (MIB) modules:
•
•
•
•
For detailed information about these MIBs, and to locate and download MIBs for selected platforms, Cisco IOS releases, and feature sets, use Cisco MIB Locator found at http://www.cisco.com/go/mibs.
This feature also includes two new command-line interface (CLI) commands and one modified CLI command. The commands are as follows:
•
•
•
For more information about these commands, see the Cisco IOS Master Command List.
How to Configure, Troubleshoot, and Maintain Cisco Performance Monitor
To configure Cisco Performance Monitor using either predefined record format or your own record format, perform the following tasks:
•
•
•
•
•
•
•
•
To troubleshoot and maintain Cisco Performance Monitor using, perform the following tasks:
•
•
•
•
•
•
•
•
•
•
Note
Configuring a Flow Exporter for Cisco Performance Monitor
Flow exporters are used to send the data that you collect with Cisco Performance Monitor to a remote system such as a NetFlow Collection Engine. Flow exporters use user datagram protocol (UDP) as the transport protocol and use the Version 9 export format.
To configure a flow exporter for the flow monitor, in order to export the data that is collected by Cisco Performance Monitor to a remote system for further analysis and storage, perform the following optional task. For Cisco Performance Monitor, flow exporters are configured the same way as they are configured for Cisco IOS Flexible NetFlow. For more information. see Configuring Data Export for Cisco IOS Flexible NetFlow with Flow Exporters.
Restrictions
Each flow exporter supports only one destination. If you want to export the data to multiple destinations, you must configure multiple flow exporters and assign them to the flow monitor.
SUMMARY STEPS
1.
2.
3.
4.
5.
6.
7.
8.
9.
10.
11.
12.
13.
14.
DETAILED STEPS
Troubleshooting Tips
To check the configuration and status of your flow exporter, use the show flow exporter command.
For more information about this command, see the "Troubleshooting and Maintaining Cisco Performance Monitor" section on page 32.
Configuring a Flow Record for Cisco Performance Monitor
The basic concepts and techniques for configuring a flow record for Cisco Performance Monitor are the same as flow records for Flexible NetFlow. The flow record specifies how the data collected data is aggregated and presented. The only significant difference is that, for Cisco Performance Monitor, the command includes type performance-monitor.
SUMMARY STEPS
1.
2.
3.
4.
5.
6.
7.
8.
9.
10.
11.
12.
13.
14.
15.
DETAILED STEPS
Troubleshooting Tips
To check the configuration and status of your flow record, use the show flow record type performance-monitor command.
For more information about this command, see the "Troubleshooting and Maintaining Cisco Performance Monitor" section on page 32.
Configuring a Flow Monitor for Cisco Performance Monitor
The basic concepts for configuring a flow monitor for Cisco Performance Monitor are the same as flow monitors for Flexible NetFlow. Each flow monitor has a separate cache assigned to it and requires a record to define the contents and layout of its cache entries.
When you configure a flow monitor, you must use either:
•
•
–
–
Restrictions
To modify a flow record, you must remove it from all flow monitors it is associated with.
SUMMARY STEPS
1.
2.
3.
4.
5.
6.
7.
DETAILED STEPS
Troubleshooting Tips
To check the configuration and status of your flow monitor, use the show flow monitor type performance-monitor command and the show running-config flow monitor command.
For more information about these commands, see the "Troubleshooting and Maintaining Cisco Performance Monitor" section on page 32.
Configuring a Flow Class for Cisco Performance Monitor
The basic concepts and techniques for configuring a class for Cisco Performance Monitor are the same as for any other type of class. The class specifies the filter that determines which flow traffic to monitor. The filter is configured using various match commands in class-map mode.
If you do not already have a flow monitor configured, you can either:
•
•
Note
SUMMARY STEPS
1.
2.
3.
4.
5.
6.
7.
DETAILED STEPS
Step 1
enable
Example:Router> enable
Enables privileged EXEC mode.
•
Step 2
configure terminal
Example:Router# configure terminal
Enters global configuration mode.
Step 3
class-map class-name
Example:Router(config)# class-map class-4
Specifies a class to include in the policy. Repeat this command for each class that you want to include in the policy.
Step 4
description description
Example:Router(config-cmap)# description match any packets
(Optional) Creates a description for the flow class.
Step 5
match {access-group {access-group | name access-group-name} | any | cos cos-value | destination-address mac address | discard-class class-number | dscp dscp-value | flow {direction | sampler} | fr-de | fr-dlci dlci-number | input-interface interface-name | ip {rtp starting-port-number port-range | precedence | dscp} | mpls experimental topmost number | not match-criterion | packet length {max maximum-length-value [min minimum-length-value] | min minimum-length-value [max maximum-length-value]} | precedence {precedence-criteria1 | precedence-criteria2 | precedence-criteria3 | precedence-criteria4} | protocol protocol-name | qos-group qos-group-value | source-address mac address-destination | vlan {vlan-id | vlan-range | vlan-combination}}
Example:Router(config-cmap)# match any
Specifies the classification criteria.
For more information and examples, see the Cisco Media Monitoring Command Reference.
Step 6
rename class-name
Example:Router(config-cmap)# rename class-4
Specifies a new name for the flow class.
Step 7
end
Example:Router(config-cmap)# end
Exits the current configuration mode and returns to privileged EXEC mode.
Troubleshooting Tips
To check the configuration and status of your flow class, use the show policy-map type performance-monitor or show class-mpacommand.
For more information about this command, see the "Troubleshooting and Maintaining Cisco Performance Monitor" section on page 32.
Configuring a Flow Policy for Cisco Performance Monitor Using an Existing Flow Monitor
The basic concepts and techniques for configuring a class for Cisco Performance Monitor are the same as for any other type of class. The class specifies which flow monitor is included. The only significant difference is that, for Cisco Performance Monitor, the policy-map command includes type performance-monitor.
If you do not already have a flow monitor configured or do not want to use any of your existing flow monitors for a new class, you can configure it using the flow monitor inline option and specifying which flow record and flow exporter are included.
SUMMARY STEPS
1.
2.
3.
4.
5.
6.
7.
8.
9.
10.
11.
12.
13.
14.
15.
16.
17.
18.
19.
20.
21.
22.
23.
24.
25.
26.
27.
28.
DETAILED STEPS
Step 1
enable
Example:Router> enable
Enables privileged EXEC mode.
•
Step 2
configure terminal
Example:Router# configure terminal
Enters global configuration mode.
Step 3
policy-map type performance-monitor policy-name
Example:Router(config)# policy-map type preformance-monitor FLOW-MONITOR-4
Creates a policy and enters policy configuration mode.
•
Step 4
class {class-name | class-default}
Example:Router(config-pmap)# class class-4
Specifies a class to include in the policy. Repeat this command for each class that you want to include in the policy.
Step 5
flow monitor monitor-name
Example:Router(config-pmap-c)# flow monitor FLOW-MONITOR-4
Enters flow monitor configuration mode. If you do not want to use an existing flow monitor, you can use the inline option to configure a new one, as described in the "Configuring a Flow Policy for Cisco Performance Monitor Without Using an Existing Flow Monitor" section.
Step 6
monitor metric ip-cbr
Example:Router(config-pmap-c)# monitor metric ip-cbr
(Optional) Enters IP-CBR monitor metric configuration mode.
Step 7
rate layer3 {byte-rate {bps | kbps | mbps | gbps} | packet}
Example:Router(config-pmap-c-mipcbr)# rate layer3 248 mbps
(Optional) Specifies the rate for monitoring the metrics.
•
•
Step 8
exit
Example:Router(config-pmap-c-mipcbr)# exit
Returns to policy class configuration mode.
Step 9
monitor metric rtp
Example:Router(config-pmap-c)# monitor metric rtp
Enters RTP monitor metric configuration mode.
Step 10
clock-rate {type-number | type-name | default} rate
Example:Router(config-pmap-c-mrtp)# clock-rate 8 9600
Specifies the clock rate used to sample RTP video-monitoring metrics.
For more information about the clock-type numbers and names, see the Cisco Media Monitoring Command Reference.
The range for rate is 1 kHz to 192 kHz.
Step 11
max-dropout number
Example:Router(config-pmap-c-mrtp)# max-dropout 2
Specifies the maximum number of dropouts allowed when sampling RTP video-monitoring metrics.
Step 12
max-reorder number
Example:Router(config-pmap-c-mrtp)# max-reorder 4
Specifies the maximum number of reorders allowed when sampling RTP video-monitoring metrics.
Step 13
min-sequential number
Example:Router(config-pmap-c-mrtp)# min-sequential 2
Specifies the minimum number of sequental packets required to identify a stream as being an RTP flow.
Step 14
ssrc maximum number
Example:Router(config-pmap-c-mrtp)# ssrc maximum 20
Specifies the maximum number of SSRCs that can be monitored within the same flow. A flow is defined by the protocol, source/destination address, and source/destination port).
Step 15
exit
Example:Router(config-pmap-c-mrtp)# exit
Returns to policy class configuration mode.
Step 16
monitor parameters
Example:Router(config-pmap-c)# monitor parameters
Enters monitor parameters configuration mode.
Step 17
flows number
Example:Router(config-pmap-c-mparam)# flows 40
Specifies the maximum number of flows for each monitor cache.
Step 18
interval duration number
Example:Router(config-pmap-c-mparam)# interval duration 40
Specifies the interval, in seconds, between samples taken of video-monitoring metrics.
Step 19
history number
Example:Router(config-pmap-c-mparam)# history 4
Specifies the number of historical buckets of collected video-monitoring metrics.
Step 20
timeout number
Example:Router(config-pmap-c-mparam)# timeout 20
Specifies the number of intervals before a stopped flow is removed from the database.
Step 21
exit
Example:Router(config-pmap-c-mparam)# exit
Returns to policy class configuration mode.
Step 22
react ID {media-stop | mrv | rtp-jitter-average | transport-packets-lost-rate}
Example:Router(config-pmap-c)# react 41 rtp-jitter-average
Enters a mode where you can specify what reaction occurs when a threshold is violated for the following metrics:
•
•
•
•
•
Step 23
action {snmp | syslog}
Example:Router(config-pmap-c-react)# action syslog
Specifies how violations of the thresholds with be reported.
Step 24
alarm severity {alert | critical | emergency | error | info}
Example:Router(config-pmap-c-react)# alarm severity critical
Specifies which level of alarm will be reported.The default setting is info.
Step 25
alarm type {discrete | grouped {count number | percent number}
Example:Router(config-pmap-c-react)# alarm type discrete
Specifies which types of levels are considered alarms that require reporting. The default setting is discrete.
Step 26
threshold value {ge number | gt number | le number | lt number | range rng-start rng-end}
Example:Router(config-pmap-c-react)# threshold value ge 20
Specifies which types of levels values are considered alarms that require reporting.
Step 27
description description
Example:Router(config-cmap-c-react)# description rtp-jitter-average above 40
(Optional) Creates a description for the reaction.
Step 28
end
Example:Router(config-pmap-c-react)# end
Exits the current configuration mode and returns to privileged EXEC mode.
Troubleshooting Tips
To check the configuration and status of your flow policy, use the show policy-map type performance-monitor command.
For more information about this command, see the "Troubleshooting and Maintaining Cisco Performance Monitor" section on page 32.
Configuring a Flow Policy for Cisco Performance Monitor Without Using an Existing Flow Monitor
The basic concepts and techniques for configuring a class for Cisco Performance Monitor are the same as for any other type of class. The class specifies which flow monitor is included. The only significant difference is that, for Cisco Performance Monitor, the policy-map command includes type performance-monitor.
If you do not already have a flow monitor configured or do not want to use any of your existing flow monitors for a new class, you can configure it under the class configuration mode, by specifying which flow record and flow exporter are included.
SUMMARY STEPS
1.
2.
3.
4.
5.
6.
7.
8.
9.
10.
11.
12.
13.
14.
15.
16.
17.
18.
19.
20.
21.
22.
23.
24.
25.
26.
27.
28.
29.
30.
DETAILED STEPS
Step 1
enable
Example:Router> enable
Enables privileged EXEC mode.
•
Step 2
configure terminal
Example:Router# configure terminal
Enters global configuration mode.
Step 3
policy-map type performance-monitor policy-name class class-name
Example:Router(config)# policy-map type preformance-monitor FLOW-MONITOR-4
Creates a policy and enters policy configuration mode.
•
Step 4
class {class-name | class-default}
Example:Router(config-pmap)# class class-4
Specifies a class to include in the policy. Repeat this command for each class that you want to include in the policy.
Step 5
flow monitor inline
Example:Router(config-pmap-c)# flow monitor inline
Enters inline mode and enables you to configure a new flow monitor.
Step 6
record {record-name | default-rtp | default-tcp}
Example:Router(config-pmap-c-flowmon)# record default-tcp
Specifies a flow record to associate with the flow monitor.
Step 7
exporter exporter-name
Example:Router(config-pmap-c-flowmon)# exporter exporter-4
Specifies a flow record to associate with the flow exporter.
Step 8
exit
Example:Router(config-pmap-c-flowmon)# exit
Returns to policy class configuration mode.
Step 9
monitor metric ip-cbr
Example:Router(config-pmap-c)# monitor metric ip-cbr
(Optional) Enters IP-CBR monitor metric configuration mode.
Step 10
rate layer3 {byte-rate {bps | kbps | mbps | gbps} | packet}
Example:Router(config-pmap-c-mipcbr)# rate layer3 248 mbps
(Optional) Specifies the rate for monitoring the metrics.
•
•
Step 11
exit
Example:Router(config-pmap-c-mipcbr)# exit
Returns to policy class configuration mode.
Step 12
monitor metric rtp
Example:Router(config-pmap-c)# monitor metric rtp
Enters RTP monitor metric configuration mode.
Step 13
clock-rate {type-number | type-name} rate
Example:Router(config-pmap-c-mrtp)# clock-rate 8 9600
Specifies the clock rate used to sample RTP video-monitoring metrics.
For more information about the clock-type numbers and names, see the Cisco Media Monitoring Command Reference.
The range for rate is 1 kHz to 192 kHz.
Step 14
max-dropout number
Example:Router(config-pmap-c-mrtp)# max-dropout 2
Specifies the maximum number of dropouts allowed when sampling RTP video-monitoring metrics.
Step 15
max-reorder number
Example:Router(config-pmap-c-mrtp)# max-reorder 4
Specifies the maximum number of reorders allowed when sampling RTP video-monitoring metrics.
Step 16
min-sequential number
Example:Router(config-pmap-c-mrtp)# min-sequential 2
Specifies the minimum number of sequental packets required to identify a stream as being an RTP flow.
Step 17
ssrc maximum number
Example:Router(config-pmap-c-mrtp)# ssrc maximum 20
Specifies the maximum number of SSRCs that can be monitored within the same flow. A flow is defined by the protocol, source/destination address, and source/destination port).
Step 18
exit
Example:Router(config-pmap-c-mrtp)# exit
Returns to policy class configuration mode.
Step 19
monitor parameters
Example:Router(config-pmap-c)# monitor parameters
Enters monitor parameters configuration mode.
Step 20
flows number
Example:Router(config-pmap-c-mparam)# flows 40
Specifies the maximum number of flows for each monitor cache.
Step 21
interval duration number
Example:Router(config-pmap-c-mparam)# interval duration 40
Specifies the duration of the intervals, in seconds, for collecting monitoring metrics.
Step 22
history number
Example:Router(config-pmap-c-mparam)# history 4
Specifies the number of historical intervals of collected monitoring metrics to display.
Step 23
timeout number
Example:Router(config-pmap-c-mparam)# timeout 20
Specifies the number intervals before a stopped flow is removed from the database.
Step 24
exit
Example:Router(config-pmap-c-mparam)# exit
Returns to policy class configuration mode.
Step 25
react ID {media-stop | mrv | rtp-jitter-average | transport-packets-lost-rate}
Example:Router(config-pmap-c)# react 41 rtp-jitter-average
Enters a mode where you can specify what reaction occurs when a threshold is violated for the following metrics:
•
•
•
•
•
Step 26
action {snmp | syslog}
Example:Router(config-pmap-c-react)# action syslog
Specifies how violations of the thresholds with be reported.
Step 27
alarm severity {alert | critical | emergency | error | info}
Example:Router(config-pmap-c-react)# alarm severity critical
Specifies which level of alarm will be reported.The default setting is info.
Step 28
alarm type {discrete | grouped {count number | percent number}
Example:Router(config-pmap-c-react)# alarm severity critical
Specifies which types of levels are considered alarms that require reporting. The default setting is discrete.
Step 29
threshold value {ge number | gt number | le number | lt number | range rng-start rng-end}
Example:Router(config-pmap-c-react)# threshold value ge
Specifies which types of levels values are considered alarms that require reporting.
Step 30
description description
Example:Router(config-cmap-c-react)# description rtp-jitter-average above 40
(Optional) Creates a description for the reaction.
Step 31
end
Example:Router(config-pmap-c-react)# end
Exits the current configuration mode and returns to privileged EXEC mode.
Troubleshooting Tips
To check the configuration and status of your flow policy, use the show policy-map type performance-monitor command.
For more information about this command, see the "Troubleshooting and Maintaining Cisco Performance Monitor" section on page 32.
Applying a Cisco Performance Monitor Policy to an Interface Using an Existing Flow Policy
Before it can be activated, a Cisco Performance Monitor policy must be applied to at least one interface. To activate a Cisco Performance Monitor policy, perform the following required task.
SUMMARY STEPS
1.
2.
3.
4.
5.
DETAILED STEPS
Troubleshooting Tips
To check the configuration and status of your service policy, use the follwoign comands:
•
•
•
For more information about these commands, see the "Troubleshooting and Maintaining Cisco Performance Monitor" section on page 32.
Applying a Cisco Performance Monitor Policy to an Interface Without Using an Existing Flow Policy
Before it can be activated, a Cisco Performance Monitor policy must be applied to at least one interface. To activate a Cisco Performance Monitor policy, perform the following required task.
SUMMARY STEPS
1.
2.
3.
4.
5.
6.
7.
8.
9.
10.
11.
12.
13.
14.
15.
16.
17.
18.
19.
20.
21.
22.
23.
24.
25.
26.
27.
28.
29.
30.
31.
DETAILED STEPS
Step 1
enable
Example:Router> enable
Enables privileged EXEC mode.
•
Step 2
configure terminal
Example:Router# configure terminal
Enters global configuration mode.
Step 3
interface type number
Example:Router(config)# interface ethernet 0/0
Specifies an interface and enters interface configuration mode.
Step 4
service-policy type performance-monitor inline {input | output}
Example:Router(config-if)# service-policy type performance-monitor inline input
Attaches a policy map to an input interface or virtual circuit (VC), or an output interface or VC, to be used as the service policy for that interface or VC.
•
•
Step 5
match {access-group {access-group | name access-group-name} | any | class-map class-map-name | cos cos-value | destination-address mac address | discard-class class-number | dscp dscp-value | flow {direction | sampler} | fr-de | fr-dlci dlci-number | input-interface interface-name | ip {rtp starting-port-number port-range | precedence | dscp} | mpls experimental topmost number | not match-criterion | packet length {max maximum-length-value [min minimum-length-value] | min minimum-length-value [max maximum-length-value]} | precedence {precedence-criteria1 | precedence-criteria2 | precedence-criteria3 | precedence-criteria4} | protocol protocol-name | qos-group qos-group-value | source-address mac address-destination| vlan {vlan-id | vlan-range | vlan-combination}}
Example:Router(config-if-spolicy-inline)# match any
Specifies the classification criteria.
For more information and examples, see the Cisco Media Monitoring Command Reference.
Step 6
flow monitor {monitor-name | inline}
Example:Router(config-if-spolicy-inline)# flow monitor inline
Specifies an existing flow monitor to associate with a flow policy. If you do not want to use an existing flow monitor, you can use the inline option to configure a new one.
If needed, you can also use the inline option to specify a flow record and flow exporter.
Step 7
record {record-name | default-rtp | default-tcp}
Example:Router(config-spolicy-inline-flowmon)# record default-tcp
(Optional) If you do not want to use an existing flow monitor, and instead used the inline option, use this command to configure a flow record.
Step 8
exporter exporter-name
Example:Router(config-spolicy-inline-flowmon)# exporter exporter-4
(Optional) If you do not want to use an existing flow monitor, and instead used the inline option, use this command to configure a flow exporter.
Step 9
exit
Example:Router(config-spolicy-inline-flowmon)# exit
Returns to service-policy inline configuration mode.
Step 10
monitor metric ip-cbr
Example:Router(config-if-spolicy-inline)# monitor metric ip-cbr
Enters IP-CBR monitor metric configuration mode.
Step 11
rate layer3 {byte-rate {bps | kbps | mbps | gbps} | packet}
Example:Router(config-spolicy-inline-mipcbr)# rate layer3 248 mbps
Specifies the rate for monitoring the metrics.
•
•
Step 12
exit
Example:Router(config-spolicy-inline-mipcbr)# exit
Returns to service-policy inline configuration mode.
Step 13
monitor metric rtp
Example:Router(config-if-spolicy-inline)# monitor metric rtp
Enters RTP monitor metric configuration mode.
Step 14
clock-rate {type-number | type-name} rate
Example:Router(config-spolicy-inline-mrtp)# clock-rate 8 9600
Specifies the clock rate used to sample RTP video-monitoring metrics.
For more information about the clock-type numbers and names, see the Cisco Media Monitoring Command Reference.
The range for rate is 1 kHz to 192 kHz.
Step 15
max-dropout number
Example:Router(config-spolicy-inline-mrtp)# max-dropout 2
Specifies the maximum number of dropouts allowed when sampling RTP video-monitoring metrics.
Step 16
max-reorder number
Example:Router(config-spolicy-inline-mrtp)# max-reorder 4
Specifies the maximum number of reorders allowed when sampling RTP video-monitoring metrics.
Step 17
min-sequential number
Example:Router(config-spolicy-inline-mrtp)# min-sequential 2
Specifies the minimum number of sequental packets required to identify a stream as being an RTP flow.
Step 18
ssrc maximum number
Example:Router(config-spolicy-inline-mrtp)# ssrc maximum 20
Specifies the maximum number of SSRCs that can be monitored within the same flow. A flow is defined by the protocol, source/destination address, and source/destination port).
Step 19
exit
Example:Router(config-spolicy-inline-mrtp)# exit
Returns to service-policy inline configuration mode.
Step 20
monitor parameters
Example:Router(config-if-spolicy-inline)# monitor parameters
Enters monitor parameters configuration mode.
Step 21
flows number
Example:Router(config-spolicy-inline-mparam)# flows 40
Specifies the maximum number of flows for each monitor cache.
Step 22
interval duration number
Example:Router(config-spolicy-inline-mparam)# interval duration 40
Specifies the duration of the intervals, in seconds, for collecting monitoring metrics.
Step 23
history number
Example:Router(config-spolicy-inline-mparam)# history 4
Specifies the number of historical intervals of collected monitoring metrics to display.
Step 24
timeout number
Example:Router(config-spolicy-inline-mparam)# timeout 20
Specifies the number of intervals before a stopped flow is removed from the database.
Step 25
exit
Example:Router(config-spolicy-inline-mparam)# exit
Returns to service-policy inline configuration mode.
Step 26
react ID {media-stop | mrv | rtp-jitter-average | transport-packets-lost-rate}
Example:Router(config-if-spolicy-inline)# react 6 rtp-jitter-average
Enters a mode where you can specify what reaction occurs when a threshold is violated for the following metrics:
•
•
•
•
•
Step 27
action {snmp | syslog}
Example:Router(config-spolicy-inline-react)# action syslog
Specifies how violations of the thresholds with be reported.
Step 28
alarm severity {alert | critical | emergency | error | info}
Example:Router(config-spolicy-inline-react)# alarm severity critical
Specifies which level of alarm will be reported.
Step 29
alarm type {discrete | grouped {count number | percent number}}
Example:Router(config-pspolicy-inline-react)# alarm severity critical
Specifies which types of levels are considered alarms that require reporting.
Step 30
threshold value {ge number | gt number | le number | lt number | range rng-start rng-end}
Example:Router(config-spolicy-inline-react)# threshold value ge
Specifies which types of levels values are considered alarms that require reporting.
Step 31
end
Example:Router(config-spolicy-inline-react)# end
Exits the current configuration mode and returns to privileged EXEC mode.
To check the configuration and status of your service policy, use the show performance monitor status command and show performance monitor history command.
For more information about these commands, see the "Troubleshooting and Maintaining Cisco Performance Monitor" section on page 32.
Verifying That Cisco Performance Monitor Is Collecting Data
To verify that Cisco Performance Monitor is collecting data, perform the following optional task.
If no data is being collected, complete the remaining tasks in this section.
Prerequisites
The interface to which you applied the input flow monitor must be receiving traffic that meets the criteria defined by the original flow record before you can display the flows in the flow monitor cache.
SUMMARY STEPS
1.
2.
3.
where filter = {ip {source-addr source-prefix | any} {dst-addr dst-prefix | any} | {tcp | udp} {source-addr source-prefix | any} {[eq | lt | gt number | range min max | ssrc {ssrc-number | any} | {{dst-addr dst-prefix | any} eq | lt | gt number | range min max | ssrc {ssrc-number | any}}
4.
where filter = {ip {source-addr source-prefix | any} {dst-addr dst-prefix | any} | {tcp | udp} {source-addr source-prefix | any} {[eq | lt | gt number | range min max | ssrc {ssrc-number | any} | {{dst-addr dst-prefix | any} eq | lt | gt number | range min max | ssrc {ssrc-number | any}}
DETAILED STEPS
Step 1
The enable command enters privileged EXEC mode (enter the password if prompted).
Router> enableRouter#Step 2
For a description of the fields displayed by this command, see Table 1.
The following example shows the output for one flow policy:
Policy Map type performance-monitor PM-POLICY-4Class PM-CLASS-4flow monitor PM-MONITOR-4record PM-RECORD-4exporter PM-EXPORTER-4monitor parametersinterval duration 30timeout 10history 10flows 8000monitor metric rtpmin-sequential 5max-dropout 5max-reorder 5clock-rate default 90000ssrc maximum 5
Step 3
where filter = {ip {source-addr source-prefix | any} {dst-addr dst-prefix | any} | {tcp | udp} {source-addr source-prefix | any} {[eq | lt | gt number | range min max | ssrc {ssrc-number | any} | {{dst-addr dst-prefix | any} eq | lt | gt number | range min max | ssrc {ssrc-number | any}}
This command displays the cumulative statistics for the specified number of most recent intervals. The number of intervals is configured using the history command. The default settings for this commands is 10 of the most recent collection intervals. The duration of collection intervals is specified by the interval duration command.
To view statistics for other intervals, use the show performance monitor history command as described in the next step. For a description of the fields displayed by both commands, see Table 2. For more information about these commands, see the Cisco Media Monitoring Command Reference
Step 4
where filter = {ip {source-addr source-prefix | any} {dst-addr dst-prefix | any} | {tcp | udp} {source-addr source-prefix | any} {[eq | lt | gt number | range min max | ssrc {ssrc-number | any} | {{dst-addr dst-prefix | any} eq | lt | gt number | range min max | ssrc {ssrc-number | any}}
This command displays the statistics collected by Cisco Performance Monitor during any or all intervals, including the current one. The duration of collection intervals is specified by the interval duration command.
For a description of the fields displayed by this command, Table 2. For more information about this command, see the Cisco Media Monitoring Command Reference.
The following example shows the output for the show performance monitor history command:
Codes: * - field is not configurable under flow recordNA - field is not applicable for configured parametersMatch: ipv4 src addr = 1.1.1.1, ipv4 dst addr = 7.7.7.2, ipv4 prot = udp, trns src port = 20001, trns dst port = 10000, SSRC = 4294967291Policy: RTP_POL, Class: RTP_CLASS, Interface: GigabitEthernet0/4, Direction: inputstart time 14:57:34============*history bucket number : 1*counter flow : 1counter bytes : 0counter bytes rate (Bps) : NA*counter bytes rate per flow (Bps) : NA*counter bytes rate per flow min (Bps) : NA*counter bytes rate per flow max (Bps) : NAcounter packets : 0*counter packets rate per flow : 0counter packets dropped : 0routing forwarding-status reason : Unknowninterface input : NAinterface output : NAmonitmeters : trueipv4 dscp : 0ipv4 ttl : 57application media bytes counter : 0application media packets counter : 0application media bytes rate (Bps) : NA*application media bytes rate per flow (Bps) : NA*application media bytes rate per flow min (Bps) : NA*application media bytes rate per flow max (Bps) : NAapplication media packets rate (pps) : 0application media event : Stop*transport rtp flow count : 0transport rtp jitter mean (usec) : NAtransport rtp jitter minimum (usec) : NAtransport rtp jitter maximum (usec) : NA*transport rtp payload type : 0transport event packet-loss counter : NA*transport event packet-loss counter min : NA*transport event packet-loss counter max : NAtransport packets expected counter : NAtransport packets lost counter : NA*transport packets lost counter minimum : NA*transport packets lost rate ( % ) : NA*transport packets lost rate min ( % ) : NA*transport packets lost rate max ( % ) : NA*transport packets lost rate max ( % ) : 0.00*transport tcp flow count : 1*transport round-trip-time sum (msec) : 32*transport round-trip-time samples : 1transport round-trip-time (msec) : 32*transport round-trip-time min (msec) : 32*transport round-trip-time max (msec) : 32
Displaying the Peformacne Monitor Cache and Clients
To display the cache and the clients for Cisco Performance Monitor, perform the following optional task.
SUMMARY STEPS
1.
2.
3.
DETAILED STEPS
Step 1
The enable command enters privileged EXEC mode (enter the password if prompted).
Router> enableRouter#Step 2
MMON Metering Layer Stats:static pkt cnt: 3049static cce sb cnt: 57dynamic pkt cnt: 0Cache type: PermanentCache size: 2000Current entries: 8High Watermark: 9Flows added: 9Updates sent ( 1800 secs) 0IPV4 SRC ADDR IPV4 DST ADDR IP PROT TRNS SRC PORT TRNS DST PORTipv4 ttl ipv4 ttl min ipv4 ttl max ipv4 dscp bytes long perm pktslong perm user space vm==========================================================================================10.1.1.1 10.1.2.3 17 4000 19670 0 0 0x00 801 0x00000000 0x00000000 0x00000000 0x00000000 0x00000000 0x000000000x00000000 0x00000000 0x00000000 0x00000000 0x00000000 0x00000000 0x000000000x00000000 0x00000000 0x00000000 0x00000000 0x00000000 0x00000000 0x000000000x00000000 0x00000000 0x00000000 0x00000000 0x00000000 0x00000000 0x000000000x00000000 0x00000000 0x00000000 0x00000000 0x00000000 0x00000000 0x000000000x00000000 0x00000000 0x00000000 0x00000000 0x00000000 0x00000000 0x000000000x0000000010.1.1.1 10.1.2.3 17 6000 19670 0 0 0x00 801 0x00000000 0x00000000 0x00000000 0x00000000 0x00000000 0x000000000x00000000 0x00000000 0x00000000 0x00000000 0x00000000 0x00000000 0x000000000x00000000 0x00000000 0x00000000 0x00000000 0x00000000 0x00000000 0x000000000x00000000 0x00000000 0x00000000 0x00000000 0x00000000 0x00000000 0x000000000x00000000 0x00000000 0x00000000 0x00000000 0x00000000 0x00000000 0x000000000x00000000 0x00000000 0x00000000 0x00000000 0x00000000 0x00000000 0x000000000x0000000010.1.1.1 10.1.2.3 17 4000 20000 0 0 0x00 441 0x00000000 0x00000000 0x00000000 0x00000000 0x00000000 0x000000000x00000000 0x00000000 0x00000000 0x00000000 0x00000000 0x00000000 0x000000000x00000000 0x00000000 0x00000000 0x00000000 0x00000000 0x00000000 0x000000000x00000000 0x00000000 0x00000000 0x00000000 0x00000000 0x00000000 0x000000000x00000000 0x00000000 0x00000000 0x00000000 0x00000000 0x00000000 0x000000000x00000000 0x00000000 0x00000000 0x00000000 0x00000000 0x00000000 0x000000000x0000000010.1.1.1 10.1.2.3 6 6000 30000 0 0 0x00 842 0x00000000 0x00000000 0x00000000 0x00000000 0x00000000 0x000000000x00000000 0x00000000 0x00000000 0x00000000 0x00000000 0x00000000 0x000000000x00000000 0x00000000 0x00000000 0x00000000 0x00000000 0x00000000 0x000000000x00000000 0x00000000 0x00000000 0x00000000 0x00000000 0x00000000 0x000000000x00000000 0x00000000 0x00000000 0x00000000 0x00000000 0x00000000 0x000000000x00000000 0x00000000 0x00000000 0x00000000 0x00000000 0x00000000 0x000000000x0000000010.1.1.1 10.1.2.3 17 1967 60010 0 0 0x00 361 0x00000000 0x00000000 0x00000000 0x00000000 0x00000000 0x000000000x00000000 0x00000000 0x00000000 0x00000000 0x00000000 0x00000000 0x000000000x00000000 0x00000000 0x00000000 0x00000000 0x00000000 0x00000000 0x000000000x00000000 0x00000000 0x00000000 0x00000000 0x00000000 0x00000000 0x000000000x00000000 0x00000000 0x00000000 0x00000000 0x00000000 0x00000000 0x000000000x00000000 0x00000000 0x00000000 0x00000000 0x00000000 0x00000000 0x000000000x0000000010.1.1.1 10.1.2.3 17 1967 40010 0 0 0x00 361 0x00000000 0x00000000 0x00000000 0x00000000 0x00000000 0x000000000x00000000 0x00000000 0x00000000 0x00000000 0x00000000 0x00000000 0x000000000x00000000 0x00000000 0x00000000 0x00000000 0x00000000 0x00000000 0x000000000x00000000 0x00000000 0x00000000 0x00000000 0x00000000 0x00000000 0x000000000x00000000 0x00000000 0x00000000 0x00000000 0x00000000 0x00000000 0x000000000x00000000 0x00000000 0x00000000 0x00000000 0x00000000 0x00000000 0x000000000x0000000010.1.1.1 10.1.2.3 6 3001 60010 0 0 0x00 1243 0x00000000 0x00000000 0x00000000 0x00000000 0x00000000 0x000000000x00000000 0x00000000 0x00000000 0x00000000 0x00000000 0x00000000 0x000000000x00000000 0x00000000 0x00000000 0x00000000 0x00000000 0x00000000 0x000000000x00000000 0x00000000 0x00000000 0x00000000 0x00000000 0x00000000 0x000000000x00000000 0x00000000 0x00000000 0x00000000 0x00000000 0x00000000 0x000000000x00000000 0x00000000 0x00000000 0x00000000 0x00000000 0x00000000 0x000000000x0000000010.1.1.1 10.1.2.3 17 2001 40010 0 0 0x00 441 0x00000000 0x00000000 0x00000000 0x00000000 0x00000000 0x000000000x00000000 0x00000000 0x00000000 0x00000000 0x00000000 0x00000000 0x000000000x00000000 0x00000000 0x00000000 0x00000000 0x00000000 0x00000000 0x000000000x00000000 0x00000000 0x00000000 0x00000000 0x00000000 0x00000000 0x000000000x00000000 0x00000000 0x00000000 0x00000000 0x00000000 0x00000000 0x000000000x00000000 0x00000000 0x00000000 0x00000000 0x00000000 0x00000000 0x000000000x00000000Step 3
Client name for ID 1 : Mediatrace-131419052Type: MediatraceAge: 443 secondsMonitor Object: _MMON_DYN_-class-map-69Flow spec: (dvmc-acl#47) 10.10.130.2 1000 10.10.132.2 2000 17monitor parametersinterval duration 60timeout 2history 1flows 100monitor metric rtpmin-sequential 10max-dropout 5max-reorder 5clock-rate 112 90000clock-rate default 90000ssrc maximum 20monitor metric ip-cbrrate layer3 packet 20Flow record: dvmc_fnf_fdef_47Key fields:ipv4 source addressipv4 destination addresstransport source-porttransport destination-portip protocolNon-key fields:monitor eventapplication media eventrouting forwarding-statusip dscpip ttlcounter bytes rateapplication media bytes ratetransport rtp jitter meantransport packets lost countertransport packets expected countertransport event packet-loss countertransport packets lost ratetimestamp intervalcounter packets droppedcounter bytescounter packetsapplication media bytes counterapplication media packets counterMonitor point: _MMON_DYN_-policy-map-70 GigabitEthernet0/3 outputClassification Statistic:matched packet: 545790matched byte: 64403220
Displaying the Clock Rate for Cisco Performance Monitor Classes
To display the clock rate for one or more classes, perform the following optional task.
SUMMARY STEPS
1.
2.
DETAILED STEPS
Step 1
The enable command enters privileged EXEC mode (enter the password if prompted).
Router> enableRouter#Step 2
If no class name is specified, information for all classes are displayed.
Router# show performance monitor clock rate policy all-apps class telepresence-CS4Load for five secs: 6%/2%; one minute: 5%; five minutes: 5% Time source is NTP, 17:41:35.508 EST Wed Feb 16 2011RTP clock rate for Policy: all-apps, Class: telepresence-CS4Payload type Clock rate(Hz)pcmu (0 ) 8000gsm (3 ) 8000g723 (4 ) 8000dvi4 (5 ) 8000dvi4-2 (6 ) 16000lpc (7 ) 8000pcma (8 ) 8000g722 (9 ) 8000l16-2 (10 ) 44100l16 (11 ) 44100qcelp (12 ) 8000cn (13 ) 8000mpa (14 ) 90000g728 (15 ) 8000dvi4-3 (16 ) 11025dvi4-4 (17 ) 22050g729 (18 ) 8000celb (25 ) 90000jpeg (26 ) 90000nv (28 ) 90000h261 (31 ) 90000mpv (32 ) 90000mp2t (33 ) 90000h263 (34 ) 90000(96 ) 48000(112) 90000default 90000
Displaying the Current Status of a Flow Monitor
To display the current status of a flow monitor, perform the following optional task.
Prerequisites
The interface to which you applied the input flow monitor must be receiving traffic that meets the criteria defined by the original flow record before you can display the flows in the flow monitor cache.
SUMMARY STEPS
1.
2.
DETAILED STEPS
Step 1
The enable command enters privileged EXEC mode (enter the password if prompted).
Router> enableRouter#Step 2
The show flow monitor type performance-monitor command shows the current status of the flow monitor that you specify.
Router# show flow monitor type performance-monitorFlow Monitor type performance-monitor monitor-4:Description: User definedFlow Record: record-4Flow Exporter: exporter-4No. of Inactive Users: 0No. of Active Users: 0
Verifying the Flow Monitor Configuration
To verify the configuration commands that you entered, perform the following optional task.
Prerequisites
The interface to which you applied the input flow monitor must be receiving traffic that meets the criteria defined by the original flow record before you can display the flows in the flow monitor cache.
SUMMARY STEPS
1.
2.
DETAILED STEPS
Step 1
The enable command enters privileged EXEC mode (enter the password if prompted).
Router> enableRouter#Step 2
The show running-config flow monitor command shows the configuration commands of the flow monitor that you specify.
Router# show running-config flow monitorCurrent configuration:!flow monitor FLOW-MONITOR-1description Used for basic IPv4 traffic analysisrecord netflow ipv4 original-input!!flow monitor FLOW-MONITOR-2description Used for basic IPv6 traffic analysisrecord netflow ipv6 original-input!
Verifying That Cisco IOS Flexible NetFlow and Cisco Performance Monitor Is Enabled on an Interface
To verify that Flexible NetFlow and Cisco Performance Monitor is enabled on an interface, perform the following optional task.
SUMMARY STEPS
1.
2.
DETAILED STEPS
Step 1
The enable command enters privileged EXEC mode (enter the password if prompted).
Router> enableRouter#Step 2
The show flow interface command verifies that Flexible NetFlow and Cisco Performance Monitor is enabled on an interface.
Router# show flow interface ethernet 0/0Interface Ethernet0/0FNF: monitor: FLOW-MONITOR-1direction: Inputtraffic(ip): onFNF: monitor: FLOW-MONITOR-2direction: Inputtraffic(ipv6): on
Displaying the Flow Monitor Cache
To display the data in the flow monitor cache, perform the following optional task.
Prerequisites
The interface to which you applied the input flow monitor must be receiving traffic that meets the criteria defined by the original flow record before you can display the flow data in the flow monitor cache.
SUMMARY STEPS
1.
2.
DETAILED STEPS
Step 1
The enable command enters privileged EXEC mode (enter the password if prompted).
Router> enableRouter#Step 2
The show flow monitor name monitor-name cache format record command string displays the status, statistics, and the flow data in the cache for a flow monitor.
Router# show flow monitor name FLOW-MONITOR-1 cache format recordCache type: NormalCache size: 4096Current entries: 8High Watermark: 8Flows added: 24Flows aged: 16- Active timeout ( 1800 secs) 0- Inactive timeout ( 15 secs) 16- Event aged 0- Watermark aged 0- Emergency aged 0IPV4 SOURCE ADDRESS: 10.251.10.1IPV4 DESTINATION ADDRESS: 172.16.10.2TRNS SOURCE PORT: 0TRNS DESTINATION PORT: 2048INTERFACE INPUT: Et0/0FLOW SAMPLER ID: 0IP TOS: 0x00IP PROTOCOL: 1ip source as: 0ip destination as: 0ipv4 next hop address: 172.16.7.2ipv4 source mask: /0ipv4 destination mask: /24tcp flags: 0x00interface output: Et1/0counter bytes: 733500counter packets: 489timestamp first: 720892timestamp last: 975032...IPV4 SOURCE ADDRESS: 172.16.6.1IPV4 DESTINATION ADDRESS: 224.0.0.9TRNS SOURCE PORT: 520TRNS DESTINATION PORT: 520INTERFACE INPUT: Et0/0FLOW SAMPLER ID: 0IP TOS: 0xC0IP PROTOCOL: 17ip source as: 0ip destination as: 0ipv4 next hop address: 0.0.0.0ipv4 source mask: /24ipv4 destination mask: /0tcp flags: 0x00interface output: Nullcounter bytes: 52counter packets: 1timestamp first: 973804timestamp last: 973804Router# show flow monitor name FLOW-MONITOR-2 cache format recordCache type: NormalCache size: 4096Current entries: 6High Watermark: 8Flows added: 1048Flows aged: 1042- Active timeout ( 1800 secs) 11- Inactive timeout ( 15 secs) 1031- Event aged 0- Watermark aged 0- Emergency aged 0IPV6 FLOW LABEL: 0IPV6 EXTENSION MAP: 0x00000040IPV6 SOURCE ADDRESS: 2001:DB8:1:ABCD::1IPV6 DESTINATION ADDRESS: 2001:DB8:4:ABCD::2TRNS SOURCE PORT: 3000TRNS DESTINATION PORT: 55INTERFACE INPUT: Et0/0FLOW DIRECTION: InputFLOW SAMPLER ID: 0IP PROTOCOL: 17IP TOS: 0x00ip source as: 0ip destination as: 0ipv6 next hop address: ::ipv6 source mask: /48ipv6 destination mask: /0tcp flags: 0x00interface output: Nullcounter bytes: 521192counter packets: 9307timestamp first: 9899684timestamp last: 11660744...IPV6 FLOW LABEL: 0IPV6 EXTENSION MAP: 0x00000000IPV6 SOURCE ADDRESS: FE80::A8AA:BBFF:FEBB:CC03IPV6 DESTINATION ADDRESS: FF02::9TRNS SOURCE PORT: 521TRNS DESTINATION PORT: 521INTERFACE INPUT: Et0/0FLOW DIRECTION: InputFLOW SAMPLER ID: 0IP PROTOCOL: 17IP TOS: 0xE0ip source as: 0ip destination as: 0ipv6 next hop address: ::ipv6 source mask: /10ipv6 destination mask: /0tcp flags: 0x00interface output: Nullcounter bytes: 92counter packets: 1timestamp first: 11653832timestamp last: 11653832
Displaying the Current Status of a Flow Exporter
To display the current status of a flow exporter, perform the following optional task.
SUMMARY STEPS
1.
2.
DETAILED STEPS
Step 1
The enable command enters privileged EXEC mode (enter the password if prompted).
Router> enableRouter#Step 2
The show flow exporter command shows the current status of the flow exporter that you specify.
Router# show flow exporter EXPORTER-1Flow Exporter EXPORTER-1:Description: Exports to Chicago datacenterTransport Configuration:Destination IP address: 172.16.10.2Source IP address: 172.16.7.1Transport Protocol: UDPDestination Port: 65Source Port: 56041DSCP: 0x0TTL: 255
Verifying the Flow Exporter Configuration
To verify the configuration commands that you entered to configure the flow exporter, perform the following optional task.
SUMMARY STEPS
1.
2.
DETAILED STEPS
Step 1
The enable command enters privileged EXEC mode (enter the password if prompted).
Router> enableRouter#Step 2
The show running-config flow exporter command shows the configuration commands of the flow exporter that you specify.
Router# show running-config flow exporter EXPORTER-1Building configuration...!flow exporter EXPORTER-1description Exports to datacenterdestination 172.16.10.2transport udp 65!
Enabling Debugging
To enable debugging for Cisco Performance Monitor, perform the following optional task in privileged EXEC mode.
SUMMARY STEPS
1.
DETAILED STEPS
Step 1
The debug performance monitor command enables debugging for the following performance monitor components:
•
•
•
•
•
•
•
•
•
•
•
The following example shows how to enable debugging for dynamic monitoring:
Router# debug performance monitor dynamic
Configuration Example For Cisco Performacne Monitor
The following example show you how to configure a basic functionality for Cisco Performance Monitor:
•
Example: Monitor for Lost RTP Packets and RTP Jitter
This example show a configuration that monitors the number of lost RTP packets, the amount of RTP jitter, and other basic statistics for the gig1 interface. In this example, Cisco Performance Monitor is also configured to make an entry in the sylog when the any of the following events occur on the interface:
•
•
•
! Set the filter spec for the flows to monitor.access-list 101 ip permit host 10.10.2.20 any! Use the flow record to define the flow keys and metric to collect.flow record type performance-monitor video-monitor-recordmatch ipv4 sourcematch ipv4 destinationmatch transport source-portmatch transport destination-portmatch rtp ssrccollect timestampcollect counter bytecollect counter packetcollect msecollect media-errorcollect counter rtp interval-jittercollect counter rtp packet lostcollect counter rtp lost event! Set the exporting server. The export message format is based on FNFv.9.flow export video-nms-serverexport-protocol netflow-v9destination cisco-video-managementtransport udp 32001! Set the flow filter in the class-map.class-map match-all video-classaccess-group ipv4 101! Set the policy map with the type performance-monitor for video monitor.policy-map type performance-monitor video-monitor! Set the video monitor actions.class video-class! Specify where the metric data is being exported to.export flow video-nms-serverflow monitor inlinerecord video-monitor-record! Set the monitoring modeling parameters.monitor parameters! Set the measurement timeout to 10 secs.interval duration 10! Set the timeout to 10 minutes.timeout 10! Specify that 30 flow intervals can be kept in performance database.history 30priority 7! Set rtp flow verification criteria.monitor metric rtp! Configure a RTP flow criteria: at least 10 packets in sequence.min-sequential 10! Ignore packets that are more than 5 packet ahead in terms of seq number. max-dropout 5! Ignore packets that are more than 5 packets behind in terms of seq number.max-reorder 5! Set the clock rate frequency for rtp packet timestamp clock.clock-rate 89000! Set the maximum number of ssrc sllowed within this class.ssrc maximum 100! Set TCA for alarm.react 100 transport-packets-lost-ratedescription critical TCA! Set the threshold to greater than 10%.threshold gt 10! Set the threshold to the average number based on the last five intervals.threshold type average 5action syslogalarm severity criticalreact 110 transport-packets-lost-ratedescription medium TCA! Set the threshold to between 5% and 9% of packet lost.threshold range gt 5 le 9threshold type average 10action syslogalarm type grouped percent 30react 3000 media-stopaction syslogalarm severity criticalalarm type grouped percent 30interface gig1service-policy type performance-monitor video-mon inWhere to Go Next
For more information about configuring the products in the Medianet product family, see the other chapter in this guide or see the Cisco Media Monitoring Configuration Guide.
Additional References
The following sections provide references related to Flexible NetFlow.
Related Documents
IP addressing commands: complete command syntax, command mode, command history, defaults, usage guidelines, and examples
Cisco IOS commands
Configuration commands for Flexible NetFlow
Overview of Flexible NetFlow
Flexible NetFlow Feature Roadmap
Configuring flow exporters to export Flexible NetFlow data.
"Configuring Data Export for Cisco IOS Flexible NetFlow with Flow Exporters"
Customizing Flexible NetFlow
"Customizing Cisco IOS Flexible NetFlow Flow Records and Flow Monitors"
Configuring flow sampling to reduce the overhead of monitoring traffic with Flexible NetFlow
"Using Cisco IOS Flexible NetFlow Flow Sampling to Reduce the CPU Overhead of Analyzing Traffic"
Configuring Flexible NetFlow using predefined records
"Configuring Cisco IOS Flexible NetFlow with Predefined Records"
Using Flexible NetFlow Top N Talkers to analyze network traffic
"Using Cisco IOS Flexible NetFlow Top N Talkers to Analyze Network Traffic"
Configuring IPv4 multicast statistics support for Flexible NetFlow
"Configuring IPv4 Multicast Statistics Support for Cisco IOS Flexible NetFlow"
Standards
MIBs
RFCs
RFC 3954
Cisco Systems NetFlow Services Export Version 9
RFC 3550
RTP: A Transport Protocol for Real-Time Applications
Technical Assistance
Feature Information for Cisco Performance Monitor
Table 3 lists the features in this module and provides links to specific configuration information.
Use Cisco Feature Navigator to find information about platform support and software image support. Cisco Feature Navigator enables you to determine which software images support a specific software release, feature set, or platform. To access Cisco Feature Navigator, go to http://www.cisco.com/go/cfn. An account on Cisco.com is not required.
Note
Cisco and the Cisco Logo are trademarks of Cisco Systems, Inc. and/or its affiliates in the U.S. and other countries. A listing of Cisco's trademarks can be found at www.cisco.com/go/trademarks. Third party trademarks mentioned are the property of their respective owners. The use of the word partner does not imply a partnership relationship between Cisco and any other company. (1005R)
Any Internet Protocol (IP) addresses used in this document are not intended to be actual addresses. Any examples, command display output, and figures included in the document are shown for illustrative purposes only. Any use of actual IP addresses in illustrative content is unintentional and coincidental.
© 2006-2011 Cisco Systems, Inc. All rights reserved.