Downloads |
 Feedback Feedback
|
Table Of Contents
Prerequisites for Embedded Event Manager 2.2
Information About Embedded Event Manager 2.2
Embedded Event Manager Actions
Embedded Event Manager Environment Variables
Embedded Event Manager Policies
How to Configure Embedded Event Manager 2.2
Registering and Defining an Embedded Event Manager Applet
Registering and Defining an Embedded Event Manager Tcl Script
Registering and Defining an Embedded Event Manager Policy to Run Manually
Unregistering Embedded Event Manager Policies
Suspending Embedded Event Manager Policy Execution
Managing Embedded Event Manager Policies
Configuring and Tracking a Stub Object Using Embedded Event Manager
Displaying Embedded Event Manager History Data
Displaying Embedded Event Manager Registered Policies
Configuration Examples for Embedded Event Manager 2.2
Embedded Event Manager Applet Configuration: Example
Embedded Event Manager Manual Policy Execution: Example
Configuring and Tracking a Stub Object Using Embedded Event Manager: Example
Embedded Event Manager Watchdog System Monitor Event Detector Configuration: Example
EEM Event Detector Demo: Example
EEM Sample Policy Descriptions
Event Manager Environment Variables for the Sample Policies
Registration of Some EEM Policies
Basic Configuration Details for All Sample Policies
Embedded Event Manager 2.2
Embedded Event Manager (EEM) is a distributed, scalable, and customized approach to event detection and recovery offered directly in a Cisco IOS device. EEM offers the ability to monitor events and take informational or corrective action when the monitored events occur or when a threshold is reached. An EEM policy is an entity that defines an event and the actions to be taken when that event occurs.
EEM 2.2 introduces some new event detectors and actions, including enhanced object tracking.
History for the Embedded Event Manager 2.2 Feature
Finding Support Information for Platforms and Cisco IOS Software Images
Use Cisco Feature Navigator to find information about platform support and Cisco IOS software image support. Access Cisco Feature Navigator at http://www.cisco.com/go/fn. You must have an account on Cisco.com. If you do not have an account or have forgotten your username or password, click Cancel at the login dialog box and follow the instructions that appear.
Contents
•
Prerequisites for Embedded Event Manager 2.2
•
•
•
Prerequisites for Embedded Event Manager 2.2
•
•
•
Information About Embedded Event Manager 2.2
To configure Embedded Event Manager 2.2, you should understand the following concepts:
•
•
•
Embedded Event Manager
Event tracking and management has traditionally been performed by devices external to the networking device. Embedded Event Manager (EEM) has been designed to offer event management capability directly in Cisco IOS based devices. The on-device, proactive event management capabilities of EEM are useful because not all event management can be done off router because some problems compromise communication between the router and the external network management device. Capturing the state of the router during such situations can be invaluable in taking immediate recovery actions and gathering information to perform root-cause analysis. Network availability is also improved if automatic recovery actions are performed without the need to fully reboot the routing device.
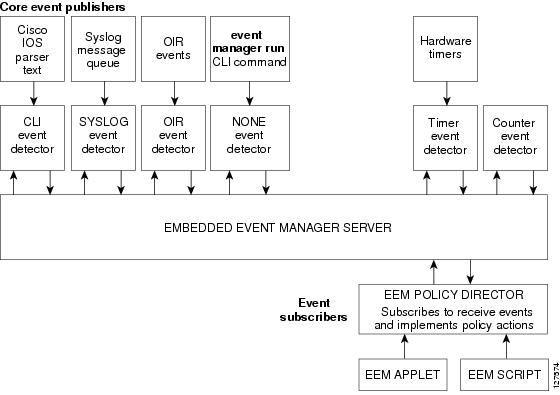
EEM is a flexible, policy-driven framework that supports in-box monitoring of different components of the system with the help of software agents known as event detectors. Figure 1 shows the relationship between the EEM server, core event publishers (event detectors), and the event subscribers (policies). Basically, event publishers screen events and publish them when there is a match on an event specification that is provided by the event subscriber. Event detectors notify the EEM when an event of interest occurs. The EEM policies that are configured using the Cisco IOS command-line interface (CLI) then implement recovery on the basis of the current state of the system and the actions specified in the policy for the given event.
Figure 1 Embedded Event Manager Core Event Detectors
EEM offers the ability to monitor events and take informational or corrective action when the monitored events occur or when a threshold is reached. An EEM policy is an entity that defines an event and the actions to be taken when that event occurs. There are two types of EEM policies: an applet or a script. An applet is a simple form of policy that is defined within the CLI configuration. A script is a form of policy that is written in Tcl.
Embedded Event Manager 2.2
EEM 2.2 is supported in Cisco IOS Release 12.4(2)T and introduces some new features. EEM 2.2 introduces the following new event detectors:
•
Enhanced object tracking provides complete separation between the objects to be tracked and the action to be taken by a client when a tracked object changes. Thus, several clients such as EEM, Virtual Router Redundancy Protocol (VRRP), or Gateway Load Balancing Protocol (GLBP) can register their interest with the tracking process, track the same object, and each take different action when the object changes. Each tracked object is identified by a unique number that is specified on the tracking command-line interface (CLI). Client processes use this number to track a specific object. The tracking process periodically polls the tracked objects and notes any change of value. The changes in the tracked object are communicated to interested client processes, either immediately or after a specified delay. The object values are reported as either up or down.•
•
EEM 2.2 introduces the following actions:
•
•
Event Detectors
Embedded Event Manager (EEM) uses software programs known as event detectors to determine when an EEM event occurs. Event detectors are separate systems that provide an interface between the agent being monitored, for example Simple Network Management Protocol (SNMP), and the EEM policies where an action can be implemented. EEM 2.2 contains the following event detectors.
Application-Specific Event Detector
The application-specific event detector allows any Embedded Event Manager policy to publish an event.
CLI Event Detector
The CLI event detector screens command-line interface (CLI) commands for a regular expression match. When a match is found, an event is published. The match logic is performed on the fully expanded CLI command after the command is successfully parsed and before it is executed. The CLI event detector supports three publish modes:
•
•
•
Counter Event Detector
The counter event detector publishes an event when a named counter crosses a specified threshold. There are two or more participants that affect counter processing. The counter event detector can modify the counter, and one or more subscribers define the criteria that cause the event to be published. After a counter event has been published, the counter monitoring logic can be reset to start monitoring the counter immediately or it can be reset when a second threshold—called an exit value—is crossed.
Enhanced Object Tracking Event Detector
The enhanced object tracking event detector publishes an event when the status of a tracked object changes. Object tracking was first introduced into the Hot Standby Router Protocol (HSRP) as a simple tracking mechanism that allowed you to track the interface line-protocol state only. If the line-protocol state of the interface went down, the HSRP priority of the router was reduced, allowing another HSRP router with a higher priority to become active.
Object tracking was enhanced to provide complete separation between the objects to be tracked and the action to be taken by a client when a tracked object changes. Thus, several clients such as HSRP, VRRP, or GLBP can register their interest with the tracking process, track the same object, and each take different action when the object changes. Each tracked object is identified by a unique number that is specified on the tracking command-line interface (CLI). Client processes use this number to track a specific object. The tracking process periodically polls the tracked objects and notes any change of value. The changes in the tracked object are communicated to interested client processes, either immediately or after a specified delay. The object values are reported as either up or down.
Enhanced object tracking is now integrated with EEM to allow EEM to report on a status change of a tracked object and to allow enhanced object tracking to track EEM objects. A new type of tracking object—a stub object—is created. The stub object can be manipulated using the existing CLI commands that already allow tracked objects to be manipulated.
Interface Counter Event Detector
The interface counter event detector publishes an event when a generic Cisco IOS interface counter for a specified interface crosses a defined threshold. A threshold can be specified as an absolute value or an incremental value. If the incremental value is set to 50, for example, an event would be published when the interface counter increases by 50.
After an interface counter event has been published, the interface counter monitoring logic is reset using two methods. The interface counter is reset either when a second threshold—called an exit value—is crossed or when an elapsed period of time occurs.
None Event Detector
The none event detector publishes an event when the Cisco IOS event manager run CLI command executes an EEM policy. EEM schedules and runs policies on the basis of an event specification that is contained within the policy itself. An EEM policy must be identified and registered to be permitted to run manually before the event manager run command will execute.
OIR Event Detector
The online insertion and removal (OIR) event detector publishes an event when one of the following hardware insertion or removal events occurs:
•
•
Route Processors (RPs), line cards, or feature cards can be monitored for OIR events.
Resource Event Detector
The resource event detector publishes an event when the Embedded Resource Manager (ERM) reports an event for the specified policy. The ERM infrastructure tracks resource depletion and resource dependencies across processes and within a system to handle various error conditions. The error conditions are handled by providing an equitable sharing of resources between various applications. The ERM framework provides a communication mechanism for resource entities and allows communication between these resource entities from numerous locations. The ERM framework also helps in debugging the CPU and memory-related issues. The ERM monitors system resource usage to better understand scalability needs by allowing you to configure threshold values for resources such as the CPU, buffers, and memory. For more details about ERM, see the "Embedded Resource Manager" chapter of the
Cisco IOS Network Management Configuration Guide, Release 12.4.RF Event Detector
The redundancy framework (RF) event detector publishes an event when one or more RF events occur during synchronization in a dual Route Processor (RP) system. The RF event detector can also detect an event when a dual RP system continuously switches from one RP to another RP (referred to as a ping-pong situation).
SNMP Event Detector
The SNMP event detector allows a standard SNMP MIB object to be monitored and an event to be generated when the object matches specified values or crosses specified thresholds.
Syslog Event Detector
The syslog event detector allows for screening syslog messages for a regular expression pattern match. The selected messages can be further qualified, requiring that a specific number of occurrences be logged within a specified time. A match on a specified event criteria triggers a configured policy action.
Timer Event Detector
The timer event detector publishes events for the following four different types of timers:
•
•
•
•
Watchdog System Monitor Event Detector
The Cisco IOS watchdog system monitor event detector publishes an event when one of the following occurs:
•
•
Two events may be monitored at the same time, and the event publishing criteria can be specified to require one event or both events to cross their specified thresholds.
Embedded Event Manager Actions
The CLI-based corrective actions that are taken when event detectors report events enable a powerful on-device event management mechanism. EEM 2.2 supports the following actions:
•
•
•
•
•
•
•
•
•
•
•
•
•
Embedded Event Manager Environment Variables
Tool Command Language (Tcl) allows global variables to be defined that are known to all procedures within a Tcl script. EEM allows environment variables to be defined using a CLI command, the event manager environment command, for use within an EEM policy. All EEM environment variables are automatically assigned to Tcl global variables before a Tcl script is run. There are three different types of environment variables associated with Embedded Event Manager:
•
•
•
Cisco-defined environment variables (see Table 1) and Cisco system-defined environment variables (see Table 2) may apply to one specific event detector or to all event detectors. Environment variables that are user-defined or defined by Cisco in a sample policy are set using the event manager environment command. Variables that are used in the EEM policy must be defined before you register the policy. A policy contains a section called "Environment Must Define" that can be defined to check that any required environment variables are defined before the policy runs.
Note
Table 1 describes the Cisco-defined variables used in the sample EEM policies.
Table 2 describes the Cisco system-defined environment variables that are read only.
Embedded Event Manager Policies
EEM offers the ability to monitor events and take informational or corrective action when the monitored events occur or reach a threshold. An EEM policy is an entity that defines an event and the actions to be taken when that event occurs. There are two types of EEM policies: an applet or a script. An applet is a simple form of policy that is defined within the CLI configuration. A script is a form of policy that is written in Tool Command Language (Tcl).
EEM Applet
An EEM applet is a concise method for defining event screening criteria and the actions to be taken when that event occurs. In EEM applet configuration mode, three types of configuration statements are supported. The event commands are used to specify the event criteria to trigger the applet to run, the action commands are used to specify an action to perform when the EEM applet is triggered, and the set command is used to set the value of an EEM applet variable. Currently only the _exit_status variable is supported for the set command.
Only one event configuration command is allowed within an applet configuration. When applet configuration submode is exited and no event command is present, a warning is displayed stating that no event is associated with this applet. If no event is specified, this applet is not considered registered and the applet is not displayed. When no action is associated with this applet, events are still triggered but no actions are performed. Multiple action configuration commands are allowed within an applet configuration. Use the show event manager policy registered command to display a list of registered applets.
Before modifying an EEM applet, be aware that the existing applet is not replaced until you exit applet configuration mode. While you are in applet configuration mode modifying the applet, the existing applet may be executing. It is safe to modify the applet without unregistering it, because changes are written to a temporary file. When you exit applet configuration mode, the old applet is unregistered and the new version is registered.
Action configuration commands are uniquely identified using the label argument, which can be any string value. Actions are sorted in ascending alphanumeric key sequence using the label argument as the sort key and are run using this sequence.
The Embedded Event Manager schedules and runs policies on the basis of an event specification that is contained within the policy itself. When applet configuration mode is exited, EEM examines the event and action commands that are entered and registers the applet to be run when a specified event occurs.
EEM Script
Scripts are defined off the networking device using an ASCII editor. The script is then copied to the networking device and registered with EEM. Tcl scripts are supported by EEM.
EEM allows you to write and implement your own policies using Tcl. Writing an EEM policy involves:
•
•
•
Cisco provides enhancements to Tcl in the form of keyword extensions that facilitate the development of EEM policies. The main categories of keywords identify the detected event, the subsequent action, utility information, counter values, and system information. For more details about the EEM event detectors and about creating EEM policies, see the Writing Embedded Event Manager Policies document.
Cisco includes a set of sample policies. You can copy the sample policies to a user directory and then modify the policies, or you can write your own policies. Tcl is currently the only Cisco-supported scripting language for policy creation. Tcl policies can be modified using a text editor such as Emacs. Policies must execute within a defined number of seconds of elapsed time and the time variable can be configured within a policy. The default is currently 20 seconds.
Table 3 describes the sample EEM policies.
The sample policies feature the timer and syslog event detectors. The timer event detector generates the following time-based events:
•
•
•
•
Watchdog timer events occur when a timer counts down to zero and automatically rearm when they reach zero. Countdown timer events occur when a timer counts down to zero without being rearmed. An absolute timer event occurs when an absolute time of day is passed. CRON timer events occur when the CRON string specification matches the current time.
The syslog event detector screens syslog messages using Posix regular expressions. An event can be triggered after one or more occurrences of a message match. An additional modifier can be specified to require that the number of message match occurrences happen within a set period of time in order for an event to be triggered.
For more details about the sample policies, see the "EEM Event Detector Demo: Example" section.
How to Configure Embedded Event Manager 2.2
This section contains the following tasks:
•
•
•
•
•
•
•
•
•
Registering and Defining an Embedded Event Manager Applet
Perform this task to register an applet with Embedded Event Manager and to define the EEM applet using event and action commands. Only one event command is allowed in an EEM applet. Multiple action commands are permitted. If no event and no action commands are specified, the applet is removed when you exit configuration mode.
EEM Policies
EEM offers the ability to monitor events and take informational or corrective action when the monitored events occur or when a threshold is reached. An EEM policy is an entity that defines an event and the actions to be taken when that event occurs. There are two types of EEM policies: an applet or a script. An applet is a simple form of policy that is defined within the CLI configuration. A script is a form of policy that is written in Tcl.
SUMMARY STEPS
1.
2.
3.
4.
5.
6.
7.
DETAILED STEPS
Step 1
enable
Example:Router> enable
Enables privileged EXEC mode.
•
Step 2
configure terminal
Example:Router# configure terminal
Enters global configuration mode.
Step 3
event manager applet applet-name
Example:Router(config)# event manager applet memory-fail
Registers the applet with the Embedded Event Manager (EEM) and enters applet configuration mode.
Step 4
event snmp oid oid-value get-type {exact | next} entry-op operator entry-val entry-value [exit-comb {or | and}] [exit-op operator] [exit-val exit-value] [exit-time exit-time-value] poll-interval poll-int-value
Example:Router(config-applet)# event snmp oid 1.3.6.1.4.1.9.9.48.1.1.1.6.1 get-type exact entry-op lt entry-val 5120000 poll-interval 10
Specifies the event criteria that cause the EEM applet to run.
•
•
Step 5
action label syslog [priority priority-level] msg msg-text
Example:Router(config-applet)# action 1.0 syslog priority critical msg "Memory exhausted; current available memory is $_snmp_oid_val bytes"
Specifies the action to be taken when an EEM applet is triggered.
•
•
•
Step 6
Repeat Step 5.
Example:Router(config-applet)# action 2.0 force-switchover
(Optional) Repeat Step 5 to add other action CLI commands to the applet.
Step 7
end
Example:Router(config-applet)# end
Exits applet configuration mode and returns to privileged EXEC mode.
Troubleshooting Tips
Use the debug event manager command in privileged EXEC mode to troubleshoot EEM command operations. Use any debugging command with caution as the volume of generated output can slow or stop the router operations. We recommend that this command be used only under the supervision of a Cisco engineer.
Registering and Defining an Embedded Event Manager Tcl Script
Perform this task to configure environment variables and register an EEM policy. EEM schedules and runs policies on the basis of an event specification that is contained within the policy itself. When an EEM policy is registered, the software examines the policy and registers it to be run when the specified event occurs.
EEM Policies
EEM offers the ability to monitor events and take informational or corrective action when the monitored events occur or when a threshold is reached. An EEM policy is an entity that defines an event and the actions to be taken when that event occurs. There are two types of EEM policies: an applet or a script. An applet is a simple form of policy that is defined within the CLI configuration. A script is a form of policy that is written in Tcl.
Prerequisites
You must have a policy available that is written in the Tcl scripting language. Three sample policies—sl_intf_down.tcl, tm_cli_cmd.tcl, and tm_crash_reporter.tcl—are provided, and these sample policies are stored in the system policy directory.
SUMMARY STEPS
1.
2.
3.
4.
5.
6.
7.
DETAILED STEPS
Step 1
enable
Example:Router> enable
Enables privileged EXEC mode.
•
Step 2
show event manager environment [all | variable-name]
Example:Router# show event manager environment all
(Optional) Displays the name and value of EEM environment variables.
•
•
Step 3
configure terminal
Example:Router# configure terminal
Enters global configuration mode.
Step 4
event manager environment variable-name string
Example:Router(config)# event manager environment _cron_entry 0-59/2 0-23/1 * * 0-6
Configures the value of the specified EEM environment variable.
•
Step 5
Repeat Step 4 for all the required environment variables.
Repeat Step 4 to configure all the environment variables required by the policy to be registered in Step 6.
Step 6
event manager policy policy-filename [type {system | user}] [trap]
Example:Router(config)# event manager policy tm_cli_cmd.tcl type system
Registers the EEM policy to be run when the specified event defined within the policy occurs.
•
•
•
Step 7
exit
Example:Router(config)# exit
Exits global configuration mode and returns to privileged EXEC mode.
Examples
In the following example, the show event manager environment privileged EXEC command is used to display the name and value of all EEM environment variables.
Router# show event manager environment allNo. Name Value1 _cron_entry 0-59/2 0-23/1 * * 0-62 _show_cmd show ver3 _syslog_pattern .*UPDOWN.*Ethernet1/0.*4 _config_cmd1 interface Ethernet1/05 _config_cmd2 no shutRegistering and Defining an Embedded Event Manager Policy to Run Manually
There are two ways to manually run an EEM policy. EEM usually schedules and runs policies on the basis of an event specification that is contained within the policy itself. The event none command allows EEM to identify an EEM policy that can either be run manually or be run when an EEM applet is triggered. To run the policy, use either the action policy command in applet configuration mode or the event manager run command in global configuration mode.
Perform this task to register an EEM policy to be run manually using the event manager run command. For an example of how to manually run a policy using the action policy command, see the "Embedded Event Manager Manual Policy Execution: Example" section.
SUMMARY STEPS
1.
2.
3.
4.
5.
6.
7.
DETAILED STEPS
Unregistering Embedded Event Manager Policies
Perform this task to remove an EEM policy from the running configuration file. Execution of the policy is canceled.
SUMMARY STEPS
1.
2.
3.
4.
5.
6.
DETAILED STEPS
Step 1
enable
Example:Router> enable
Enables privileged EXEC mode.
•
Step 2
show event manager policy registered [event-type event-name] [system | user] [time-ordered | name-ordered]
Example:Router# show event manager policy registered
(Optional) Displays the EEM policies that are currently registered.
•
•
Step 3
configure terminal
Example:Router# configure terminal
Enters global configuration mode.
Step 4
no event manager policy policy-filename
Example:Router(config)# no event manager policy pr_cdp_abort.tcl
Removes the EEM policy from the configuration, causing the policy to be unregistered.
•
Step 5
exit
Example:Router(config)# exit
Exits global configuration mode and returns to privileged EXEC mode.
Step 6
Repeat Step 2 to ensure that the policy is removed.
Example:Router# show event manager policy registered
—
Examples
In the following example, the show event manager policy registered privileged EXEC command is used to display the three EEM policies that are currently registered:
Router# show event manager policy registeredNo. Type Event Type Trap Time Registered Name1 system timer cron Off Sat Oct11 01:43:18 2003 tm_cli_cmd.tclname {crontimer2} cron entry {0-59/1 0-23/1 * * 0-7}nice 0 priority normal maxrun 240.0002 system syslog Off Sat Oct11 01:43:28 2003 sl_intf_down.tcloccurs 1 pattern {.*UPDOWN.*Ethernet1/0.*}nice 0 priority normal maxrun 90.0003 system proc abort Off Sat Oct11 01:43:38 2003 pr_cdp_abort.tclinstance 1 path {cdp2.iosproc}nice 0 priority normal maxrun 20.000Suspending Embedded Event Manager Policy Execution
Perform this task to immediately suspend the execution of all EEM policies. Suspending instead of unregistering policies might be necessary for reasons of temporary performance or security.
SUMMARY STEPS
1.
2.
3.
4.
5.
DETAILED STEPS
Examples
In the following example, the show event manager policy registered privileged EXEC command is used to display all the EEM registered policies:
Router# show event manager policy registeredNo. Type Event Type Trap Time Registered Name1 system timer cron Off Sat Oct11 01:43:18 2003 tm_cli_cmd.tclname {crontimer2} cron entry {0-59/1 0-23/1 * * 0-7}nice 0 priority normal maxrun 240.0002 system syslog Off Sat Oct11 01:43:28 2003 sl_intf_down.tcloccurs 1 pattern {.*UPDOWN.*Ethernet1/0.*}nice 0 priority normal maxrun 90.0003 system proc abort Off Sat Oct11 01:43:38 2003 pr_cdp_abort.tclinstance 1 path {cdp2.iosproc}nice 0 priority normal maxrun 20.000Managing Embedded Event Manager Policies
Perform this task to define a location in the local file system containing an installed modular Cisco IOS image to run on all the nodes in a system, or on just one specified node.
SUMMARY STEPS
1.
2.
3.
4.
5.
DETAILED STEPS
Examples
In the following example, the show event manager directory user privileged EXEC command is used to display the directory, if it exists, to use for storing EEM user library files:
Router# show event manager directory user librarydisk0:/usr/lib/tclConfiguring and Tracking a Stub Object Using Embedded Event Manager
Perform this task to create a stub object, set the state of the stub object, and configure an EEM applet to be run when the tracked object changes. Actions are specified within the EEM applet to both set and read the state of the object.
Enhanced Object Tracking
Object tracking was first introduced into the Hot Standby Router Protocol (HSRP) as a simple tracking mechanism that allowed you to track the interface line-protocol state only. Enhanced object tracking provides complete separation between the objects to be tracked and the action to be taken by a client when a tracked object changes. Thus, several clients such as EEM, VRRP, or GLBP can register their interest with the tracking process, track the same object, and each take different action when the object changes.
Each tracked object is identified by a unique number that is specified on the tracking command-line interface (CLI). Client processes use this number to track a specific object. The tracking process periodically polls the tracked objects and notes any change of value. The changes in the tracked object are communicated to interested client processes, either immediately or after a specified delay. The object values are reported as either up or down.
The enhanced object tracking event detector publishes an event when the tracked object changes.
SUMMARY STEPS
1.
2.
3.
4.
5.
6.
7.
8.
9.
10.
11.
DETAILED STEPS
Step 1
enable
Example:Router> enable
Enables privileged EXEC mode.
•
Step 2
configure terminal
Example:Router# configure terminal
Enters global configuration mode.
Step 3
track object-number stub
Example:Router(config)# track 2 stub
Creates a stub object to be tracked using EEM and enters tracking configuration mode.
•
Step 4
default-state {up | down}
Example:Router(config-track)# default-state up
Sets the default state for a stub object.
•
Step 5
exit
Example:Router(config-track)# exit
Exits tracking configuration mode and returns to global configuration mode.
Step 6
event manager applet applet-name
Example:Router(config)# event manager applet track-two
Registers an applet with the Embedded Event Manager (EEM) and enters applet configuration mode.
Step 7
event [label] track object-number [state {up | down | any}]
Example:Router(config-applet)# event track 2 state down
Specifies the event criteria that cause the EEM applet to run.
•
Step 8
action label track set object-number state {up | down}
Example:Router(config-applet)# action 1.0 track set 2 state up
Specifies the action to be taken when an EEM applet is triggered.
•
Step 9
action label track read object-number
Example:Router(config-applet)# action 2.0 track read 2
Specifies the action to be taken when an EEM applet is triggered.
•
Step 10
end
Example:Router(config-applet)# end
Exits applet configuration mode and returns to privileged EXEC mode.
Step 11
show track [object-number [brief]]
Example:Router# show track 2
(Optional) Displays information about objects that are tracked by the tracking process.
•
•
•
Examples
In the following example, the show track privileged EXEC command is used to display information about the tracked object represented by the number 2.
Router# show track 2Track 2Stub-objectState is Up1 change, last change 00:00:04, by UndefinedDisplaying Embedded Event Manager History Data
Perform this optional task to change the size of the history tables and to display EEM history data.
SUMMARY STEPS
1.
2.
3.
4.
5.
6.
DETAILED STEPS
Step 1
Enables privileged EXEC mode. Enter your password if prompted.
Router> enableStep 2
Enters global configuration mode.
Router# configure terminalStep 3
Use this command to change the size of the EEM event history table or the size of the EEM SNMP trap history table. In the following example, the size of the EEM event history table is changed to 30 entries:
Router(config)# event manager history size events 30Step 4
Exits global configuration mode and returns to privileged EXEC mode.
Router(config)# exitStep 5
Use this command to display detailed information about each EEM event, for example:
Router# show event manager history eventsNo. Time of Event Event Type Name1 Fri Aug13 21:42:57 2004 snmp applet: SAAping12 Fri Aug13 22:20:29 2004 snmp applet: SAAping13 Wed Aug18 21:54:48 2004 snmp applet: SAAping14 Wed Aug18 22:06:38 2004 snmp applet: SAAping15 Wed Aug18 22:30:58 2004 snmp applet: SAAping16 Wed Aug18 22:34:58 2004 snmp applet: SAAping17 Wed Aug18 22:51:18 2004 snmp applet: SAAping18 Wed Aug18 22:51:18 2004 application applet: CustApp1Step 6
Use this command to display the EEM SNMP traps that have been sent either from the EEM server or from an EEM policy. In the following example, the EEM SNMP traps that were triggered from within an EEM policy are displayed.
Router# show event manager history traps policyNo. Time Trap Type Name1 Wed Aug18 22:30:58 2004 policy EEM Policy Director2 Wed Aug18 22:34:58 2004 policy EEM Policy Director3 Wed Aug18 22:51:18 2004 policy EEM Policy Director
Displaying Embedded Event Manager Registered Policies
Perform this optional task to display EEM registered policies.
SUMMARY STEPS
1.
2.
DETAILED STEPS
Step 1
Enables privileged EXEC mode. Enter your password if prompted.
Router> enableStep 2
Use this command with the time-ordered keyword to display information about currently registered policies sorted by time, for example:
Router# show event manager policy registered time-orderedNo. Type Event Type Time Registered Name1 applet snmp Thu May30 05:57:16 2004 memory-failoid {1.3.6.1.4.1.9.9.48.1.1.1.6.1} get-type exact entry-op lt entry-val {5120000} poll-interval 10action 1.0 syslog priority critical msg Memory exhausted; current available memory is $_snmp_oid_val bytesaction 2.0 force-switchover2 applet syslog Wed Jul16 00:05:17 2004 intf-downpattern {.*UPDOWN.*Ethernet1/0.*}action 1.0 cns-event msg Interface state change: $_syslog_msgUse this command with the name-ordered keyword to display information about currently registered policies sorted by name, for example:
Router# show event manager policy registered name-orderedNo. Type Event Type Time Registered Name1 applet syslog Wed Jul16 00:05:17 2004 intf-downpattern {.*UPDOWN.*Ethernet1/0.*}action 1.0 cns-event msg Interface state change: $_syslog_msg2 applet snmp Thu May30 05:57:16 2004 memory-failoid {1.3.6.1.4.1.9.9.48.1.1.1.6.1} get-type exact entry-op lt entry-val {5120000} poll-interval 10action 1.0 syslog priority critical msg Memory exhausted; current available memory is $_snmp_oid_val bytesaction 2.0 force-switchoverUse this command with the event-type keyword to display information about currently registered policies for the event type specified in the event-name argument, for example:
Router# show event manager policy registered event-type syslogNo. Type Event Type Time Registered Name1 applet syslog Wed Jul16 00:05:17 2004 intf-downpattern {.*UPDOWN.*Ethernet1/0.*}action 1.0 cns-event msg Interface state change: $_syslog_msg
Configuration Examples for Embedded Event Manager 2.2
This section contains the following configuration examples:
•
•
•
•
•
Embedded Event Manager Applet Configuration: Example
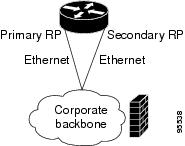
The following example shows how to configure an EEM applet that causes a switch to the secondary (redundant) Route Processor (RP) when the primary RP runs low on memory.
This example illustrates a method for taking preventative action against a software fault that causes a memory leak. The action taken here is designed to reduce downtime by switching over to a redundant RP when a possible memory leak is detected.
Figure 2 Dual RP Topology
The commands used to register the policy are shown below.
event manager applet memory-demoevent snmp oid 1.3.6.1.4.1.9.9.48.1.1.1.6.1 get-type exact entry-op lt entry-val 5120000 poll-interval 10action 1.0 syslog priority critical msg "Memory exhausted; current available memory is $_snmp_oid_val bytes"action 2.0 force-switchoverThe registered applet is displayed using the show event manager policy registered command:
Router# show event manager policy registeredNo. Type Event Type Time Registered Name1 applet snmp Thu Jan30 05:57:16 2003 memory-demooid {1.3.6.1.4.1.9.9.48.1.1.1.6.1} get-type exact entry-op lt entry-val {5120000} poll-interval 10action 1.0 syslog priority critical msg Memory exhausted; current available memory is $_snmp_oid_val bytesaction 2.0 force-switchoverFor the purpose of this example, a memory depletion is forced on the router, and a series of show memory commands are executed to watch the memory deplete:
Router# show memoryHead Total(b) Used(b) Free(b) Lowest(b) Largest(b)Processor 53585260 212348444 119523060 92825384 92825384 92365916Fast 53565260 131080 70360 60720 60720 60668Router# show memoryHead Total(b) Used(b) Free(b) Lowest(b) Largest(b)Processor 53585260 212364664 164509492 47855172 47855172 47169340Fast 53565260 131080 70360 60720 60720 60668Router# show memoryHead Total(b) Used(b) Free(b) Lowest(b) Largest(b)Processor 53585260 212369492 179488300 32881192 32881192 32127556Fast 53565260 131080 70360 60720 60720 60668When the threshold is reached, an EEM event is triggered. The applet named memory-demo runs, causing a syslog message to be written to the console and a switch to be made to the secondary RP. The following messages are logged:
00:08:31: %HA_EM-2-LOG: memory-demo: Memory exhausted; current available memory is
4484196 bytes
00:08:31: %HA_EM-6-FMS_SWITCH_HARDWARE: fh_io_msg: Policy has requested a hardware switchoverConfiguration for the Primary RP and Secondary RP
The following is partial output from the show running-config command on both the primary RP and the secondary (redundant) RP:
redundancymode sso...!event manager applet memory-demoevent snmp oid 1.3.6.1.4.1.9.9.48.1.1.1.6.1 get-type exact entry-op lt entry-val 5120000 poll-interval 10action 1.0 syslog priority critical msg "Memory exhausted; current available memory is $_snmp_oid_val bytes"action 2.0 force-switchoverEmbedded Event Manager Manual Policy Execution: Example
The following examples show how to configure an EEM policy (applet or script) to be run manually.
Using the event manager run Command
This example shows how to run a policy manually using the event manager run command. The policy is registered using the event none command under applet configuration mode and then run from global configuration mode using the event manager run command.
event manager applet manual-policyevent noneaction 1.0 syslog msg "Manual-policy triggered"!event manager run manual-policyUsing the action policy Command
This example shows how to run a policy manually using the action policy command. The policy is registered using the event none command under applet configuration mode and then the policy is executed using the action policy command in applet configuration mode.
event manager applet manual-policyevent noneaction 1.0 syslog msg "Manual-policy triggered"!event manager applet manual-policy-twoevent noneaction 1.0 policy manual-policy!event manager run manual-policy-twoConfiguring and Tracking a Stub Object Using Embedded Event Manager: Example
This example shows how to create a stub object, set the state of the stub object, configure an EEM applet to be run when the tracked object changes. Actions are specified to both set and read the state of the object.
track 10 stubdefault-state down!event manager applet track-tenevent track 10 state anyaction 1.0 track set 10 state upaction 2.0 track read 10Embedded Event Manager Watchdog System Monitor Event Detector Configuration: Example
The following example shows how to configure three EEM applets to demonstrate how the watchdog system monitor event detector works.
Watchdog System Monitor Sample1 Policy
The first policy triggers an applet when the average CPU usage for the process named "IP Input" is greater than or equal to 1 percent for 10 seconds:
event manager applet IOSWD_Sample1event ioswdsysmon sub1 cpu-proc taskname "IP Input" op ge val 1 period 10action 1.0 syslog msg "IOSWD_Sample1 Policy Triggered"Watchdog System Monitor Sample2 Policy
The second policy triggers an applet when the total amount of memory used by the process named "Net Input" is greater than 100 kb:
event manager applet IOSWD_Sample2event ioswdsysmon sub1 mem-proc taskname "Net Input" op gt val 100 is-percent falseaction 1.0 syslog msg "IOSWD_Sample2 Policy Triggered"Watchdog System Monitor Sample3 Policy
The third policy triggers an applet when the total amount of memory used by the process named "IP RIB Update" has increased by more than 50 percent over the sample period of 60 seconds:
event manager applet IOSWD_Sample3event ioswdsysmon sub1 mem-proc taskname "IP RIB Update" op gt val 50 is-percent true period 60action 1.0 syslog msg "IOSWD_Sample3 Policy Triggered"The three policies are configured, and then repetitive large pings are made to the networking device from several workstations, causing the networking device to register some usage. This will trigger policies 1 and 2, and the console will display the following messages:
00:42:23: %HA_EM-6-LOG: IOSWD_Sample1: IOSWD_Sample1 Policy Triggered00:42:47: %HA_EM-6-LOG: IOSWD_Sample2: IOSWD_Sample2 Policy TriggeredTo view the policies that are registered, use the show event manager policy registered command:
Router# show event manager policy registeredNo. Class Type Event Type Trap Time Registered Name1 applet system ioswdsysmon Off Fri Jul 23 02:27:28 2004 IOSWD_Sample1sub1 cpu_util {taskname {IP Input} op ge val 1 period 10.000 }action 1.0 syslog msg IOSWD_Sample1 Policy Triggered2 applet system ioswdsysmon Off Fri Jul 23 02:23:52 2004 IOSWD_Sample2sub1 mem_used {taskname {Net Input} op gt val 100 is_percent FALSE}action 1.0 syslog msg IOSWD_Sample2 Policy Triggered3 applet system ioswdsysmon Off Fri Jul 23 03:07:38 2004 IOSWD_Sample3sub1 mem_used {taskname {IP RIB Update} op gt val 50 is_percent TRUE period 60.000 }action 1.0 syslog msg "IOSWD_Sample3 Policy Triggered"EEM Event Detector Demo: Example
This example uses the sample policies to demonstrate how to use Embedded Event Manager policies. Proceed through the following sections to see how to use the sample policies:
•
•
•
•
EEM Sample Policy Descriptions
This configuration example features the three sample EEM policies:
•
•
•
Event Manager Environment Variables for the Sample Policies
Event manager environment variables are Tcl global variables that are defined external to the EEM policy before the policy is registered and run. The sample policies require three of the e-mail environment variables to be set (see Table 1 for a list of the e-mail variables); only _email_cc is optional. Other required variable settings are outlined in the following tables.
Table 4 describes the EEM environment variables that must be set before the tm_cli_cmd.tcl sample policy is run.
Table 5 describes the EEM environment variables that must be set before the sl_intf_down.tcl sample policy is run.
Table 6 describes the EEM environment variables that must be set before the tm_crash_reporter.tcl sample policy is run.
Registration of Some EEM Policies
Some EEM policies must be unregistered and then reregistered if an EEM environment variable is modified after the policy is registered. The event_register_xxx statement that appears at the start of the policy contains some of the EEM environment variables, and this statement is used to establish the conditions under which the policy is run. If the environment variables are modified after the policy has registered, the conditions may become invalid. To avoid any errors, the policy must be unregistered and then reregistered. The following variables are affected:
•
•
Basic Configuration Details for All Sample Policies
To allow e-mail to be sent from the Embedded Event Manager, the hostname and ip domain-name commands must be configured. The EEM environment variables must also be set. After a Cisco IOS image has been booted, use the following initial configuration, substituting appropriate values for your network:
hostname cpuip domain-name cisco.comevent manager _email_server ms.cisco-user.netevent manager _email_to username@cisco-user.netevent manager _email_from engineer@cisco-user.netevent manager _email_cc projectgroup@cisco-user.netevent manager _cron_entry 0-59/2 0-23/1 * * 0-7event manager _show_cmd show event manager policy registeredevent manager _syslog_pattern .*UPDOWN.*FastEthernet0/0event manager _config_cmd1 interface Ethernet1/0event manager _config_cmd2 no shutevent manager _crash_reporter_debug 1event manager _crash_reporter_url http://www.swpkg.cisco.internal.com/fm/interface_tm.cgiendUsing the Sample Policies
This section contains the following configuration scenarios to demonstrate how to use the three sample Tcl policies:
•
•
•
Running the sl_intf_down.tcl Sample Policy
This sample policy demonstrates the ability to modify the configuration when a syslog message with a specific pattern is logged. The policy gathers detailed information about the event and uses the CLI library to execute the configuration commands specified in the EEM environment variables _config_cmd1 and, if specified, _config_cmd2. An e-mail message is sent with the results of the CLI command.
The following sample configuration demonstrates how to use this policy. Starting in user EXEC mode, enter the enable command at the router prompt. The router enters privileged EXEC mode, where you can enter the show event manager policy registered command to verify that no policies are currently registered. The next command is the show event manager policy available command to display which policies are available to be installed. After you enter the configure terminal command to reach global configuration mode, you can register the sl_intf_down.tcl policy with EEM using the event manager policy command. Exit from global configuration mode and enter the show event manager policy registered command again to verify that the policy has been registered.
The policy will run when an interface goes down. Enter the show event manager environment command to display the current environment variable values. Unplug the cable for the interface specified in the _syslog_pattern EEM environment variable. The interface goes down, prompting the syslog daemon to log a syslog message about the interface being down, and the syslog event detector is called. The syslog event detector reviews the outstanding event specifications and finds a match for the interface process crash. The EEM server is notified, and the server runs the policy that is registered to handle this event—sl_intf_down.tcl.
enableshow event manager policy registeredshow event manager policy availableconfig terminalevent manager policy sl_intf_down.tclendshow event manager policy registeredshow event manager environmentRunning the tm_cli_cmd.tcl Sample Policy
This sample policy demonstrates the ability to periodically execute a CLI command and to e-mail the results. The CRON specification "0-59/2 0-23/1 * * 0-7" will cause this policy to be run every other minute. The policy gathers detailed information about the event and uses the CLI library to execute the configuration commands specified in the EEM environment variable _show_cmd. An e-mail message is sent with the results of the CLI command.
The following sample configuration demonstrates how to use this policy. Starting in user EXEC mode, enter the enable command at the router prompt. The router enters privileged EXEC mode where you can enter the show event manager policy registered command to verify that no policies are currently registered. The next command is the show event manager policy available command to display which policies are available to be installed. After entering the configure terminal command to reach global configuration mode, the tm_cli_cmd.tcl policy can be registered with EEM using the event manager policy command. Exit from global configuration mode and enter the show event manager policy registered command to verify that the policy has been registered.
The timer event detector triggers an event for this case periodically according to the CRON string set in the EEM environment variable _cron_entry. The EEM server is notified and the server runs the policy that is registered to handle this event—tm_cli_cmd.tcl.
enableshow event manager policy registeredshow event manager policy availableconfig terminalevent manager policy tm_cli_cmd.tclendshow event manager policy registeredRunning the tm_crash_reporter.tcl Sample Policy
This sample policy demonstrates the ability to send an HTTP-formatted crash report to a URL location. If the policy registration is saved in the startup configuration file, then the policy will be triggered 5 seconds after bootup. When triggered, the script will attempt to find the reload reason. If the reload reason was due to a crash, the policy will search for the related crashinfo file and send this information to a URL location specified by the user in the environment variable _crash_reporter_url. A cgi script, interface_tm.cgi, has been created to receive the URL from tm_crash_reporter.tcl policy and save the crash information in a local database on the target URL machine.
A Perl CGI script, interface_tm.cgi, has been created and is designed to run on a machine that contains an HTTP server and is accessible by the router running the tm_crash_reporter.tcl policy. The interface_tm.cgi script parses the data passed into it from tm_crash_reporter.tcl and appends the crash information to a text file, creating a history of all crashes in the system. Additionally, detailed information on each crash is stored in three files in a crash database directory that is specified by the user. Another Perl CGI script, crash_report_display.cgi, has been created to display the information stored in the database created by the interface_tm.cgi script. The crash_report_display.cgi script should be placed on the same machine that contains interface_tm.cgi. The machine should be running a web browser such as Internet Explorer or Netscape. When the crash_report_display.cgi script is run, it will display the crash information in a readable format.
The following sample configuration demonstrates how to use this policy. Starting in user EXEC mode, enter the enable command at the router prompt. The router enters privileged EXEC mode where you can enter the show event manager policy registered command to verify that no policies are currently registered. The next command is the show event manager policy available command to display which policies are available to be installed. After entering the configure terminal command to reach global configuration mode, the tm_crash_reporter.tcl policy can be registered with EEM using the event manager policy command. Exit from global configuration mode and enter the show event manager policy registered command to verify that the policy has been registered.
enableshow event manager policy registeredshow event manager policy availableconfigure terminalevent manager policy tm_crash_reporter.tclexitshow event manager policy registeredWhere to Go Next
For more details about other network management technologies, see the Cisco IOS Network Management Configuration Guide, Release 12.4.
Additional References
The following sections provide references related to Embedded Event Manager 2.2.
Related Documents
EEM commands: complete command syntax, defaults, command mode, command history, usage guidelines, and examples
Cisco IOS Network Management Command Reference, Release 12.4
Embedded Event Manager policy writing using Tcl
Embedded Resource Manager
"Embedded Resource Manager" module
Configuring enhanced object tracking
CNS event agent
CNS Event Agent feature document, Release 12.2(2)T
CNS Configuration Engine
Cisco CNS Configuration Registrar: Installing and Configuring the IE2100
Standards
No new or modified standards are supported by this feature, and support for existing standards has not been modified by this feature.
—
MIBs
CISCO-EMBEDDED-EVENT-MGR-MIB
To locate and download MIBs for selected platforms, Cisco IOS releases, and feature sets, use Cisco MIB Locator found at the following URL:
RFCs
No new or modified RFCs are supported by this feature, and support for existing RFCs has not been modified by this feature.
—
Technical Assistance
Command Reference
This section documents new and modified commands only.
New Commands
Modified Commands
action track read
To specify the action of reading the state of a tracked object when an Embedded Event Manager (EEM) applet is triggered, use the action track read command in applet configuration mode. To remove the action track read command from the configuration, use the no form of this command.
action label track read object-number
no action label track read object-number
Syntax Description
Command Default
The state of a tracked object is not read.
Command Modes
Applet configuration
Command History
Usage Guidelines
This command generates the following result variable:
_track_state—State of the specified tracked object. The text string returned is either up or down. If the state is up, it means that the object exists and is in an up state. If the state is down, it means that the object either does not exist or is in a down state.
This command is used to help track objects using EEM. Each tracked object is identified by a unique number that is specified on the tracking command-line interface (CLI). Client processes such as EEM use this number to track a specific object. The tracking process periodically polls the tracked objects and notes any change of value. The changes in the tracked object are communicated to interested client processes, either immediately or after a specified delay. The object values are reported as either up or down. The enhanced object tracking event detector publishes an EEM event when the tracked object changes.
Examples
The following example shows how to specify event criteria based on a tracked object:
event manager applet track-tenevent track 10 state anyaction 1.0 track set 10 state upaction 2.0 track read 10Related Commands
action track set
To specify the action of setting the state of a tracked object when an Embedded Event Manager (EEM) applet is triggered, use the action track set command in applet configuration mode. To remove the action track set command from the configuration, use the no form of this command.
action label track set object-number state {up | down}
no action label track set object-number state {up | down}
Syntax Description
Command Default
The state of a tracked object is not set.
Command Modes
Applet configuration
Command History
Usage Guidelines
This command generates the following result variable:
•
This command is used to help track objects using EEM. Each tracked object is identified by a unique number that is specified on the tracking command-line interface (CLI). Client processes such as EEM use this number to track a specific object. The tracking process periodically polls the tracked objects and notes any change of value. The changes in the tracked object are communicated to interested client processes, either immediately or after a specified delay. The object values are reported as either up or down. The enhanced object tracking event detector publishes an EEM event when the tracked object changes.
Examples
The following example shows how to specify event criteria based on a tracked object:
event manager applet track-tenevent track 10 state anyaction 1.0 track set 10 state upaction 2.0 track read 10Related Commands
default-state
To set the default state for a stub object, use the default-state command in tracking configuration mode. To reset the default state to its internal default state, use the no form of this command.
default-state {up | down}
no default-state {up | down}
Syntax Description
up
Sets the current default state of a stub object to up.
down
Sets the current default state of a stub object to down.
Command Default
Internal default state is the default.
Command Modes
Tracking configuration
Command History
Usage Guidelines
Use the default-state command to set the default state of a stub object that has been created by the track stub command. The stub object can be tracked and manipulated by an external process, Embedded Event Manager (EEM).
EEM is a distributed, scalable, and customized approach to event detection and recovery offered directly in a Cisco IOS device. EEM offers the ability to monitor events and take informational or corrective action when the monitored events occur or when a threshold is reached. An EEM policy is an entity that defines an event and the actions to be taken when that event occurs.
Examples
The following example shows how to create a stub object and configure a default state for the stub object:
track 2 stubdefault-state upRelated Commands
show track
Displays tracking information.
track stub
Creates a stub object to be tracked.
event resource
To specify the event criteria for an Embedded Event Manager (EEM) applet that is run on the basis of an Embedded Resource Manager (ERM) event report for a specified policy, use the event resource command in applet configuration mode. To remove the report event criteria, use the no form of this command.
event [label] resource policy policy-filename
no event [label] resource policy policy-filename
Syntax Description
Command Default
No EEM event criteria are specified.
Command Modes
Applet configuration
Command History
Usage Guidelines
The resource event detector publishes an event when the ERM reports an event for the specified policy. The ERM infrastructure tracks resource depletion and resource dependencies across processes and within a system to handle various error conditions. The error conditions are handled by providing an equitable sharing of resources between various applications. The ERM framework provides a communication mechanism for resource entities and allows communication between these resource entities from numerous locations. The ERM framework also helps in debugging the CPU and memory- related issues. The ERM monitors system resource usage to better understand scalability needs by allowing you to configure threshold values for resources such as CPU, buffer, and memory.
Examples
The following example shows how to specify event criteria based on an ERM event report for a policy defined to report high CPU usage:
event manager applet policy-oneevent resource policy cpu-highaction 1.0 syslog msg "CPU high at $_resource_current_value percent"Related Commands
event manager applet
Registers an event applet with the Embedded Event Manager and enters applet configuration mode.
event rf
To specify the event criteria for an Embedded Event Manager (EEM) applet that is run on the basis of Redundancy Framework (RF) state change notifications, use the event rf command in applet configuration mode. To remove the RF event criteria, use the no form of this command.
event rf event rf-state-name
no event rf event rf-state-name
Syntax Description
Command Default
No EEM events are triggered.
Command Modes
Applet configuration
Command History
Usage Guidelines
An EEM event is triggered when the expression in the rf-state-name argument matches an RF state change notification. The RF event detector publishes an event when one or more RF events occur during synchronization in a dual Route Processor (RP) system.
Examples
The following example shows how to specify event criteria based on an RF state change notification:
event manager applet start-rfevent rf event rf_prog_initializationaction 1.0 syslog msg "rf state rf_prog_initialization reached"Related Commands
event manager applet
Registers an event applet with the Embedded Event Manager and enters applet configuration mode.
event track
To specify the event criteria for an Embedded Event Manager (EEM) applet that is run on the basis of a Cisco IOS Object Tracking subsystem report for the specified object number, use the event track command in applet configuration mode. To remove the report event criteria, use the no form of this command.
event [label] track object-number [state {up | down | any}]
no event [label] track object-number [state {up | down | any}]
Syntax Description
Command Default
No EEM event criteria are specified.
Command Modes
Applet configuration
Command History
Usage Guidelines
There are two entry variables associated with this command:
•
•
This command is used to help track objects using EEM. Each tracked object is identified by a unique number that is specified on the tracking command-line interface (CLI). Client processes such as EEM use this number to track a specific object. The tracking process periodically polls the tracked objects and notes any change of value. The changes in the tracked object are communicated to interested client processes, either immediately or after a specified delay. The object values are reported as either up or down.
Examples
The following example shows how to specify event criteria based on a tracked object:
event manager applet track-tenevent track 10 state anyaction 1.0 track set 10 state upaction 2.0 track read 10Related Commands
show track
To display information about objects that are tracked by the tracking process, use the show track command in privileged EXEC mode.
show track [object-number [brief] | interface [brief] | ip route [brief] | resolution | timers]
Syntax Description
Command Modes
Privileged EXEC
Command History
12.2(15)T
This command was introduced.
12.3(8)T
The output was enhanced to include the track-list objects.
12.4(2)T
The output was enhanced to display stub objects.
Usage Guidelines
Use this command to display information about objects that are tracked by the tracking process. When no arguments or keywords are specified, information for all objects is displayed.
Examples
The following example shows information about the state of IP routing on the interface that is being tracked:
Router# show track 1Track 1Interface Ethernet0/2 ip routingIP routing is Down (no IP addr)1 change, last change 00:01:08Tracked by:HSRP Ethernet0/3 1The following example shows information about the line-protocol state on the interface that is being tracked:
Router# show track 1Track 1Interface Ethernet0/1 line-protocolLine protocol is Up1 change, last change 00:00:05Tracked by:HSRP Ethernet0/3 1The following example shows information about the reachability of a route that is being tracked:
Router# show track 1Track 1IP route 10.16.0.0 255.255.0.0 reachabilityReachability is Up (RIP)1 change, last change 00:02:04First-hop interface is Ethernet0/1Tracked by:HSRP Ethernet0/3 1The following example shows information about the threshold metric of a route that is being tracked:
Router# show track 1Track 1IP route 10.16.0.0 255.255.0.0 metric thresholdMetric threshold is Up (RIP/6/102)1 change, last change 00:00:08Metric threshold down 255 up 254First-hop interface is Ethernet0/1Tracked by:HSRP Ethernet0/3 1The following example shows the object type, the interval in which it is polled, and the time until the next poll:
Router# show track timersObject type Poll Interval Time to next pollinterface 1 expiredip route 30 29.364Table 7 describes the significant fields shown in the displays.
The following output shows that there are two objects. Object 1 has been configured with a weight of 10 "down," and object 2 has been configured with a weight of 20 "up." Object 1 is down (expressed as 0/10) and object 2 is up. The total weight of the tracked list is 20 with a maximum of 30 (expressed as 20/30). The "up" threshold is 20, so the list is "up."
Router# show trackTrack 6List threshold weightThreshold weight is Up (20/30)1 change, last change 00:00:08object 1 Down (0/10)object 2 weight 20 Up (20/30)Threshold weight down 10 up 20Tracked by:HSRP Ethernet0/3 1The following example shows information about the Boolean configuration:
Router# show trackTrack 3List boolean andBoolean AND is Down1 change, last change 00:00:08object 1 not Upobject 2 DownTracked by:HSRP Ethernet0/3 1Table 8 describes the significant fields shown in the displays.
The following example shows information about a stub object that has been created to be tracked using Embedded Event Manager (EEM):
Router# show trackTrack 1Stub-objectState is Up1 change, last change 00:00:04, by UndefinedThe following example shows information about a stub object when the brief keyword is used:
Router# show track briefTrack Object Parameter Value Last Change1 Stub-object Undefined Up 00:00:12Table 9 describes the significant fields shown in the displays.
Related Commands
track stub
To create a stub object that can be tracked by Embedded Event Manager (EEM) and to enter tracking configuration mode, use the track stub command in global configuration mode. To remove the stub object, use the no form of this command.
track object-number stub
no track object-number stub
Syntax Description
Command Default
No stub objects are created.
Command Modes
Global configuration
Command History
Usage Guidelines
Use the track stub command to create a stub object, which is an object that can be tracked and manipulated by an external process, EEM. After the stub object is created, the default-state command can be used to set the default state of the stub object.
EEM is a distributed, scalable, and customized approach to event detection and recovery offered directly in a Cisco IOS device. EEM offers the ability to monitor events and take informational or corrective action when the monitored events occur or when a threshold is reached. An EEM policy is an entity that defines an event and the actions to be taken when that event occurs.
Examples
In the following example, stub object 1 is created and configured with a default state of up.
track 1 stubdefault-state upRelated Commands
default-state
Sets the default state for a stub object.
show track
Displays tracking information.
© 2005 Cisco Systems, Inc. All rights reserved.