
 Feedback
Contents
- mask (IPv4) through top
- mask (IPv4)
- mask
- match (NetFlow)
- mls aging fast
- mls aging long
- mls aging normal
- mls exclude acl-deny
- mls flow
- mls ip nat netflow-frag-l4-zero
- mls nde flow
- mls nde interface
- mls nde sender
- mls netflow
- mls netflow interface
- mls netflow maximum-flows
- mls netflow sampling
- mls netflow usage notify
- mls sampling
- mode (flow sampler configuration)
- mpls netflow egress
- netflow-sampler
- platform netflow rp sampling scale
- reliability (NetFlow SCTP)
- show flow-sampler
- show fm nat netflow data
- show fm netflow
- show ip cache flow
- show ip cache flow aggregation
- show ip cache verbose flow
- show ip cache verbose flow aggregation
- show ip flow export
- show ip flow top
- show ip flow top-talkers
- show mls ip non-static
- show mls ip routes
- show mls ip static
- show mls nde
- show mls netflow
- show mls netflow ip
- show mls netflow ipv6
- show mls netflow ip dynamic
- show mls netflow ip routes
- show mls netflow ip sw-installed
- show mls netflow ipx
- show mls sampling
- sort-by
- top
mask (IPv4) through top
mask (IPv4)
To specify the source or destination prefix mask for a NetFlow accounting prefix aggregation cache, use the maskcommand in aggregation cache configuration mode. To disable the source or destination mask, use the no form of this command.
Command History
|
Release |
Modification |
|---|---|
|
12.1(2)T |
This command was introduced. |
|
12.2(14)S |
This command was integrated into Cisco IOS Release 12.2(14)S. |
|
12.2(27)SBC |
This command was integrated into Cisco IOS Release 12.2(27)SBC. |
|
12.2(18)SXF |
This command was integrated into Cisco IOS Release 12.2(18)SXF. |
|
12.2(33)SRA |
This command was integrated into Cisco IOS Release 12.2(33)SRA. |
Usage Guidelines
You must have NetFlow accounting configured on your router before you can use this command.
The NetFlow accounting minimum prefix mask allows you to set a minimum mask size for the traffic that will be added to the NetFlow aggregation cache. The source or destination IP address (depending on the type of aggregation cache that you are configuring) is ANDed with the larger of the two masks (the mask that you enter with the mask command and the mask in the IP routing table) to determine if the traffic should be added to the aggregation cache that you are configuring.
To enable the minimum prefix mask for a particular aggregation cache, configure the desired minimum mask value using the NetFlow aggregation cache commands. The minimum mask value in the range of 1-32 is used by the router defines the granularity of the NetFlow data that is collected:
- For coarse NetFlow collection granularity, select a low minimum mask value.
- For fine NetFlow collection granularity, select a high minimum mask value.
Specifying the minimum value for the source or destination mask of a NetFlow accounting aggregation cache is permitted only for the following NetFlow aggregation cache types:
- Destination prefix aggregation (destination mask only)
- Destination prefix TOS aggregation (destination mask only)
- Prefix aggregation (source and destination mask)
- Prefix-port aggregation (source and destination mask)
- Prefix-TOS aggregation (source and destination mask)
- Source prefix aggregation (source mask only)
- Source prefix TOS aggregation (source mask only)
mask source
The following example shows how to configure the source-prefix aggregation cache:
Router(config)# ip flow-aggregation cache source-prefix
Router(config-flow-cache)# enable
The following output from the show ip cache flow aggregation source-prefix command shows that, with no minimum mask configured, nine flows are included in the NetFlow source prefix aggregation cache:
Router# show ip cache flow aggregation source-prefix
IP Flow Switching Cache, 278544 bytes
  9 active, 4087 inactive, 18 added
  950 ager polls, 0 flow alloc failures
  Active flows timeout in 30 minutes
  Inactive flows timeout in 15 seconds
IP Sub Flow Cache, 21640 bytes
  9 active, 1015 inactive, 18 added, 18 added to flow
  0 alloc failures, 0 force free
  1 chunk, 1 chunk added
Src If         Src Prefix      Msk  AS    Flows  Pkts B/Pk  Active
Et0/0.1        10.10.10.0      /24  0        4   668   762   179.9
Et0/0.1        10.10.10.0      /24  0        4   668   762   180.8
Et0/0.1        10.10.11.0      /24  0        4   668  1115   180.9
Et0/0.1        10.10.11.0      /24  0        4   668  1115   181.9
Et0/0.1        10.1.0.0        /16  0        4   668  1140   179.9
Et0/0.1        10.1.0.0        /16  0        4   668  1140   179.9
Et0/0.1        172.16.6.0      /24  0        1     6    52   138.4
Et0/0.1        172.16.1.0      /24  0        8  1338  1140   182.1
Et0/0.1        172.16.1.0      /24  0        8  1339  1140   181.0
Router#
The following example shows how to configure the source-prefix aggregation cache using a minimum source mask of 8:
Router(config)# ip flow-aggregation cache source-prefix
Router(config-flow-cache)# mask source minimum 8
Router(config-flow-cache)# enable
The following output from the show ip cache flow aggregation source-prefix command shows that with a minimum mask of 8 configured, only five flows from the same traffic used in the previous example are included in the NetFlow source prefix aggregation cache:
Router# show ip cache flow aggregation source-prefix
IP Flow Switching Cache, 278544 bytes
  5 active, 4091 inactive, 41 added
  3021 ager polls, 0 flow alloc failures
  Active flows timeout in 30 minutes
  Inactive flows timeout in 15 seconds
IP Sub Flow Cache, 21640 bytes
  5 active, 1019 inactive, 59 added, 59 added to flow
  0 alloc failures, 0 force free
  1 chunk, 7 chunks added
Minimum source mask is configured to /8
Src If         Src Prefix      Msk  AS    Flows  Pkts B/Pk  Active
Et0/0.1        10.0.0.0        /8   0       12   681  1007    64.8
Et0/0.1        172.16.6.0      /24  0        1     3    52    56.1
Et0/0.1        10.0.0.0        /8   0       12   683  1006    64.8
Et0/0.1        172.16.1.0      /24  0        8   450  1140    61.8
Et0/0.1        172.16.1.0      /24  0        8   448  1140    61.5
Router#
mask destination
The following example shows how to configure the destination-prefix aggregation cache:
Router(config)# ip flow-aggregation cache destination-prefix
Router(config-flow-cache)# enable
The following output from the show ip cache flow aggregation destination-prefix command shows that, with no minimum mask configured, only two flows are included in the NetFlow source prefix aggregation cache:
Router# show ip cache flow aggregation destination-prefix
IP Flow Switching Cache, 278544 bytes
  3 active, 4093 inactive, 3 added
  4841 ager polls, 0 flow alloc failures
  Active flows timeout in 30 minutes
  Inactive flows timeout in 15 seconds
IP Sub Flow Cache, 21640 bytes
  3 active, 1021 inactive, 9 added, 9 added to flow
  0 alloc failures, 0 force free
  1 chunk, 1 chunk added
Dst If         Dst Prefix      Msk  AS    Flows  Pkts B/Pk  Active
Et1/0.1        172.16.10.0     /24  0      120  6737  1059   371.0
Et1/0.1        172.16.10.0     /24  0      120  6739  1059   370.9
The following example shows how to configure the destination-prefix aggregation cache using a minimum source mask of 32:
Router(config)# ip flow-aggregation cache destination-prefix
Router(config-flow-cache)# mask source minimum 32
Router(config-flow-cache)# enable
The following output from the show ip cache flow aggregation destination-prefix command shows that, with a minimum mask of 32 configured, 20 flows from the same traffic used in the previous example are included in the NetFlow source prefix aggregation cache:
Router# show ip cache flow aggregation destination-prefix
IP Flow Switching Cache, 278544 bytes
  20 active, 4076 inactive, 23 added
  4984 ager polls, 0 flow alloc failures
  Active flows timeout in 30 minutes
  Inactive flows timeout in 15 seconds
IP Sub Flow Cache, 21640 bytes
  20 active, 1004 inactive, 29 added, 29 added to flow
  0 alloc failures, 0 force free
  1 chunk, 2 chunks added
Minimum destination mask is configured to /32
Dst If         Dst Prefix      Msk  AS    Flows  Pkts B/Pk  Active
Et1/0.1        172.16.10.12    /32  0        1    57  1140    60.6
Et1/0.1        172.16.10.12    /32  0        1    57  1140    60.6
Et1/0.1        172.16.10.14    /32  0        1    57  1140    60.6
Et1/0.1        172.16.10.9     /32  0        1    57  1140    60.6
Et1/0.1        172.16.10.11    /32  0        1    57  1140    60.6
Et1/0.1        172.16.10.10    /32  0        1    57  1140    60.6
Et1/0.1        172.16.10.11    /32  0        1    57  1140    60.6
Et1/0.1        172.16.10.10    /32  0        1    57  1140    60.6
Et1/0.1        172.16.10.5     /32  0        1    56  1040    59.5
Et1/0.1        172.16.10.4     /32  0        1    56   940    59.5
Et1/0.1        172.16.10.4     /32  0        1    56   940    59.5
Et1/0.1        172.16.10.7     /32  0        1    57  1140    60.6
Et1/0.1        172.16.10.7     /32  0        1    57  1140    60.6
Et1/0.1        172.16.10.1     /32  0        1    56   628    59.5
Et1/0.1        172.16.10.2     /32  0        1    56   640    59.5
Et1/0.1        172.16.10.17    /32  0        1    56  1140    59.5
Et1/0.1        172.16.10.17    /32  0        1    56  1140    59.5
Et1/0.1        172.16.10.18    /32  0        1    56  1140    59.5
Et1/0.1        172.16.10.19    /32  0        1    56  1140    59.5
Et1/0.1        172.16.10.18    /32  0        1    56  1140    59.5
Related Commands
|
Command |
Description |
|---|---|
|
cache |
Defines operational parameters for NetFlow accounting aggregation caches. |
|
enabled (aggregation cache) |
Enables a NetFlow accounting aggregation cache. |
|
export destination (aggregation cache) |
Enables the exporting of NetFlow accounting information from NetFlow aggregation caches. |
|
ip flow-aggregation cache |
Enables NetFlow accounting aggregation cache schemes. |
|
show ip cache flow aggregation |
Displays the NetFlow accounting aggregation cache statistics. |
|
show ip cache flow |
Displays a summary of the NetFlow accounting statistics. |
|
show ip cache verbose flow |
Displays a detailed summary of the NetFlow accounting statistics. |
|
show ip flow interface |
Displays NetFlow accounting configuration for interfaces. |
mask
To specify the destination or source mask, use the maskcommand in aggregation cache configuration mode. To disable the destination mask, use the no form of this command.
Command History
|
Release |
Modification |
|---|---|
|
12.1(2)T |
This command was introduced. |
|
12.3(7)T |
Support was added for IPv6 source and destination addresses to be used for cache aggregation. |
|
12.2(30)S |
This command was integrated into Cisco IOS Release 12.2(30)S. |
|
12.2(33)SRA |
This command was integrated into Cisco IOS Release 12.2(33)SRA. |
|
12.2(33)SXH |
This command was integrated into Cisco IOS Release 12.2(33)SXH. |
Usage Guidelines
This command is only available with router-based aggregation. Minimum masking capability is not available if router-based aggregation is not enabled.
Examples
The following example shows how to configure the mask to use the destination-prefix as the aggregation cache scheme with a minimum mask value of 32:
Router(config)# ipv6 flow-aggregation cache destination-prefix
Router(config-flow-cache)# mask destination minimum 32
Related Commands
|
Command |
Description |
|---|---|
|
ip flow-aggregation cache |
Enables aggregation cache configuration mode. |
|
ipv6 flow-aggregation cache |
Enables aggregation cache configuration mode for IPv6 traffic. |
|
show ip cache flow aggregation |
Displays the aggregation cache configuration. |
|
show ipv6 cache flow aggregation |
Displays the aggregation cache configuration for IPv6 NetFlow configurations. |
match (NetFlow)
To specify match criteria for the NetFlow top talkers (unaggregated top flows), use the match command in NetFlow top talkers configuration mode. To remove match criteria for NetFlow top talkers, use the no form of this command.
Syntax Description
|
byte-range |
The match criterion is based on the size in bytes of the IP datagrams in the flows. |
|
max-byte-number min-byte-number |
Range of sizes for IP datagrams to be matched in bytes. Range: 1-4294967295. |
|
max max-byte-number |
Maximum size for IP datagrams to be matched in bytes. Range: 1-4294967295. |
|
min min-byte-number |
Minimum size for IP datagrams to be matched in bytes. Range: 1-4294967295. |
|
class-map |
The match criterion is based on a class map. |
|
map-name |
Name of the class map to be matched. |
|
destination address |
The match criterion is based on the destination IP address. |
|
ip-address |
The destination IP address to be matched. |
|
mask |
Address mask, in dotted decimal format. |
|
/nn |
Address mask as entered in classless interdomain routing (CIDR) format. An address mask of 255.255.255.0 is equivalent to a /24 mask in CIDR format. |
|
destination as |
The match criterion is based on the destination autonomous system. |
|
as-number |
Autonomous system number to be matched. |
|
destination port |
The match criterion is based on the destination port. |
|
max-port-number min-port-number |
Range of port numbers for IP datagrams to be matched. Range: 0-65535. |
|
max max-port-number |
Maximum port number for IP datagrams to be matched. Range: 0-65535. |
|
min min-port-number |
Minimum port number for IP datagrams to be matched. Range: 0-65535. |
|
direction |
Direction of the flow to be matched. |
|
ingress |
The match criterion is based on ingress flows. |
|
egress |
The match criterion is based on egress flows. |
|
flow-sampler |
The match criterion is based on Top Talker sampling. |
|
flow-sampler-name |
Name of the Top Talker sampler to be matched. |
|
input-interface |
The match criterion is based on the input interface. |
|
interface-type interface-number |
The input interface to be used |
|
nexthop address |
The match criterion is based on the next-hop IP address. |
|
ip-address |
The next-hop IP address to be matched. |
|
mask |
Address mask, in dotted decimal format. |
|
/nn |
Address mask as entered in classless interdomain routing (CIDR) format. An address mask of 255.255.255.0 is equivalent to a /24 mask in CIDR format. |
|
output-interface |
The match criterion is based on the output interface. |
|
interface-type interface-number |
The output interface to be used |
|
packet-range |
The match criterion is based on the number of IP datagrams in the flows. |
|
max-packets min-packets |
Range of number of packets in the flows to be matched. Range: 1-4294967295. |
|
max max-packet |
Maximum number of packets in the flows to be matched. Range: 1-4294967295. |
|
min min-packets |
Minimum number of packets in the flows to be matched. Range: 1-4294967295. |
|
protocol |
The match criterion is based on protocol. |
|
protocol-number |
Protocol number to be matched. Range: 0 to 255. |
|
tcp |
Protocol number to be matched as TCP. |
|
udp |
Protocol number to be matched as UDP. |
|
source address |
The match criterion is based on the source IP address. |
|
ip-address |
The source IP address to be matched. |
|
mask |
Address mask, in dotted decimal format. |
|
/nn |
Address mask as entered in classless interdomain routing (CIDR) format. An address mask of 255.255.255.0 is equivalent to a /24 mask in CIDR format. |
|
source as |
The match criterion is based on the source autonomous system. |
|
as-number |
Autonomous system number to be matched. |
|
source port |
The match criterion is based on the source port. |
|
max-port-number min-port-number |
Range of port numbers for IP datagrams to be matched. Range: 0-65535. |
|
max max-port-number |
Maximum port number for IP datagrams to be matched. Range: 0-65535. |
|
min min-port-number |
Minimum port number for IP datagrams to be matched. Range: 0-65535. |
|
tos |
The match criterion is based on type of service (ToS). |
|
tos-value |
ToS to be matched. |
|
dscp dscp-value |
Differentiated services code point (DSCP) value to be matched. |
|
precedence precedence-value |
Precedence value to be matched. |
Command History
|
Release |
Modification |
|---|---|
|
12.2(25)S |
This command was introduced. |
|
12.3(11)T |
This command was integrated into Cisco IOS Release 12.3(11)T. The direction, ingress,and egresskeywords were added. |
|
12.2(27)SBC |
This command was integrated into Cisco IOS Release 12.2(27)SBC |
|
12.2(33)SRA |
This command was integrated into Cisco IOS Release 12.2(33)SRA. |
|
12.2SX |
This command is supported in the Cisco IOS Release 12.2SX train. Support in a specific 12.2SX release of this train depends on your feature set, platform, and platform hardware. |
Usage Guidelines
Configuring NetFlow Top Talkers
You must enable NetFlow on at least one interface in the router; and configure NetFlow top talkers before you can use the show ip flow top-talkers command to display the traffic statistics for the unaggregated top flows in the network. NetFlow top talkers also requires that you configure the sort-by and top commands.
Specifying Match Criteria
Use this command to specify match criteria for NetFlow top talkers. Using matching criteria is useful to restrict the list of top talkers.
If you are using a MIB and using simple network management protocol (SNMP) commands to configure this feature, refer to the table below for a mapping of the command-line interface (CLI) commands to the MIB SNMP commands:
| Table 1 | Router CLI Commands and Equivalent SNMP Commands |
|
Router CLI Command |
SNMP Command |
|---|---|
|
match source address [ip-address][mask | / nn] |
cnfTopFlowsMatchSrcAddress ip-address cnfTopFlowsMatchSrcAddressType type 1 cnfTopFlowsMatchSrcAddressMask mask |
|
match destination address [ip-address][mask | / nn] |
cnfTopFlowsMatchDstAddress ip-address cnfTopFlowsMatchDstAddressType type 1 cnfTopFlowsMatchDstAddressMask mask |
|
match nexthop address ][ip-address][mask | / nn]] |
cnfTopFlowsMatchNhAddress ip-address cnfTopFlowsMatchNhAddressType type cnfTopFlowsMatchNhAddressMask mask |
|
match source port min port |
cnfTopFlowsMatchSrcPortLo port |
|
match source port max port |
cnfTopFlowsMatchSrcPortHi port |
|
match destination port min port |
cnfTopFlowsMatchDstPortLo port |
|
match destination port max port |
cnfTopFlowsMatchDstPortHi port |
|
match source as as-number |
cnfTopFlowsMatchSrcAS as-number |
|
match destination as as-number |
cnfTopFlowsMatchDstAS as-number |
|
match input-interface interface |
cnfTopFlowsMatchInputIf interface |
|
match output-interface interface |
cnfTopFlowsMatchOutputIf interface |
|
match tos [tos-value| dscp dscp-value | precedence precedence-value] |
cnfTopFlowsMatchTOSByte tos-value |
|
match protocol [protocol-number | tcp | udp] |
cnfTopFlowsMatchProtocol protocol-number |
|
match flow-sampler flow-sampler-name |
cnfTopFlowsMatchSampler flow-sampler-name |
|
match class-map class |
cnfTopFlowsMatchClass class |
|
match packet-range min minimum-range |
cnfTopFlowsMatchMinPackets minimum-range |
|
match packet-range max maximum-range |
cnfTopFlowsMatchMaxPackets maximum-range |
|
match byte-range min minimum-range |
cnfTopFlowsMatchMinBytes minimum-range |
|
match byte-range max maximum-range |
cnfTopFlowsMatchMaxPackets maximum-range |
|
direction [ingress | egress] |
cnfTopFlowsMatchDirection [flowDirNone(0) | flowDirIngress(1) | flowDirEgress(2)] |
Examples
The following example shows how you enter NetFlow top talkers configuration mode and specify that the top talkers are to contain the following characteristics:
- The list of top talkers will have a source IP address that begins with 10.10.0.0 and subnet a mask of 255.255.0.0 (/16).
Router(config)# ip flow-top-talkers
Router(config-flow-top-talkers)# match source address 10.10.0.0/16
Router(config-flow-top-talkers)# top 4
Router(config-flow-top-talkers)# sort-by bytes
The following example shows the output of the show ip flow top talkers command when the configuration from the previous example is used:
Router# show ip flow top-talkers

SrcIf         SrcIPaddress    DstIf         DstIPaddress    Pr SrcP DstP Bytes
Et2/0         10.10.11.3      Et1/0.1       172.16.10.7     06 0041 0041    30K
Et0/0.1       10.10.11.4      Et1/0.1       172.16.10.8     06 0041 0041    30K
Et3/0         10.10.11.2      Et1/0.1       172.16.10.6     06 0041 0041    29K
Et3/0         10.10.18.1      Null          172.16.11.5     11 00A1 00A1    28K
4 of 4 top talkers shown. 10 of 27 flows matched
The following example shows how you enter NetFlow top talkers configuration mode and specify that the top talkers are to contain the following characteristics:
- The list of top talkers will have a source IP address that begins with 10.10.0.0 and subnet mask of 255.255.0.0 (/16).
- The list of top talkers will have a destination IP address that begins with 172.16.11.0 and a subnet mask of 255.255.255.0 (/24)
Router(config)# ip flow-top-talkers
Router(config-flow-top-talkers)# match source address 10.10.0.0/16
Router(config-flow-top-talkers)# match destination address 172.16.11.0/24
Router(config-flow-top-talkers)# top 4
Router(config-flow-top-talkers)# sort-by bytes
The following example shows the output of the show ip flow top talkers command when the configuration from the previous example is used:
Router# show ip flow top-talkers

SrcIf         SrcIPaddress    DstIf         DstIPaddress    Pr SrcP DstP Bytes
Et3/0         10.10.18.1      Null          172.16.11.5     11 00A1 00A1    67K
Et3/0         10.10.19.1      Null          172.16.11.6     11 00A2 00A2    67K
2 of 4 top talkers shown. 2 of 30 flows matched
Related Commands
|
Command |
Description |
|---|---|
|
cache-timeout |
Specifies the length of time for which the list of top talkers (heaviest traffic patterns and most-used applications in the network) for the NetFlow MIB and top talkers feature is retained. |
|
ip flow-top-talkers |
Enters the configuration mode for the NetFlow MIB and top talkers (heaviest traffic patterns and most-used applications in the network) feature. |
|
show ip cache flow |
Displays a summary of the NetFlow accounting statistics. |
|
show ip cache verbose flow |
Displays a detailed summary of the NetFlow accounting statistics. |
|
show ip flow interface |
Displays NetFlow accounting configuration for interfaces. |
|
show ip flow top-talkers |
Displays the statistics for the top talkers (heaviest traffic patterns and most-used applications in the network). |
|
sort-by |
Specifies the sorting criterion for top talkers (heaviest traffic patterns and most-used applications in the network) to be displayed for the NetFlow MIB and top talkers feature. |
|
top |
Specifies the maximum number of top talkers (heaviest traffic patterns and most-used applications in the network) to be displayed for the NetFlow MIB and top talkers feature. |
mls aging fast
To configure the fast-aging time for unicast entries in the Layer 3 table, use the mls aging fastcommand in global configuration mode. To restore the MLS fast-aging time to the default settings, use the no form of this command.
Command Default
The defaults are as follows:
- Fast aging is disabled.
- If fast aging is enabled, the default packet-count value is 100 packets and the secondsdefault is 32 seconds.
Usage Guidelines
This command has no effect when you configure sampled NetFlow. You must disable sampled NetFlow to allow this command to take effect.
mls aging long
To configure the long-aging time for unicast entries in the Layer 3 table, use the mls aging longcommand in global configuration mode. To restore the MLS long-aging time to the default settings, use the no form of this command.
Usage Guidelines
This command has no effect when you configure sampled NetFlow. You must disable sampled NetFlow to allow this command to take effect.
mls aging normal
To configure the normal-aging time for unicast entries in the Layer 3 table, use the mls aging normalcommand in global configuration mode. To restore the MLS normal-aging time to the default settings, use the no form of this command.
Usage Guidelines
This command has no effect when you configure sampled NetFlow. You must disable sampled NetFlow to allow this command to take effect.
mls exclude acl-deny
To disable the creation of NetFlow entries for ingress ACL denied flows, use the mls exclude acl-denycommand in global configuration mode. To disable the creation of NetFlow entries for ACL denied flows, use the no form of this command.
mls flow
To configure the flow mask for NDE, use the mls flow command in global configuration mode. To specify a null flow mask, use the no form of this command. To restore the default flow mask, use the default form of this command.
Syntax Description
|
ip |
Enables the flow mask for MLS IP packets. |
|
ipv6 |
Enables the flow mask for MLS IPv6 packets. |
|
destination |
Uses the destination IP address as the key to the Layer 3 table. |
|
destination-source |
Uses the destination and the source IP address as the key to the Layer 3 table. |
|
full |
Uses the source and destination IP address, the IP protocol (UDP or TCP), and the source and destination port numbers as the keys to the Layer 3 table. |
|
interface-destination-source |
Uses all the information in the destination and source flow mask and the source VLAN number as the keys to the Layer 3 table. |
|
interface-full |
Uses all the information in the full flow mask and the source VLAN number as the keys to the Layer 3 table. |
|
source |
Uses the source IP address as the key to the Layer 3 table. |
Command Default
The defaults are as follows:
- For Cisco 7600 series routers that are configured with a Supervisor Engine 2, the default flow mask is destination.
- For Cisco 7600 series routers that are configured with a Supervisor Engine 720, the default flow mask is null.
- For IPv4, the default flow mask is null.
- For IPv6, the default flow mask is null.
Command History
|
Release |
Modification |
|---|---|
|
12.2(14)SX |
Support for this command was introduced on the Supervisor Engine 720. |
|
12.2(17b)SXA |
This command was changed to support the ipv6 keyword. |
|
12.2(17d)SXB |
Support for this command on the Supervisor Engine 2 was extended to the 12.2 SX release. |
|
12.2(33)SRA |
This command was integrated into Cisco IOS Release 12.2(33)SRA. |
|
12.2(33)SRB |
This command was changed to accommodate per-interface NetFlow. |
Usage Guidelines
This command collects statistics for the supervisor engine.
In Cisco IOS Release 12.2(33)SRB and later, the interface-destination-source and interface-full flow masks are the only masks supported for IPv4 traffic. This change was made to accommodate the per-interface NetFlow feature. If other flow mask values are used, the router upgrades them as follows:
- Source, destination, and destination-source flow masks are treated as interface-destination-source.
- Full flow masks are treated as interface-full.
 Note | To ensure that the Optimized Edge Routing passive-monitoring feature can use NetFlow, you must change the IPv4 flow mask to interface-full. |
mls ip nat netflow-frag-l4-zero
To zero out the Layer 4 information in the NetFlow lookup table for fragmented packets, use the mls ip nat netflow-frag-l4-zero command in global configuration mode. To restore the default settings, use the no form of this command.
Usage Guidelines
This command is supported in PFC3BXL or PFC3B mode only.
Use the mls ip nat netflow-frag-l4-zero command to prevent matching the first fragment to the NetFlow shortcut (normal operation) that is sent to the software. The next fragments that are sent to the software are translated based on the Layer 4 port information from the first fragment. The translation based on the Layer 4 port information from the first fragment occurs because there are no fragment bits for matching in the NetFlow key.
When there is a large feature configuration on an interface that requires a large number of ACL TCAM entries/masks that are programmed in TCAM, if the interface is configured as a NAT-inside interface, the feature configuration may not fit in the ACL TCAM and the traffic on the interface may get switched in the software.
mls nde flow
To specify the filter options for NDE, use the mls nde flowcommand in global configuration mode. To clear the NDE flow filter and reset the filter to the default settings, use the no form of this command.
Syntax Description
|
include |
Allows exporting of all flows except the flows matching the given filter. |
|
exclude |
Allows exporting of all flows matching the given filter. |
|
dest-port port-num |
Specifies the destination port to filter; valid values are from 1 to 100. |
|
destination ip-addr ip-mask |
Specifies a destination IP address and mask to filter. |
|
protocol |
Specifies the protocol to include or exclude. |
|
tcp |
Includes or excludes TCP. |
|
udp |
Includes or excludes UDP. |
|
source ip-addr ip-mask |
Specifies a source IP address and subnet mask bit to filter. |
|
src-port port-num |
Specifies the source port to filter. |
Command Default
The defaults are as follows:
- All expired flows are exported until the filter is specified explicitly.
- Interface export is disabled (no mls nde interface).
Usage Guidelines
The mls nde flow command adds filtering to the NDE. The expired flows matching the specified criteria are exported. These values are stored in NVRAM and do not clear when NDE is disabled. If any option is not specified in this command, it is treated as a wildcard. The NDE filter in NVRAM does not clear when you disable NDE.
Only one filter can be active at a time. If you do not enter the exclude or include keyword, the filter is assumed to be an inclusion filter.
The include and exclude filters are stored in NVRAM and are not removed if you disable NDE.
ip-addr maskbits is the simplified long subnet address format. The mask bits specify the number of bits of the network masks. For example, 172.22.252.00/22 indicates a 22-bit subnet address. The ip-addr is a full host address, such as 193.22.253.1/22.
mls nde interface
To populate the additional fields in the NDE packets, use the mls nde interface command in interface configuration mode. To disable the population of the additional fields, use the no form of this command.
Command Default
The defaults are as follows:
- Supervisor Engine 2--Disabled
- Supervisor Engine 720--Enabled
Usage Guidelines
You can configure NDE to populate the following additional fields in the NDE packets:
- Egress interface SNMP index
- Source-autonomous system number
- Destination-autonomous system number
- IP address of the next-hop router
The ingress-interface SNMP index is always populated if the flow mask is interface-full or interface-src-dst.
For detailed information, refer to the " Configuring NDE " chapter of the Cisco 7600 Series Router Cisco IOS Software Configuration Guide .
mls nde sender
To enable MLS NDE export, use the mls nde sender command in global configuration mode. To disable MLS NDE export, use the no form of this command.
mls netflow
To enable NetFlow to gather statistics, use the mls netflow command in global configuration mode. To disable NetFlow from gathering statistics, use the no form of this command.
Syntax Description
|
interface |
(Optional) Specifies statistics gathering per interface. |
|
cache |
(Optional) Caches the total active flow count in the Policy Feature Card (PFC) or Distributed Forwarding Cards (DFCs). |
|
usage notify |
(Optional) Sends a notification when NetFlow table usage crosses the configured threshold limit. |
|
threshold |
(Optional) Threshold percentage. The range is from 20 to 100. |
|
seconds |
(Optional) Time interval in seconds. |
Command History
|
Release |
Modification |
|---|---|
|
12.2(14)SX |
This command was introduced on the Supervisor Engine 720. |
|
12.2(17d)SXB |
This command was integrated into Cisco IOS Release 12.2(17d)SXB. |
|
12.2(33)SRA |
This command was integrated into Cisco IOS Release 12.2(33)SRA. |
|
15.0(1)S1 |
This command was modified. The cache keyword was added. |
Usage Guidelines
NetFlow gathers statistics from traffic that flows through the Cisco 7600 series router and stores the statistics in the NetFlow table. You can gather the statistics globally based on a protocol or optionally per interface.
If you are not using NetFlow Data Export (NDE) or Cisco IOS features that use the hardware NetFlow table (non-Reverse Path Forwarding [non-RPF] multicast traffic, microflow quality of service [QoS], the Web Cache Communications Protocol [WCCP], TCP intercept, or reflexive access control lists), you can safely disable the use and maintenance of the hardware NetFlow table using the no mls netflow command in global configuration mode.
Use the cache keyword to enable NetFlow to cache the total active flow count in the PFC or DFC. If caching is disabled, the active flow count is retrieved from the router, which causes delay affecting Simple Network Management Protocol (SNMP)-based applications. When this option is enabled, the total active count in the PFC or DFC is cached every 30 seconds, and the cached value is used for statistics.
Examples
The following example shows how to enable NetFlow to gather statistics:
Router(config)#
 mls netflow
The following example shows how to disable NetFlow from gathering the statistics:
Router(config)# no mls netflow
Disabling MLS netflow entry creation.
The following example shows how to enable NetFlow to cache the total active flow count:
Router(config)#
 mls netflow cache
The following example shows how to set the threshold value for NetFlow table utilization:
Router(config)#
 mls netflow usage notify 75 500
mls netflow interface
To enable the creation of NetFlow entries on a per-VLAN basis, use the mls netflow interface command in global configuration mode. To disable the creation of NetFlow entries, use the no form of this command.
Usage Guidelines
Entering the mls netflow interface command creates NetFlow entries for all VLANs. NetFlow entries are created both for VLANs on which bridged-flow statistics is enabled and for VLANs on which NetFlow entry creation is enabled.
For example, if you enable Layer 3 per-VLAN entry creation on VLANs 100 and 200 and at the same time you want to enable bridged-flow statistics on VLANs 150 and 250, NetFlow entry creation and bridged-flow statistics are both enabled on all four VLANs. To collect only bridged-flow statistics for VLAN 150 and 250, you must disable the per-VLAN entry creation feature.
mls netflow maximum-flows
To configure the maximum flow allocation in the NetFlow table, use the mls netflow maximum-flowscommand in global configuration mode. To return to the default settings, use the no form of this command.
Usage Guidelines
This command is not supported on Cisco 7600 series routers that are configured with a Supervisor Engine 720.
The value that you specify for the maximum number of flows is that value times 1000. For example, if you enter 32, you specify that 32,000 is the maximum number of permitted flows.
mls netflow sampling
To enable sampled NetFlow on an interface, use the mls netflow sampling command in interface configuration mode. To disable sampled NetFlow on an interface, use the no form of this command.
Command History
|
Release |
Modification |
|---|---|
|
12.2(14)SX |
Support for this command was introduced on the Supervisor Engine 720. |
|
12.2(17d)SXB |
Support for this command on the Supervisor Engine 2 was extended to the 12.2 SX release. |
|
12.2(33)SRA |
This command was integrated into Cisco IOS Release 12.2(33)SRA. |
|
12.2(33)SRB |
This command was changed to support per-interface NetFlow for IPv4 traffic. |
Usage Guidelines
In Cisco IOS Release 12.2SRA and earlier, the sampled NetFlow can be global or per interface, depending on the current flow mask. For interface-full and interface-destination-source flow masks, sampled NetFlow is enabled on a per-interface basis. For all the other flow masks, sampled NetFlow is always global and is turned on or off for all interfaces.
Enter the mls sampling command to enable sampled NetFlow globally.
Cisco IOS Release 12.2(33)SRB and later support per-interface NetFlow for IPv4 traffic. Per-interface NetFlow has the following configuration requirements:
- In addition to issuing the mls sampling command (to globally enable NetFlow on the router), you must also issue the ip flow ingress and mls netflow sampling commands on individual interfaces to enable sampled NetFlow on the interface.
-
The only flow masks allowed for IPv4 traffic are interface-destination-source and interface-full. If other flow mask values are used, the router upgrades them as follows:
- Source, destination, and destination-source flow masks are treated as interface-destination-source.
- Full flow masks are treated as interface-full.
Note | In addition to populating the hardware NetFlow cache, the flow hardware mpls-vpn ipvrf-id command also enables sampled NetFlow for IPv4 traffic flows on an MPLS VPN VRF interface. |
Examples
This example shows how to enable sampled NetFlow on an interface:
Router(config-if)# mls netflow sampling
Router(config-if)#
This example shows how to disable sampled NetFlow on an interface:
Router(config-if)# no mls netflow sampling
Router(config-if)#
Related Commands
|
Command |
Description |
|---|---|
|
flow hardware mpls-vpn ip |
Enables NetFlow to create and export hardware NetFlow cache entries for IPv4 traffic on an MPLS VPN VRF interface. |
|
ip flow ingress |
Enables (ingress) NetFlow accounting for traffic arriving on an interface. |
|
mls flow ip |
Configures the flow mask to use for NetFlow Data Export. |
|
mls sampling |
Enables the sampled NetFlow and specifies the sampling method. |
|
show mls sampling |
Displays information about the sampled NDE status. |
mls netflow usage notify
To monitor the NetFlow table usage on the switch processor and the DFCs, use the mls netflow usage notifycommand in global configuration mode. To return to the default settings, use the no form of this command.
Usage Guidelines
If the NetFlow table usage monitoring is enabled and the NetFlow table usage exceeds the percentage threshold, a warning message is displayed.
NetFlow gathers statistics from traffic and stores the statistics in the NetFlow table. You can gather statistics globally based on a protocol or optionally per interface.
If you are not using NDE or the Cisco IOS features that use the hardware NetFlow table (micro-flow QoS, WCCP, TCP Intercept, or Reflexive ACLs), you may safely disable the use and maintenance of the hardware NetFlow table using the no mls netflow command in global configuration mode.
mls sampling
To enable the sampled NetFlow and specify the sampling method, use the mls sampling command in global configuration mode. To disable the sampled NetFlow, use the no form of this command.
Syntax Description
|
time-based rate |
Specifies the time-based sampling rate; valid values are 64, 128, 256, 512, 1024, 2046, 4096, and 8192. See the "Usage Guidelines" section for additional information. |
|
packet-based rate |
Specifies the packet-based sampling rate; valid values are 64, 128, 256, 512, 1024, 2046, 4096, and 8192. |
|
interval |
(Optional) Sampling interval; valid values are fro m 8000 to 16000 millise conds. |
Command History
Usage Guidelines
The sampled NetFlow is supported on Layer 3 interfaces only.
You can enable the sampled NetFlow even if NDE is disabled, but no flows are exported.
With packet-based sampling, a flow with a packet cou nt of n is sampled nm times, where m is the sampling rate.
Cisco IOS Release 12.2(33)SRB and later support per-interface NetFlow for IPv4 traffic. Per-interface NetFlow has the following configuration requirements:
- In addition to issuing the mls sampling command (to globally enable NetFlow on the router), you must also issue the ip flow ingress and mls netflow sampling commands on individual interfaces to enable sampled NetFlow on the interface.
- The flow hardware mpls-vpn ipvrf-id command enables sampled NetFlow for IPv4 traffic flows on an MPLS VPN VRF interface.
- The only flow masks allowed for IPv4 traffic are interface-destination-source and interface-full. If other flow mask values are used, the router upgrades them as follows:
- Source, destination, and destination-source flow masks are treated as interface-destination-source.
- Full flow masks are treated as interface-full.
The time-based sampling is based on a preset interval for each sampling rate.
The table below lists the sample intervals for each rate and period.
Examples
This example shows how to enable the time-based NetFlow sampling and set the sampling rate:
Router(config
)# mls sampling time-based 1024
Router(config)#
This example shows how to enable the packet-based NetFlow sampling and set the sampling rate and interval:
Router(config
)# mls sampling packet-based 1024 8192
Router(config)#
Related Commands
|
Command |
Description |
|---|---|
|
flow hardware mpls-vpn ip |
Enables NetFlow to create and export hardware NetFlow cache entries for IPv4 traffic on an MPLS VPN VRF interface. |
|
ip flow ingress |
Enables (ingress) NetFlow accounting for traffic arriving on an interface. |
|
mls flow ip |
Configures the flow mask to use for NetFlow Data Export. |
|
mls netflow sampling |
Enables the sampled NetFlow on an interface. |
|
show mls sampling |
Displays information about the sampled NDE status. |
mode (flow sampler configuration)
To specify a packet interval for random sampled NetFlow accounting and enable the flow sampler map, use the modecommand in NetFlow flow sampler configuration mode.
Command History
|
Release |
Modification |
|---|---|
|
12.3(2)T |
This command was introduced. |
|
12.2(18)S |
This command was integrated into Cisco IOS Release 12.2(18)S. |
|
12.0(26)S |
This command was integrated into Cisco IOS Release 12.0(26)S. |
|
12.2(27)SBC |
This command was integrated into Cisco IOS Release 12.2(27)SBC. |
|
12.2(18)SXF |
This command was integrated into Cisco IOS Release 12.2(18)SXF. |
|
12.2(33)SRA |
This command was integrated into Cisco IOS Release 12.2(33)SRA. |
Usage Guidelines
The mode random one-out-of command does not have a no format to remove it from the configuration. To disable NetFlow random sampling and packet interval you must remove the flow sampler map that you enabled with the mode random one-out-ofcommand.
If you want to change the value that you entered for the packet-interval argument repeat the mode random one-out-of packet-interval command using the new value for packet-interval.
Random sampled NetFlow accounting cannot be run concurrently with (ingress) NetFlow accounting, egress NetFlow accounting, or NetFlow accounting with input filter sampling on the same interface, or subinterface. In order to run random sampled NetFlow accounting, you must first disable (ingress) NetFlow accounting, egress NetFlow accounting, or NetFlow accounting with input filter sampling.
You must enable either Cisco Express Forwarding (CEF) or distributed CEF (dCEF) before using this command.
Examples
The following example shows how to create and enable a random sampler map for random sampled (ingress) NetFlow accounting with CEF switching on Ethernet interface 0/0:
Router(config)# ip cef
Router(config)# flow-sampler-map my-map
Router(config-sampler)# mode random one-out-of 100
Router(config-sampler)# interface ethernet 0/0
Router(config-if)# no ip route-cache flow
Router(config-if)# ip
 route-cache cef
Router(config-if)# flow-sampler my-map
The following example shows how to create and enable a random sampler map for random sampled egress NetFlow accounting with CEF switching on Ethernet interface 1/0:
Router(config)# ip cef
Router(config)# flow-sampler-map my-map
Router(config-sampler)# mode random one-out-of 100
Router(config-sampler)# interface ethernet 1/0
Router(config-if)# no
 ip flow egress
Router(config-if)# ip
 route-cache cef
Router(config-if)# flow-sampler my-map egress
The following output from the show flow-sampler command verifies that random sampled NetFlow accounting is active:
Router# show flow-sampler

 Sampler : my-map, id : 1, packets matched : 7, mode : random sampling mode
  sampling interval is : 100
Related Commands
|
Command |
Description |
|---|---|
|
flow-sampler |
Applies a flow sampler map for random sampled NetFlow accounting to an interface. |
|
flow-sampler-map |
Defines a flow sampler map for random sampled NetFlow accounting. |
|
netflow-sampler |
Enables NetFlow accounting with input filter sampling. |
|
show flow-sampler |
Displays the status of random sampled NetFlow (including mode, packet interval, and number of packets matched for each flow sampler). |
|
show ip cache flow |
Displays a summary of the NetFlow accounting statistics. |
|
show ip cache verbose flow |
Displays a detailed summary of the NetFlow accounting statistics. |
|
show ip flow interface |
Displays NetFlow accounting configuration for interfaces. |
mpls netflow egress
To enable Multiprotocol Label Switching (MPLS) egress NetFlow accounting on an interface, use the mpls netflow egress command in interface configuration mode. To disable MPLS egress NetFlow accounting, use the no form of this command.
Command History
|
Release |
Modification |
|---|---|
|
12.0(10)ST |
This command was introduced. |
|
12.1(5)T |
This command was integrated into Cisco IOS Release 12.1(5)T. |
|
12.2(33)SRA |
This command was integrated into Cisco IOS Release 12.2(33)SRA. |
|
12.2SX |
This command is supported in the Cisco IOS Release 12.2SX train. Support in a specific 12.2SX release of this train depends on your feature set, platform, and platform hardware. |
|
12.2(33)SCA |
This command was integrated into Cisco IOS Release 12.2(33)SCA. |
Usage Guidelines
Use this command to configure the provider edge (PE) to customer edge (CE) interface of a PE router.
Examples
The following example shows how to enable MPLS egress NetFlow accounting on the egress PE interface that connects to the CE interface at the destination Virtual Private Network (VPN) site:
Router(config-if)# mpls netflow egress
Related Commands
|
Command |
Description |
|---|---|
|
debug mpls netflow |
Enables debugging of MPLS egress NetFlow accounting. |
|
show mpls forwarding-table |
Displays a message that the quick flag is set for all prefixes learned from the MPLS egress NetFlow accounting enabled interface. |
|
show mpls interfaces |
Displays the value of the output_feature_state. |
netflow-sampler
To enable NetFlow accounting with input filter sampling, use the netflow-samplercommand in QoS policy-map class configuration mode. To disable NetFlow accounting with input filter sampling, use the no form of this command.
Command History
|
Release |
Modification |
|---|---|
|
12.3(4)T |
This command was introduced. |
|
12.2(25)S |
This command was integrated into Cisco IOS Release 12.2(25)S. |
|
12.2(27)SBC |
This command was integrated into Cisco IOS Release 12.2(27)SBC. |
|
12.2(31)SB2 |
This command was integrated into Cisco IOS Release 12.2(31)SB2. |
|
12.2(33)SRA |
This command was integrated into Cisco IOS Release 12.2(33)SRA. |
|
12.2SX |
This command is supported in the Cisco IOS Release 12.2SX train. Support in a specific 12.2SX release of this train depends on your feature set, platform, and platform hardware. |
Usage Guidelines
NetFlow accounting with input filter sampling cannot be run concurrently with (ingress) NetFlow accounting, egress NetFlow accounting, or random sampled NetFlow on the same interface, or subinterface. In order to run NetFlow accounting with input filter sampling, you must first disable (ingress) NetFlow accounting, egress NetFlow accounting, or random sampled NetFlow.
You can assign only one NetFlow input filter sampler to a class. Assigning another NetFlow input filter sampler to a class overwrites the previous one.
Samplers, also known as filters, are based on classes, but they are enabled on interfaces. You assign a NetFlow input filters sampler to a class by using the netflow-samplercommand in QoS policy-map class configuration. You the use the service-policycommand to attach the policy map you defined to one or more interfaces.
You must enable either Cisco Express Forwarding (CEF) or distributed CEF (dCEF) before using this command.
Examples
The following example shows how to enable NetFlow accounting with input filter sampling for one class of traffic (traffic with 10 as the first octet of the IP source address):
Router(config)# ip cef
Router(config)# flow-sampler-map network-10
Router(config-sampler)# mode random one-out-of 100
Router(config-sampler)# exit
Router(config)# class-map match-any network-10
Router(config-cmap)# match access-group 100
Router(config-cmap)# exit
Router(config)# policy-map network-10
Router(config-pmap)# class network-10
Router(config-pmap-c)# netflow-sampler network-10
Router(config-pmap-c)# exit
Router(config-pmap)# exit
Router(config)# interface Ethernet0/0
Router(config-if)# no ip route-cache flow
Router(config-if)# ip route-cache cef
Router(config-if)# interface ethernet 0/0.1
Router(config-if)# service-policy input network-10
Router(config-if)# exit
Router(config)# access-list 100 permit ip 10.0.0.0 0.255.255.255 any
The following output from the show flow-sampler command verifies that the NetFlow accounting with input filter sampling is active:
Router# show flow-sampler

 Sampler : network-10, id : 1, packets matched : 546, mode : random sampling mode
  sampling interval is : 100
The following output from the show ip cache verbose flow command shows that combination of the access-list 100 permit ip 10.0.0.0 0.255.255.255 any command and the match access-group 100 command has filtered out any traffic in which the source IP address does not have 10 as the first octet:
Router# show ip cache verbose flow
IP packet size distribution (116 total packets):
   1-32   64   96  128  160  192  224  256  288  320  352  384  416  448  480
   .000 .155 .000 .000 .000 .000 .000 .000 .000 .000 .000 .000 .000 .000 .000
    512  544  576 1024 1536 2048 2560 3072 3584 4096 4608
   .000 .000 .000 .258 .586 .000 .000 .000 .000 .000 .000
IP Flow Switching Cache, 278544 bytes
  7 active, 4089 inactive, 66 added
  3768 ager polls, 0 flow alloc failures
  Active flows timeout in 1 minutes
  Inactive flows timeout in 120 seconds
IP Sub Flow Cache, 21640 bytes
  6 active, 1018 inactive, 130 added, 62 added to flow
  0 alloc failures, 0 force free
  1 chunk, 1 chunk added
  last clearing of statistics never
Protocol         Total    Flows   Packets Bytes  Packets Active(Sec) Idle(Sec)
--------         Flows     /Sec     /Flow  /Pkt     /Sec     /Flow     /Flow
TCP-Telnet           6      0.0         1   940      0.0       8.8      51.6
TCP-FTP              5      0.0         1   640      0.0       6.9      53.4
TCP-SMTP             2      0.0         3  1040      0.0      41.7      18.5
TCP-other           36      0.0         1  1105      0.0      18.8      41.5
UDP-other            6      0.0         3    52      0.0      54.8       5.5
ICMP                 4      0.0         1   628      0.0      11.3      48.8
Total:              59      0.0         1   853      0.1      20.7      39.6
SrcIf          SrcIPaddress    DstIf          DstIPaddress    Pr TOS Flgs  Pkts
Port Msk AS                    Port Msk AS    NextHop              B/Pk  Active
Et0/0.1        10.10.10.3      Et1/0.1        172.16.10.3     06 80  00       1
0016 /0  0                     0016 /0  0     0.0.0.0               840     0.0
Sampler: 1  Class: 1
Et0/0.1        10.10.10.3      Et1/0.1*       172.16.10.3     06 80  00       1
0016 /0  0                     0016 /0  0     0.0.0.0               840     0.0
Sampler: 1  Class: 1  FFlags: 01
Et0/0.1        10.10.11.3      Et1/0.1        172.16.10.7     06 80  00       1
0041 /0  0                     0041 /0  0     0.0.0.0              1140     0.0
Sampler: 1  Class: 1
Et0/0.1        10.10.11.1      Et1/0.1        172.16.10.5     06 80  00       3
0019 /0  0                     0019 /0  0     0.0.0.0              1040    36.7
Sampler: 1  Class: 1
Et0/0.1        10.10.11.1      Et1/0.1*       172.16.10.5     06 80  00       1
0019 /0  0                     0019 /0  0     0.0.0.0              1040     0.0
Sampler: 1  Class: 1  FFlags: 01
Et0/0.1        10.1.1.2        Et1/0.1        172.16.10.10    06 80  00       2
0041 /0  0                     0041 /0  0     0.0.0.0              1140    37.8
Sampler: 1  Class: 1
Et0/0.1        10.10.10.1      Et1/0.1        172.16.10.1     01 80  10       1
0000 /0  0                     0000 /0  0     0.0.0.0               628     0.0
Sampler: 1  Class: 1
Related Commands
|
Command |
Description |
|---|---|
|
flow-sampler |
Applies a flow sampler map for random sampled NetFlow accounting to an interface. |
|
flow-sampler-map |
Defines a flow sampler map for random sampled NetFlow accounting. |
|
mode (flow sampler configuration) |
Specifies a packet interval for NetFlow accounting random sampling mode and enables the flow sampler map. |
|
class-map |
Creates a class map to be used for matching packets to a specified class. |
|
policy-map |
Creates or modifies a policy map that can be attached to one or more interfaces to specify a service policy |
|
service-policy |
Attaches a policy map to an input interface or virtual circuit (VC). |
|
show flow-sampler |
Displays the status of random sampled NetFlow (including mode, packet interval, and number of packets matched for each flow sampler). |
|
show ip cache flow |
Displays a summary of the NetFlow accounting statistics. |
|
show ip cache verbose flow |
Displays a detailed summary of the NetFlow accounting statistics. |
|
show ip flow interface |
Displays NetFlow accounting configuration for interfaces. |
platform netflow rp sampling scale
To enable applying of sampling scale equivalent to the configured platform sampling ratio on the software-switched flows exported by the NetFlow software, use the platform netflow rp sampling scalecommand in global configuration mode. To disable sampling of software-switched flows by the NetFlow software, use the no form of this command.
Usage Guidelines
Use this command to scale the exported information for flows handled by the Route Processor (RP) equivalent to the platform sampling ratio. Without this command, a NetFlow collector assumes all flows exported by a router are uniformly sampled and multiplies the nonsampled RP flows by the sampling factor, and therefore overestimates the traffic handled by the RP.
The applicable sampling scale is obtained from the Cisco 7600-specific router platform mls sampling command.
Based on configuration, the RP software divides the exported packet/byte counts for a V5 and V9 export by the configured platform sampling ratio. The platform configuration is accomplished using the mls netflow sampling command. If no such configuration is present, the RP exports the value it observes, and does not divide the exported packet/byte count.
Note | If the division result is zero, the value 1 is substituted. |
reliability (NetFlow SCTP)
To specify the level of reliability for the reliable export of NetFlow accounting information in NetFlow cache entries, use the reliabilitycommand in NetFlow ip flow export stream control transmission protocol (SCTP) configuration mode. To return to the default behavior, use the noform of this command.
Syntax Description
|
ip-address | hostname |
IP address or hostname of the workstation to which you want to send the NetFlow information. |
|
full |
Configures guaranteed reliable, ordered delivery of messages to a export destination. This is the default behavior. |
|
none |
Specifies that each message is sent once. The message is not stored in a buffer and cannot be retransmitted if it is not received by the export destination. |
|
partial |
Specifies the limit on the amount of memory the router will use to buffer messages while waiting for them to be acknowledged by the export destination. |
|
buffer-limit limit |
Specifies the amount of memory that is available for the buffering of messages that have not been acknowledged by the export destination. Range: 1 to 35000 packets. |
Usage Guidelines
NetFlow Reliable Export Using SCTP with Partial Reliability
If a stream is specified as unreliable, the packet is simply sent once and not buffered on the exporter at all. If the packet is lost en route to the receiver, the exporter is not notified and cannot re-transmit it
When a stream is specified as partially reliable, a limit can be placed on how much memory should be dedicated to storing un-acknowledged packets. The limit is configurable. If the limit is exceeded and the router attempts to buffer another packet, the oldest un-acknowledged packet is discarded. When SCTP discards the oldest unacknowledged packet a message called a forward-tsn (transmit sequence number) is sent to the export destination to indicate that this packet will not be received. This prevents NetFlow from consuming all the free memory on a router when a situation has arisen which requires a large number of packets to be buffered, for example when you are experiencing long response times from an SCTP peer connection.
When SCTP is operating in partially-reliable mode, the limit on how much memory should be dedicated to storing un-acknowledged packets should initially be set as high as possible. The limit on how much memory should be dedicated to storing unacknowledged packets can be reduced if other processes on the router begin to run out of memory. Deciding on the best value for the limit on how much memory should be dedicated to storing un-acknowledged packets involves a trade off between avoiding starving other processes of the memory that they require to operate, and dropping SCTP messages that have not been acknowledged by the export destination.
NetFlow Reliable Export Using SCTP with Reliability Disabled
When an SCTP connection is specified as unreliable, exported messages are sent once only and are not buffered. If the message is lost en route to the export destination, it cannot be retransmitted. Unreliable SCTP can be used when the export destination that you are using doesn't support UDP as a transport protocol for receiving NetFlow export datagrams, and you do not want to allocate the resources on your router required to provide reliable, or partially reliable, SCTP connections.
Examples
The following example shows how to configure the networking device to use full SCTP reliability:
Router(config)# ip flow-export destination 172.16.10.2 78 sctp
Router(config-flow-export-sctp)# reliability full
The following example shows how to configure the networking device to use partial SCTP reliability, with a maximum value for the buffer limit of 35000 export packets:
Router(config)# ip flow-export destination 172.16.10.2 78 sctp
Router(config-flow-export-sctp)# reliability partial buffer-limit 35000
The following example shows how to configure the networking device to use SCTP with no reliability:
Router(config)# ip flow-export destination 172.16.10.2 78 sctp
Router(config-flow-export-sctp)# reliability none
Related Commands
|
Command |
Description |
|---|---|
|
backup |
Configures a backup destination for the reliable export of NetFlow accounting information in NetFlow cache entries |
|
ip flow-export destination sctp |
Enables the reliable export of NetFlow accounting information in NetFlow cache entries. |
|
show ip flow export |
Displays the status and the statistics for NetFlow accounting data export. |
show flow-sampler
To display the status and statistics for random sampled NetFlow (including mode, packet interval, and number of packets matched for each flow sampler), use the show flow-sampler command in user EXEC or privileged EXEC mode.
Command History
|
Release |
Modification |
|---|---|
|
12.3(2)T |
This command was introduced. |
|
12.2(18)S |
This command was integrated into Cisco IOS Release 12.2(18)S. |
|
12.0(26)S |
This command was integrated into Cisco IOS Release 12.0(26)S. |
|
12.2(27)SBC |
This command was integrated into Cisco IOS Release 12.2(27)SBC. |
|
12.2(18)SXF |
This command was integrated into Cisco IOS Release 12.2(18)SXF. |
|
12.2(33)SRA |
This command was integrated into Cisco IOS Release 12.2(33)SRA. |
Examples
The following is sample output from the show flow-sampler command for all flow samplers:
Router> show flow-sampler
Sampler : mysampler1, id : 1, packets matched : 10, mode : random sampling mode
  sampling interval is : 100
 Sampler : myflowsampler2, id : 2, packets matched : 5, mode : random sampling mode
  sampling interval is : 200
The following is sample output from the show flow-sampler command for a flow sampler named mysampler1:
Router> show flow-sampler mysampler1
Sampler : mysampler1, id : 1, packets matched : 0, mode : random sampling mode
  sampling interval is : 100
The table below describes the fields shown in the displays.
Related Commands
|
Command |
Description |
|---|---|
|
flow-sampler |
Applies a flow sampler map for random sampled NetFlow accounting to an interface. |
|
flow-sampler-map |
Defines a flow sampler map for random sampled NetFlow accounting. |
|
mode (flow sampler configuration) |
Specifies a packet interval for NetFlow accounting random sampling mode. |
|
netflow-sampler |
Enables NetFlow accounting with input filter sampling. |
|
show ip cache flow |
Displays a summary of the NetFlow accounting statistics. |
|
show ip cache verbose flow |
Displays a detailed summary of the NetFlow accounting statistics. |
|
show ip flow interface |
Displays NetFlow accounting configuration for interfaces. |
show fm nat netflow data
To display the information about the NAT-related NetFlow data, use the show fm nat netflow data command in user EXEC or privileged EXEC mode.
Command History
|
Release |
Modification |
|---|---|
|
12.2(14)SX |
Support for this command was introduced on the Supervisor Engine 720. |
|
12.2(17d)SXB |
Support for this command on the Supervisor Engine 2 was extended to Release 12.2(17d)SXB. |
|
12.2(18)SXD |
The output was changed to display the information about the NetFlow lookup mode state for fragments. |
|
12.2(33)SRA |
This command was integrated into Cisco IOS Release 12.2(33)SRA. |
Examples
This example shows how to display the information about the NAT-related NetFlow data:
Router> show fm nat netflow data
FM Pattern with stat push disabled: 1
Default/TCP/UDP Timeouts:
Def s/w timeout: 86400 h/w timeout: 300 Pattern(ingress): 4
Pattern(egress): 4 Push interval: 1333
TCP s/w timeout: 86400 h/w timeout: 300 Pattern(ingress): 4
Pattern(egress): 4 Push interval: 1333
UDP s/w timeout: 300 h/w timeout: 300 Pattern(ingress): 3
Pattern(egress): 3 Push interval: 100
Port Timeouts:
Idle timeout :3600 secs
Fin/Rst timeout :10 secs
Fin/Rst Inband packets sent per timeout :10000
Netflow mode to Zero-out Layer4 information for fragment packet lookup :
Enabled
Router>
show fm netflow
To display the feature manager (FM) Netflow information, use the show fm netflow command in User EXEC or privileged EXEC mode.
Examples
This example shows how to display the information about the feature manager Netflow counters:
Router# show fm netflow counters
FM Netflow Counters                IPv4           IPv6
-----------------------------------------------------------------
Netflow Install Request Counters:
Netflow Install Reply Counters:
Netflow Delete Requests Counters:
Netflow Delete Reply Counters:
Netflow nodes in database:         0              0
FM Netflow Outstanding Adjacency Replies, Slot[1] = 0
FM Safe inband mode : Active
FM No. of dummy inbands : 8
FM Netflow Disable shortcut Flag : 0
FM Inband Reply Mode : Inband err reply
FM Netflow Adjacency Block Size : 1024
FM Netflow Max Adjacency Threshold : 131072
FM Number of Items in Netflow Clr Database=0
This example shows how to display the information about the feature manager Netflow patterns:
Router# show fm netflow pattern
Feature                   Pattern  StatPush Agetime
-------                   -------  -------- -------
SLB                            7       0        0       10
INSPECT                        6       0        0       1
TCP_INTERCEPT                  5       0        300     1
WCCP_EGRESS                    5       0        300     1
NAT_INGRESS                    4       1333     300     1
NAT_EGRESS                     4       1333     300     1
IP_ACCESS_INGRESS              3       100      300     1
IP_ACCESS_EGRESS               3       100      300     1
NAT_INGRESS                    3       100      300     1
NAT_EGRESS                     3       100      300     1
IPV6_RACL_EGRESS               3       100      300     1
NF_AGING                       2       0        10
DEFAULT_NO_STAT                1       0        0
This example shows how to display the slot information about the feature manager Netflow:
Router# show fm netflow slotinfo
Slotnum=1       free_index=0     num_free_adj=128       adj_arr_size=128
VSS Output
This example shows how to display the information about the feature manager Netflow counters on a VSS:
Router# show fm netflow counters
FM Netflow Counters                IPv4           IPv6
-----------------------------------------------------------------
Netflow Install Request Counters:
Netflow Install Reply Counters:
Netflow Delete Requests Counters:
Netflow Delete Reply Counters:
Netflow nodes in database:         0              0
FM Netflow Outstanding Adjacency Replies, Slot[1/1] = 0
FM Netflow Outstanding Adjacency Replies, Slot[1/2] = 0
FM Safe inband mode : Active
FM No. of dummy inbands : 8
FM Netflow Disable shortcut Flag : 0
FM Inband Reply Mode : Inband err reply
FM Netflow Adjacency Block Size : 1024
FM Netflow Max Adjacency Threshold : 131072
FM Number of Items in Netflow Clr Database=0
This example shows how to display the slot information about the feature manager Netflow on a VSS:
Router# show fm netflow slotinfo
Slotnum=1/1      free_index=0     num_free_adj=128       adj_arr_size=128
Slotnum=1/2      free_index=0     num_free_adj=128       adj_arr_size=128
Slotnum=2/5      free_index=0     num_free_adj=128       adj_arr_size=128
Slotnum=2/8      free_index=0     num_free_adj=128       adj_arr_size=128
show ip cache flow
To display a summary of the NetFlow accounting statistics, use the show ip cache flow command in user EXEC or privileged EXEC mode.
Command History
|
Release |
Modification |
|---|---|
|
11.1 |
This command was introduced. |
|
11.1CA |
The information display for the command was updated. |
|
12.2(14)S |
This command was integrated into Cisco IOS Release 12.2(14)S. |
|
12.3(1) |
Support for the NetFlow Multicast Support feature was added. |
|
12.2(18)S |
Support for the NetFlow Multicast Support feature was added. |
|
12.3(4)T, 12.3(6), 12.2(20)S |
The execute-on command was implemented on the Cisco 7500 platforms to include the remote execution of the show ip cache flowcommand. |
|
12.3(11)T |
Support for egress flow accounting was added, and the [prefix mask] and [type number] arguments were removed. |
|
12.2(27)SBC |
This command was integrated into Cisco IOS Release 12.2(27)SBC. |
|
12.2(14)SX |
Support for this command was introduced on the Supervisor Engine 720. |
|
12.2(17b)SXA |
The output was changed to include hardware-entry information. |
|
12.2(17d)SXB |
Support for this command on the Supervisor Engine 2 was extended to the 12.2 SX release. |
|
12.2(18)SXF |
This command was integrated into Cisco IOS Release 12.2(18)SXF. |
|
12.2(31)SB2 |
This command was integrated into Cisco IOS Release 12.2(31)SB2. |
|
12.2(33)SRB |
This command was modified to show the VPN name and VPN ID in the display output. |
Usage Guidelines
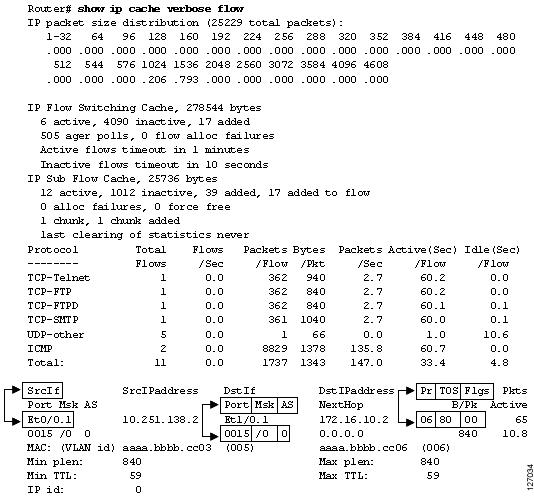
Some of the content in the display of the show ip cache flowcommand uses multiline headings and multiline data fields. Figure 1 uses an example of the output from the show ip cache verbose flowto show how to associate the headings with the correct data fields when there are two or more lines of headings and two or more lines of data fields. The first line of the headings is associated with the first line of data fields. The second line of the headings is associated with the second line of data fields, and so on.
When other features such as IP Multicast are configured, the number of lines in the headings and data fields increases. The method for associating the headings with the correct data fields remains the same.
Displaying Detailed NetFlow Cache Information on Platforms Running Distributed Cisco Express Forwarding
On platforms running distributed Cisco Express Forwarding (dCEF), NetFlow cache information is maintained on each line card or Versatile Interface Processor. To display this information on a distributed platform by use of the show ip cache flow command, you must enter the command at a line card prompt.
Cisco 7600 Series Platforms
The module num keyword and argument are supported on DFC-equipped modules only.
The VPN name and ID are shown in the display output in the format VPN:vpn-id.
Cisco 7500 Series Platform
The Cisco 7500 series platforms are not supported by Cisco IOS Release 12.4T and later. Cisco IOS Release 12.4 is the last Cisco IOS release to support the Cisco 7500 series platforms.
To display NetFlow cache information using the show ip cache flow command on a Cisco 7500 series router that is running dCEF, enter the following sequence of commands:
Router# if-con

slot-number
LC-
slot-number
# show ip cache flow
For Cisco IOS Releases 12.3(4)T, 12.3(6), and 12.2(20)S and later, enter the following command to display NetFlow cache information:
Router# execute-on
slot-number
show ip cache flow
Cisco 12000 Series Platform
To display NetFlow cache information using the show ip cache flow command on a Cisco 12000 Series Internet Router, enter the following sequence of commands:
Router# attach

slot-number
LC-
slot-number
# show ip cache flow
For Cisco IOS Releases 12.3(4)T, 12.3(6), and 12.2(20)S and later, enter the following command to display NetFlow cache information:
Router# execute-on
slot-number
show ip cache flow
Examples
The following is a sample display of a main cache using the show ip cache flow command:
Router# show ip cache flow
IP packet size distribution (2381 total packets):
   1-32   64   96  128  160  192  224  256  288  320  352  384  416  448  480
   .092 .000 .003 .000 .141 .048 .000 .000 .000 .093 .000 .000 .000 .000 .000
    512  544  576 1024 1536 2048 2560 3072 3584 4096 4608
   .000 .000 .048 .189 .381 .000 .000 .000 .000 .000 .000
IP Flow Switching Cache, 278544 bytes
  22 active, 4074 inactive, 45 added
  2270 ager polls, 0 flow alloc failures
  Active flows timeout in 1 minutes
  Inactive flows timeout in 100 seconds
IP Sub Flow Cache, 25736 bytes
  23 active, 1001 inactive, 47 added, 45 added to flow
  0 alloc failures, 0 force free
  1 chunk, 1 chunk added
  last clearing of statistics never
Protocol         Total    Flows   Packets Bytes  Packets Active(Sec) Idle(Sec)
--------         Flows     /Sec     /Flow  /Pkt     /Sec     /Flow     /Flow
TCP-FTP              4      0.0        67   840      2.6      59.4       0.7
TCP-SMTP             1      0.0        67   168      0.6      59.4       0.5
TCP-BGP              1      0.0        68  1140      0.6      60.3       0.4
TCP-NNTP             1      0.0        68  1340      0.6      60.2       0.2
TCP-other            7      0.0        68   913      4.7      60.3       0.4
UDP-TFTP             1      0.0        68   156      0.6      60.2       0.1
UDP-other            4      0.0        36   151      1.4      45.6      14.7
ICMP                 4      0.0        67   529      2.7      60.0       0.2
Total:              23      0.2        62   710     14.3      57.5       2.9
SrcIf         SrcIPaddress    DstIf         DstIPaddress    Pr SrcP DstP  Pkts
Et2/0         192.168.137.78  Et3/0*        192.168.10.67   06 0041 0041    39
Et2/0         172.19.216.196  Et3/0*        192.168.10.38   06 0077 0077    39
Et0/0.1       10.56.78.128    Et1/0.1       172.16.30.231   06 00B3 00B3    48
Et0/0.1       10.10.18.1      Et1/0.1       172.16.30.112   11 0043 0043    47
Et0/0.1       10.162.37.71    Et1/0.1       172.16.30.218   06 027C 027C    48
Et0/0.1       172.16.6.1      Null          224.0.0.9       11 0208 0208     1
Et0/0.1       10.231.159.251  Et1/0.1       172.16.10.2     06 00DC 00DC    48
Et2/0         10.234.53.1     Et3/0*        192.168.10.32   06 0016 0015    39
Et2/0         10.210.211.213  Et3/0*        192.168.10.127  06 006E 006E    38
Et0/0.1       10.234.53.1     Et1/0.1       172.16.30.222   01 0000 0000    47
Et0/0.1       10.90.34.193    Et1/0.1       172.16.10.2     06 0016 0015    48
Et0/0.1       10.10.10.2      Et1/0.1       172.16.10.2     06 0016 0015    48
Et2/0         10.10.18.1      Et3/0*        192.168.10.162  11 0045 0045    39
Et0/0.1       192.168.3.185   Et1/0.1       172.16.10.2     06 0089 0089    48
Et0/0.1       10.10.11.1      Et1/0.1       172.16.30.51    06 0019 0019    49
Et0/0.1       10.254.254.235  Et1/0.1       172.16.10.2     11 00A1 00A1    48
Et2/0         192.168.23.2    Et3/0*        192.168.10.2    01 0000 0000    39
Et0/0.1       10.251.10.1     Et1/0.1       172.16.10.2     01 0000 0800    47
R3#
Note | The asterisk (*) immediately following the "DstIf" field indicates that the flow being shown is an egress flow. |
The following output of the show ip cache flow command on a Cisco 7600 series router shows the source interface some of the traffic in the NetFlow hardware cache on the PFC is VPN Red.
PE1# show ip cache flow
-------------------------------------------------------------------------------
MSFC:
IP packet size distribution (3139 total packets):
   1-32   64   96  128  160  192  224  256  288  320  352  384  416  448  480
   .000 .685 .309 .000 .000 .000 .000 .003 .000 .000 .000 .000 .000 .000 .000
    512  544  576 1024 1536 2048 2560 3072 3584 4096 4608
   .000 .000 .000 .000 .000 .000 .000 .000 .000 .000 .000
IP Flow Switching Cache, 278544 bytes
  2 active, 4094 inactive, 56 added
  20904 ager polls, 0 flow alloc failures
  Active flows timeout in 30 minutes
  Inactive flows timeout in 15 seconds
IP Sub Flow Cache, 33992 bytes
  0 active, 1024 inactive, 4 added, 4 added to flow
  0 alloc failures, 0 force free
  1 chunk, 2 chunks added
  last clearing of statistics never
Protocol         Total    Flows   Packets Bytes  Packets Active(Sec) Idle(Sec)
--------         Flows     /Sec     /Flow  /Pkt     /Sec     /Flow     /Flow
TCP-BGP             10      0.0         1    49      0.0       0.0      15.3
TCP-other            6      0.0         2    49      0.0       4.5      15.5
UDP-other           28      0.0        74    63      0.1     320.5      12.7
IP-other             6      0.0       153    80      0.0    1488.3       1.7
Total:              50      0.0        60    68      0.2     358.6      12.2
SrcIf         SrcIPaddress    DstIf         DstIPaddress    Pr SrcP DstP  Pkts
Fa1/1         172.16.1.1      Null          224.0.0.2       11 0286 0286    74
Fa1/1         172.16.1.1      Null          224.0.0.5       59 0000 0000    33
-------------------------------------------------------------------------------
PFC:
Displaying Hardware entries in Module 5
 SrcIf            SrcIPaddress          DstIPaddress      Pr       SrcP      Dss
 Fa1/1            172.20.1.2            172.20.1.3        0        0         0
 Fa1/1            172.20.1.3            172.20.1.2        0        0         0
 Fa1/1            172.16.1.2            172.16.2.6        0        0         0
 Fa1/1            172.16.1.1            224.0.0.2         udp      646       64
 vpn:red          10.2.0.2              10.1.1.1          0        0         0
.
.
.
PE1#
The table below describes the significant fields shown in the flow switching cache lines of the display.
| Table 4 | show ip cache flow Field Descriptions in Flow Switching Cache Display |
|
Field |
Description |
|---|---|
|
bytes |
Number of bytes of memory used by the NetFlow cache. |
|
active |
Number of active flows in the NetFlow cache at the time this command was entered. |
|
inactive |
Number of flow buffers that are allocated in the NetFlow cache, but were not currently assigned to a specific flow at the time this command was entered. |
|
added |
Number of flows created since the start of the summary period. |
|
ager polls |
Number of times the NetFlow code looked at the cache to cause entries to expire (used by Cisco for diagnostics only). |
|
flow alloc failures |
Number of times the NetFlow code tried to allocate a flow but could not. |
|
last clearing of statistics |
Standard time output (hh:mm:ss) since the clear ip flow stats privileged EXEC command was executed. This time output changes to hours and days after the time exceeds 24 hours. |
The table below describes the significant fields shown in the activity by protocol lines of the display.
| Table 5 | show ip cache flow Field Descriptions in Activity by Protocol Display |
|
Field |
Description |
||
|---|---|---|---|
|
Protocol |
IP protocol and the well-known port number. (Refer to http://www.iana.org , Protocol Assignment Number Services , for the latest RFC values.)
|
||
|
Total Flows |
Number of flows in the cache for this protocol since the last time the statistics were cleared. |
||
|
Flows/Sec |
Average number of flows for this protocol per second; equal to the total flows divided by the number of seconds for this summary period. |
||
|
Packets/Flow |
Average number of packets for the flows for this protocol; equal to the total packets for this protocol divided by the number of flows for this protocol for this summary period. |
||
|
Bytes/Pkt |
Average number of bytes for the packets for this protocol; equal to the total bytes for this protocol divided by the total number of packets for this protocol for this summary period. |
||
|
Packets/Sec |
Average number of packets for this protocol per second; equal to the total packets for this protocol divided by the total number of seconds for this summary period. |
||
|
Active(Sec)/Flow |
Number of seconds from the first packet to the last packet of an expired flow divided by the number of total flows for this protocol for this summary period. |
||
|
Idle(Sec)/Flow |
Number of seconds observed from the last packet in each nonexpired flow for this protocol until the time at which the show ip cache verbose flow command was entered divided by the total number of flows for this protocol for this summary period. |
The table below describes the significant fields in the NetFlow record lines of the display.
| Table 6 | show ip cache flow Field Descriptions in NetFlow Record Display |
|
Field |
Description |
||
|---|---|---|---|
|
SrcIf |
Interface on which the packet was received. |
||
|
SrcIPaddress |
IP address of the device that transmitted the packet. |
||
|
DstIf |
Interface from which the packet was transmitted.
|
||
|
DstIPaddress |
IP address of the destination device. |
||
|
Pr |
IP protocol "well-known" port number, displayed in hexadecimal format. (Refer to http://www.iana.org , Protocol Assignment Number Services , for the latest RFC values.) |
||
|
SrcP |
The source protocol port number in hexadecimal. |
||
|
DstP |
The destination protocol port number in hexadecimal. |
||
|
Pkts |
Number of packets switched through this flow. |
Related Commands
|
Command |
Description |
|---|---|
|
clear ip flow stats |
Clears the NetFlow accounting statistics. |
|
show ip cache verbose flow |
Displays a detailed summary of the NetFlow accounting statistics. |
|
show ip flow interface |
Displays NetFlow accounting configuration for interfaces. |
|
show ip interface |
Displays the usability status of interfaces configured for IP. |
show ip cache flow aggregation
To display the NetFlow accounting aggregation cache statistics, use the show ip cache flow aggregation command in user EXEC or privileged EXEC mode.
Syntax Description
Command History
|
Release |
Modification |
|---|---|
|
12.0(3)T |
This command was introduced. |
|
12.0(15)S |
This command was modified to include new show output for ToS aggregation schemes. |
|
12.2(14)S |
This command was integrated into Cisco IOS Release 12.2(14)S. |
|
12.3(1) |
Support for the BGP Next Hop Support feature was added. |
|
12.2(18)S |
Support for the BGP Next Hop Support feature was added. |
|
12.0(26)S |
Support for the BGP Next Hop Support feature was added. |
|
12.2(27)SBC |
This command was integrated into Cisco IOS Release 12.2(27)SBC. |
|
12.2(14)SX |
Support for this command was introduced on the Supervisor Engine 720. |
|
12.2(17b)SXA |
The output was changed to include hardware-entry information. |
|
12.2(17d)SXB |
Support for this command on the Supervisor Engine 2 was extended to the 12.2 SX release. |
|
12.2(18)SXF |
This command was integrated into Cisco IOS Release 12.2(18)SXF. |
|
12.2(33)SRA |
This command was integrated into Cisco IOS Release 12.2(33)SRA. |
|
12.2(31)SB2 |
This command was integrated into Cisco IOS Release 12.2(31)SB2. |
|
12.2(33)SRB |
This command was modified to show the VPN name and VPN ID in the display output. |
Usage Guidelines
Some of the content in the display of the show ip cache flow aggregationcommand uses multiline headings and multiline data fields. Figure 1 uses an example of the output from the show ip cache verbose flowto show how to associate the headings with the correct data fields when there are two or more lines of headings and two or more lines of data fields. The first line of the headings is associated with the first line of data fields. The second line of the headings is associated with the second line of data fields, and so on.
When other features such as IP Multicast are configured, the number of lines in the headings and data fields increases. The method for associating the headings with the correct data fields remains the same.
Cisco 7600 Series Platforms
If you enter the show ip cache flow aggregation command without the module num, the software-switched aggregation cache on the RP is displayed.
The module num keyword and argument are supported on DFC-equipped modules only.
The VPN name and ID are shown in the display output in the format VPN:vpn-id.
Displaying Detailed NetFlow Cache Information on Platforms Running Distributed Cisco Express Forwarding
On platforms running Distributed Cisco Express Forwarding (dCEF), NetFlow cache information is maintained on each line card or Versatile Interface Processor. To display this information on a distributed platform by use of the show ip cache flow command, you must enter the command at a line card prompt.
Cisco 7500 Series Platform
The Cisco 7500 series platforms are not supported by Cisco IOS Release 12.4T and later. Cisco IOS Release 12.4 is the last Cisco IOS release to support the Cisco 7500 series platforms.
To display NetFlow cache information using the show ip cache flow command on a Cisco 7500 series router that is running dCEF, enter the following sequence of commands:
Router# if-con

slot-number
LC-
slot-number
# show ip cache flow
For Cisco IOS Releases 12.3(4)T, 12.3(6), and 12.2(20)S and later, enter the following command to display NetFlow cache information:
Router# execute-on
slot-number
show ip cache flow
Cisco 12000 Series Platform
To display NetFlow cache information using the show ip cache flow command on a Cisco 12000 Series Internet Router, enter the following sequence of commands:
Router# attach

slot-number
LC-
slot-number
# show ip cache flow
For Cisco IOS Releases 12.3(4)T, 12.3(6), and 12.2(20)S and later, enter the following command to display NetFlow cache information:
Router# execute-on
slot-number
show ip cache flow
Examples
The following is a sample display of an autonomous system aggregation cache with the show ip cache flow aggregation as command:
Router# show ip cache flow aggregation as
IP Flow Switching Cache, 278544 bytes
  2 active, 4094 inactive, 13 added
  178 ager polls, 0 flow alloc failures
Src If       Src AS  Dst If       Dst AS  Flows   Pkts  B/Pk  Active
Fa1/0         0      Null          0         1      2     49    10.2
Fa1/0         0      Se2/0         20        1      5    100     0.0
The following is a sample display of an autonomous system aggregation cache for the prefix mask 10.0.0.0 255.0.0.0 with the show ip cache flow aggregation ascommand:
Router# show ip cache 10.0.0.0 255.0.0.0 flow aggregation as
IP Flow Switching Cache, 278544 bytes
  2 active, 4094 inactive, 13 added
  178 ager polls, 0 flow alloc failures
Src If        Src AS  Dst If         Dst AS     Flows    Pkts  B/Pk  Active
e1/2           0      Null            0            1     2       49    10.2
e1/2           0      e1/2           20            1     5      100     0.0
The following is a sample display of an destination prefix TOS cache with the show ip cache flow aggregation destination-prefix-tos command:
Router# show ip cache flow aggregation destination-prefix-tos
IP Flow Switching Cache, 278544 bytes
  7 active, 4089 inactive, 21 added
  5970 ager polls, 0 flow alloc failures
  Active flows timeout in 5 minutes
  Inactive flows timeout in 15 seconds
IP Sub Flow Cache, 25736 bytes
  7 active, 1017 inactive, 21 added, 21 added to flow
  0 alloc failures, 0 force free
  1 chunk, 1 chunk added
Dst If         Dst Prefix      Msk  AS    TOS Flows  Pkts B/Pk  Active
Null           224.0.0.0       /24  0     C0     2     6    72   132.1
Et1/0.1        172.16.30.0     /24  0     00     2   134    28   121.1
Et1/0.1        172.16.30.0     /24  0     80    12   804   780   124.6
Et1/0.1        172.16.10.0     /24  0     00     4   268  1027   121.1
Et1/0.1        172.16.10.0     /24  0     80    12   804   735   123.6
Et3/0          192.168.10.0    /24  0     80    10   669   755   121.8
Et3/0          192.168.10.0    /24  0     00     2   134    28   121.2
Router#
The following is a sample display of an prefix port aggregation cache with the show ip cache flow aggregation prefix-portcommand:
Router# show ip cache flow aggregation prefix-port
IP Flow Switching Cache, 278544 bytes
  21 active, 4075 inactive, 84 added
  26596 ager polls, 0 flow alloc failures
  Active flows timeout in 5 minutes
  Inactive flows timeout in 15 seconds
IP Sub Flow Cache, 25736 bytes
  0 active, 1024 inactive, 0 added, 0 added to flow
  0 alloc failures, 0 force free
  1 chunk, 1 chunk added
Src If        Src Prefix     Msk  Dst If        Dst Prefix     Msk Flows  Pkts
Et0/0.1       0.0.0.0        /0   Et1/0.1       172.16.10.0    /24    2    132
Et0/0.1       0.0.0.0        /0   Et1/0.1       172.16.30.0    /24    1     66
Et0/0.1       0.0.0.0        /0   Et1/0.1       172.16.30.0    /24    1     67
Et0/0.1       0.0.0.0        /0   Et1/0.1       172.16.30.0    /24    1     67
Et0/0.1       0.0.0.0        /0   Et1/0.1       172.16.10.0    /24    1     66
Et0/0.1       0.0.0.0        /0   Et1/0.1       172.16.30.0    /24    1     66
Et2/0         0.0.0.0        /0   Et3/0         192.168.10.0   /24    1     66
Et0/0.1       0.0.0.0        /0   Et1/0.1       172.16.30.0    /24    1     66
Et0/0.1       0.0.0.0        /0   Et1/0.1       172.16.10.0    /24    1     66
Et0/0.1       0.0.0.0        /0   Et1/0.1       172.16.10.0    /24    1     67
Et0/0.1       172.16.6.0     /24  Null          224.0.0.0      /24    1      3
Et0/0.1       0.0.0.0        /0   Et1/0.1       172.16.10.0    /24    1     66
Et2/0         0.0.0.0        /0   Et3/0         192.168.10.0   /24    1     66
Et2/0         0.0.0.0        /0   Et3/0         192.168.10.0   /24    1     66
Et0/0.1       0.0.0.0        /0   Et1/0.1       172.16.30.0    /24    1     66
Et2/0         0.0.0.0        /0   Et3/0         192.168.10.0   /24    1     66
Et0/0.1       0.0.0.0        /0   Et1/0.1       172.16.30.0    /24    1     67
Et2/0         0.0.0.0        /0   Et3/0         192.168.10.0   /24    1     67
Et0/0.1       0.0.0.0        /0   Et1/0.1       172.16.10.0    /24    1     66
Et0/0.1       0.0.0.0        /0   Et1/0.1       172.16.10.0    /24    1     66
Et2/0         0.0.0.0        /0   Et3/0         192.168.10.0   /24    1     67
Router#
The following is a sample display of an prefix port aggregation cache for the prefix mask 172.16.0.0 255.255.0.0 with the show ip cache 172.16.0.0 255.255.0.0 flow aggregation prefix-port command:
Router# show ip cache 172.16.0.0 255.255.0.0 flow aggregation prefix-port
IP Flow Switching Cache, 278544 bytes
  21 active, 4075 inactive, 105 added
  33939 ager polls, 0 flow alloc failures
  Active flows timeout in 5 minutes
  Inactive flows timeout in 15 seconds
IP Sub Flow Cache, 25736 bytes
  0 active, 1024 inactive, 0 added, 0 added to flow
  0 alloc failures, 0 force free
  1 chunk, 1 chunk added
Src If        Src Prefix     Msk  Dst If        Dst Prefix     Msk Flows  Pkts
Et0/0.1       0.0.0.0        /0   Et1/0.1       172.16.10.0    /24    6    404
Et0/0.1       0.0.0.0        /0   Et1/0.1       172.16.30.0    /24    3    203
Et0/0.1       0.0.0.0        /0   Et1/0.1       172.16.30.0    /24    3    203
Et0/0.1       0.0.0.0        /0   Et1/0.1       172.16.30.0    /24    3    202
Et0/0.1       0.0.0.0        /0   Et1/0.1       172.16.10.0    /24    3    203
Et0/0.1       0.0.0.0        /0   Et1/0.1       172.16.30.0    /24    3    201
Et0/0.1       0.0.0.0        /0   Et1/0.1       172.16.30.0    /24    3    202
Et0/0.1       0.0.0.0        /0   Et1/0.1       172.16.10.0    /24    3    202
Et0/0.1       0.0.0.0        /0   Et1/0.1       172.16.10.0    /24    3    202
Et0/0.1       172.16.6.0     /24  Null          224.0.0.0      /24    2      6
Et0/0.1       0.0.0.0        /0   Et1/0.1       172.16.10.0    /24    3    203
Et0/0.1       0.0.0.0        /0   Et1/0.1       172.16.30.0    /24    3    203
Et0/0.1       0.0.0.0        /0   Et1/0.1       172.16.30.0    /24    3    203
Et0/0.1       0.0.0.0        /0   Et1/0.1       172.16.10.0    /24    3    202
Et0/0.1       0.0.0.0        /0   Et1/0.1       172.16.10.0    /24    3    203
Router#
The following is a sample display of an protocol port aggregation cache with the show ip cache flow aggregation protocol-port command:
Router# show ip cache flow aggregation protocol-port
IP Flow Switching Cache, 278544 bytes
  19 active, 4077 inactive, 627 added
  150070 ager polls, 0 flow alloc failures
  Active flows timeout in 5 minutes
  Inactive flows timeout in 300 seconds
IP Sub Flow Cache, 25736 bytes
  0 active, 1024 inactive, 0 added, 0 added to flow
  0 alloc failures, 0 force free
  1 chunk, 2 chunks added
Protocol  Source Port  Dest Port  Flows  Packets  Bytes/Packet  Active
  0x01       0x0000      0x0000      4      270        28        242.4
  0x01       0x0000      0x0000      8      541       290        244.4
  0x06       0x0041      0x0041      4      271      1140        243.3
  0x06       0x0041      0x0041      4      271      1140        243.4
  0x11       0x00A1      0x00A1      4      271       156        243.4
  0x11       0x0043      0x0043      4      271       156        243.4
  0x06       0x00B3      0x00B3      4      271      1140        243.4
  0x06       0x0035      0x0035      4      270      1140        242.5
  0x11       0x0045      0x0045      4      271       156        243.3
  0x06       0x0016      0x0015      4      270       840        242.5
  0x06       0x0016      0x0015     12      810       840        244.5
  0x06       0x0077      0x0077      4      271      1340        243.3
  0x01       0x0000      0x0800      4      270      1500        242.5
  0x06       0x0019      0x0019      4      271       168        243.4
  0x06       0x0089      0x0089      4      271       296        243.4
  0x11       0x0208      0x0208      3        9        72        222.1
  0x06       0x00DC      0x00DC      4      271      1140        243.4
  0x06       0x006E      0x006E      4      271       296        243.4
  0x06       0x027C      0x027C      4      271      1240        243.4
Router#
The table below describes the significant fields shown in the output of the show ip cache flow aggregation command.
| Table 7 | Field Descriptions for the show ip cache flow aggregation command |
|
Field |
Description |
|---|---|
|
bytes |
Number of bytes of memory used by the NetFlow cache. |
|
active |
Number of active flows in the NetFlow cache at the time this command was entered. |
|
inactive |
Number of flow buffers that are allocated in the NetFlow cache, but are not currently assigned to a specific flow at the time this command is entered. |
|
added |
Number of flows created since the start of the summary period. |
|
ager polls |
Number of times the NetFlow code looked at the cache to cause entries to expire. (Used by Cisco for diagnostics only.) |
|
Src If |
Specifies the source interface. |
|
Src AS |
Specifies the source autonomous system. |
|
Src Prefix |
The prefix for the source IP addresses. |
|
Msk |
The numbers of bits in the source or destination prefix mask. |
|
Dst If |
Specifies the destination interface. |
|
AS |
Autonomous system. This is the source or destination AS number as appropriate for the keyword used. For example, if you enter the show ip cache flow aggregation destination-prefix-tos command, this is the destination AS number. |
|
TOS |
The value in the type of service (ToS) field in the packets. |
|
Dst AS |
Specifies the destination autonomous system. |
|
Dst Prefix |
The prefix for the destination IP addresses |
|
Flows |
Number of flows. |
|
Pkts |
Number of packets. |
|
B/Pk |
Average number of bytes observed for the packets seen for this protocol (total bytes for this protocol or the total number of flows for this protocol for this summary period). |
|
Active |
The time in seconds that this flow has been active at the time this command was entered. |
|
Protocol |
IP protocol "well-known" port number, displayed in hexadecimal format. (Refer to http://www.iana.org , Protocol Assignment Number Services , for the latest RFC values.) |
|
Source Port |
The source port value in hexadecimal. |
|
Dest Port |
The destination port value in hexadecimal. |
|
Packets |
The number of packets sene in the aggregated flow. |
|
Bytes/Packet |
The average size of packets sene in the aggregated flow. |
Related Commands
|
Command |
Description |
|---|---|
|
cache |
Defines operational parameters for NetFlow accounting aggregation caches. |
|
enabled (aggregation cache) |
Enables a NetFlow accounting aggregation cache. |
|
export destination (aggregation cache) |
Enables the exporting of NetFlow accounting information from NetFlow aggregation caches. |
|
ip flow-aggregation cache |
Enables NetFlow accounting aggregation cache schemes. |
|
mask (IPv4) |
Specifies the source or destination prefix mask for a NetFlow accounting prefix aggregation cache. |
|
show ip cache flow aggregation |
Displays a summary of the NetFlow aggregation cache accounting statistics. |
|
show ip cache verbose flow |
Displays a detailed summary of the NetFlow accounting statistics. |
|
show ip flow export |
Displays the statistics for the data export. |
|
show ip flow interface |
Displays NetFlow accounting configuration for interfaces. |
show ip cache verbose flow
To display a detailed summary of the NetFlow accounting statistics, use the show ip cache verbose flow command in user EXEC or privileged EXEC mode.
Command History
|
Release |
Modification |
|---|---|
|
11.1 |
This command was introduced. |
|
11.1CA |
The information display for the command was updated. |
|
12.3(1) |
Support for the NetFlow Multicast Support feature was added. |
|
12.0(24)S |
Multiprotocol Label Switching (MPLS) flow records were added to the command output. |
|
12.3(4)T |
The execute-on command was implemented on the Cisco 7500 platforms to include the remote execution of the show ip cache verbose flowcommand. |
|
12.3(6) |
This command was integrated into Cisco IOS Release 12.3(6). |
|
12.2(14)S |
This command was integrated into Cisco IOS Release 12.2(14)S. |
|
12.2(18)S |
Support for the NetFlow Multicast Support feature was added. |
|
12.3(8)T |
MPLS flow records were added to the command output for Cisco IOS Release 12.3(8)T. |
|
12.3(11)T |
Support for egress flow accounting was added, and the [prefix mask] and [type number] arguments were removed. |
|
12.3(14)T |
Support for NetFlow Layer 2 and Security Monitoring Exports was added. |
|
12.2(27)SBC |
This command was integrated into Cisco IOS Release 12.2(27)SBC. |
|
12.2(14)SX |
Support for this command was introduced on the Supervisor Engine 720. |
|
12.2(17b)SXA |
The output was changed to include hardware-entry information. |
|
12.2(17d)SXB |
Support for this command on the Supervisor Engine 2 was extended to the 12.2 SX release. |
|
12.2(18)SXE |
The output was changed to add fragment offset (FO) information on the Supervisor Engine 720 only. |
|
12.2(18)SXF |
This command was integrated into Cisco IOS Release 12.2(18)SXF. |
|
12.2(33)SRA |
This command was integrated into Cisco IOS Release 12.2(33)SRA. |
|
12.2(31)SB2 |
This command was integrated into Cisco IOS Release 12.2(31)SB2. |
Usage Guidelines
Use the show ip cache verbose flowcommand to display flow record fields in the NetFlow cache in addition to the fields that are displayed with the show ip cache flowcommand. The values in the additional fields that are shown depend on the NetFlow features that are enabled and the flags that are set in the flow.
Note | The flags, and therefore the fields, might vary from flow to flow. |
Some of the content in the display of the show ip cache verbose flowcommand uses multiline headings and multiline data fields. The figure below uses an example of the output from the show ip cache verbose flowto show how to associate the headings with the correct data fields when there are two or more lines of headings and two or more lines of data fields. The first line of the headings is associated with the first line of data fields. The second line of the headings is associated with the second line of data fields, and so on.
When other features such as IP Multicast are configured, the number of lines in the headings and data fields increases. The method for associating the headings with the correct data fields remains the same.
NetFlow Multicast Support
When the NetFlow Multicast Support feature is enabled, the show ip cache verbose flow command displays the number of replicated packets and the packet byte count for NetFlow multicast accounting. When you configure the NetFlow Version 9 Export Format feature, this command displays additional NetFlow fields in the header.
MPLS-aware NetFlow
When you configure the MPLS-aware NetFlow feature, you can use the show ip cache verbose flow command to display both the IP and MPLS portions of MPLS flows in the NetFlow cache on a router line card. To display the IP portion of the flow record in the NetFlow cache when MPLS-aware NetFlow is configured, use the show ip cache flow command. NetFlow accounts for locally destined MPLS to IP VPN packets and displays the destination interface as Null instead of Local for these packets.
NetFlow BGP Nexthop
The NetFlow bgp-nexthop command can be configured when either the Version 5 export format or the Version 9 export format is configured. The following caveats apply to the bgp-nexthop command:
- The values for the BGP nexthop IP address are exported to a NetFlow collector only when the Version 9 export format is configured.
- In order for the BGP information to be populated in the main cache you must either have a NetFlow export destination configured or NetFlow aggregation configured.
Displaying Detailed NetFlow Cache Information on Platforms Running Distributed Cisco Express Forwarding
On platforms running distributed Cisco Express Forwarding, NetFlow cache information is maintained on each line card or Versatile Interface Processor. If you want to use the show ip cache verbose flow command to display this information on a distributed platform, you must enter the command at a line card prompt.
Cisco 7600 Series Platforms
The module number keyword and argument are supported on Distributed Forwarding Card-equipped (DFC) modules only.
Cisco 7500 Series Platform
The Cisco 7500 series platforms are not supported by Cisco IOS Release 12.4T and later. Cisco IOS Release 12.4 is the last Cisco IOS release to support the Cisco 7500 series platforms.
To display detailed NetFlow cache information on a Cisco 7500 series router that is running distributed Cisco Express Forwarding, enter the following sequence of commands:
Router# if-con

slot-number
LC-
slot-number
# show ip cache verbose
 flow
For Cisco IOS Releases 12.3(4)T, 12.3(6), and 12.2(20)S and later, enter the following command to display detailed NetFlow cache information:
Router# execute-on
slot-number
show ip cache verbose
 flow
Gigabit Switch Router (GSR)
To display detailed NetFlow cache information on a Gigabit Switch Router, enter the following sequence of commands:
Router# attach

slot-number
LC-
slot-number
# show ip cache verbose
 flow
For Cisco IOS Releases 12.3(4)T, 12.3(6), and 12.2(20)S and later, enter the following command to display detailed NetFlow cache information:
Router# execute-on
slot-number
show ip cache verbose
 flow
Examples
The following is sample output from the show ip cache verbose flow command:
Router# show ip cache verbose flow
IP packet size distribution (25229 total packets):
   1-32   64   96  128  160  192  224  256  288  320  352  384  416  448  480
   .000 .000 .000 .000 .000 .000 .000 .000 .000 .000 .000 .000 .000 .000 .000
    512  544  576 1024 1536 2048 2560 3072 3584 4096 4608
   .000 .000 .000 .206 .793 .000 .000 .000 .000 .000 .000
The preceding output shows the percentage distribution of packets by size. In this display, 20.6 percent of the packets fall in the 1024-byte size range and 79.3 percent fall in the 1536-byte range.
The next section of the output can be divided into three sections. The section and the table corresponding to each are as follows:
IP Flow Switching Cache, 278544 bytes
  6 active, 4090 inactive, 17 added
  505 ager polls, 0 flow alloc failures
  Active flows timeout in 1 minutes
  Inactive flows timeout in 10 seconds
IP Sub Flow Cache, 25736 bytes
  12 active, 1012 inactive, 39 added, 17 added to flow
  0 alloc failures, 0 force free
  1 chunk, 1 chunk added
  last clearing of statistics never
Protocol         Total    Flows   Packets Bytes  Packets Active(Sec) Idle(Sec)
--------         Flows     /Sec     /Flow  /Pkt     /Sec     /Flow     /Flow
TCP-Telnet           1      0.0       362   940      2.7      60.2       0.0
TCP-FTP              1      0.0       362   840      2.7      60.2       0.0
TCP-FTPD             1      0.0       362   840      2.7      60.1       0.1
TCP-SMTP             1      0.0       361  1040      2.7      60.0       0.1
UDP-other            5      0.0         1    66      0.0       1.0      10.6
ICMP                 2      0.0      8829  1378    135.8      60.7       0.0
Total:              11      0.0      1737  1343    147.0      33.4       4.8
SrcIf          SrcIPaddress    DstIf          DstIPaddress    Pr TOS Flgs  Pkts
Port Msk AS                    Port Msk AS    NextHop              B/Pk  Active
Et0/0.1        10.251.138.218  Et1/0.1        172.16.10.2     06 80  00      65
0015 /0  0                     0015 /0  0     0.0.0.0               840    10.8
MAC: (VLAN id) aaaa.bbbb.cc03  (005)          aaaa.bbbb.cc06  (006)
Min plen:      840                            Max plen:       840
Min TTL:        59                            Max TTL:         59
IP id:           0
Et0/0.1        172.16.6.1      Et1/0.1        172.16.10.2     01 00  00    4880
0000 /0  0                     0000 /0  0     0.0.0.0              1354    20.1
MAC: (VLAN id) aaaa.bbbb.cc03  (005)          aaaa.bbbb.cc06  (006)
Min plen:      772                            Max plen:       1500
Min TTL:       255                            Max TTL:        255
ICMP type:       0                            ICMP code:        0
IP id:        2943                            FO:            185
Et2/0          192.168.137.78  Et3/0*         192.168.10.67   06 80  00       3
0041 /0  0                     0041 /24 0     172.17.7.2           1140     1.8
FFlags: 01
MAC: (VLAN id) aabb.cc00.2002  (000)          aabb.cc00.2201  (000)
Min TTL:        59                            Max TTL:         59
IP id:           0
Et0/0.1        10.10.13.1      Et1/0.1        172.16.10.2     06 80  00      65
0017 /0  0                     0017 /0  0     0.0.0.0               940    10.8
MAC: (VLAN id) aaaa.bbbb.cc03  (005)          aaaa.bbbb.cc06  (006)
Min plen:      940                            Max plen:       940
Min TTL:        59                            Max TTL:         59
IP id:           0
Et2/0          10.234.53.1     Et3/0*         192.168.10.32   06 80  00       3
0016 /0  0                     0015 /24 0     172.17.7.2            840     1.7
FFlags: 01
MAC: (VLAN id) aabb.cc00.2002  (000)          aabb.cc00.2201  (000)
Min TTL:        59                            Max TTL:         59
IP id:           0
Et0/0.1        10.106.1.1      Et1/0.1        172.16.10.2     01 00  00    1950
0000 /0  0                     0000 /0  0     0.0.0.0              1354     8.6
MAC: (VLAN id) aaaa.bbbb.cc03  (005)          aaaa.bbbb.cc06  (006)
Min plen:      772                            Max plen:       1500
Min TTL:         59                           Max TTL:          59
ICMP type:       0                            ICMP code:        0
IP id:       13499                            FO:            185
Et2/0          10.10.18.1      Et3/0*         192.168.10.162  11 80  10       4
0045 /0  0                     0045 /24 0     172.17.7.2            156     2.7
FFlags: 01
MAC: (VLAN id) aabb.cc00.2002  (000)          aabb.cc00.2201  (000)
Min TTL:        59                            Max TTL:         59
IP id:           0
Note | The asterisk (*) immediately following the "DstIf" field indicates that the flow being shown is an egress flow. |
The table below describes the significant fields shown in the NetFlow cache section of the output.
| Table 8 | Field Descriptions in the NetFlow Cache Section of the Output |
|
Field |
Description |
|---|---|
|
bytes |
Number of bytes of memory used by the NetFlow cache. |
|
active |
Number of active flows in the NetFlow cache at the time this command was entered. |
|
inactive |
Number of flow buffers that are allocated in the NetFlow cache but that were not assigned to a specific flow at the time this command was entered. |
|
added |
Number of flows created since the start of the summary period. |
|
ager polls |
Number of times the NetFlow code caused entries to expire (used by Cisco for diagnostics only). |
|
flow alloc failures |
Number of times the NetFlow code tried to allocate a flow but could not. |
|
last clearing of statistics |
The period of time that has passed since the clear ip flow stats privileged EXEC command was last executed. The standard time output format of hours, minutes, and seconds (hh:mm:ss) is used for a period of time less than 24 hours. This time output changes to hours and days after the time exceeds 24 hours. |
The table below describes the significant fields shown in the activity by protocol section of the output.
| Table 9 | Field Descriptions in the Activity by Protocol Section of the Output |
|
Field |
Description |
|---|---|
|
Protocol |
The types of IP protocols that are in the flows. |
|
Total Flows |
Number of flows in the cache for this protocol since the last time the statistics were cleared. |
|
Flows/Sec |
Average number of flows for this protocol per second; equal to the total flows divided by the number of seconds for this summary period. |
|
Packets/Flow |
Average number of packets for the flows for this protocol; equal to the total packets for this protocol divided by the number of flows for this protocol for this summary period. |
|
Bytes/Pkt |
Average number of bytes for the packets for this protocol; equal to the total bytes for this protocol divided by the total number of packets for this protocol for this summary period. |
|
Packets/Sec |
Average number of packets for this protocol per second; equal to the total packets for this protocol divided by the total number of seconds for this summary period. |
|
Active(Sec)/Flow |
Number of seconds from the first packet to the last packet of an expired flow divided by the number of total flows for this protocol for this summary period. |
|
Idle(Sec)/Flow |
Number of seconds observed from the last packet in each nonexpired flow for this protocol until the time at which the show ip cache verbose flow command was entered divided by the total number of flows for this protocol for this summary period. |
The table below describes the significant fields in the NetFlow record section of the output.
| Table 10 | Field Descriptions for the NetFlow Record Section of the Output |
|
Field |
Description |
||
|---|---|---|---|
|
SrcIf |
Interface on which the packet was received. |
||
|
Port Msk AS |
Source port number (displayed in hexadecimal format), IP address mask, and autonomous system number. The value of this field is always set to 0 in MPLS flows. |
||
|
SrcIPaddress |
IP address of the device that transmitted the packet. |
||
|
DstIf |
Interface from which the packet was transmitted.
|
||
|
Port Msk AS |
Destination port number (displayed in hexadecimal format), IP address mask, and autonomous system. This is always set to 0 in MPLS flows. |
||
|
DstIPaddress |
IP address of the destination device. |
||
|
NextHop |
The BGP next-hop address. This is always set to 0 in MPLS flows. |
||
|
Pr |
IP protocol "well-known" port number, displayed in hexadecimal format. (Refer to http://www.iana.org , Protocol Assignment Number Services , for the latest RFC values.) |
||
|
ToS |
Type of service, displayed in hexadecimal format. |
||
|
B/Pk |
Average number of bytes observed for the packets seen for this protocol. |
||
|
Flgs |
TCP flags, shown in hexadecimal format (result of bitwise OR of TCP flags from all packets in the flow). |
||
|
Pkts |
Number of packets in this flow. |
||
|
Active |
The time in seconds that this flow has been active at the time this command was entered. |
||
|
MAC |
Source and destination MAC addresses from the Layer 2 frames in the flow. |
||
|
VLAN id |
Source and destination VLAN IDs from the Layer 2 frames in the flow. |
||
|
Min plen |
Minimum packet length for the packets in the flows.
|
||
|
Max plen |
Maximum packet length for the packets in the flows.
|
||
|
Min TTL |
Minimum Time-To-Live (TTL) for the packets in the flows.
|
||
|
Max TTL |
Maximum TTL for the packets in the flows.
|
||
|
IP id |
IP identifier field for the packets in the flow. |
||
|
ICMP type |
Internet Control Message Protocol (ICMP) type field from the ICMP datagram in the flow. |
||
|
ICMP code |
ICMP code field from the ICMP datagram in the flow. |
||
|
FO |
Value of the fragment offset field from the first fragmented datagram in the second flow. |
The following example shows the NetFlow output from the show ip cache verbose flow command in which the sampler, class ID, and general flags are set. What is displayed for a flow depends on what flags are set in the flow. If the flow was captured by a sampler, the output shows the sampler ID. If the flow was marked by Modular QoS CLI (MQC), the display includes the class ID. If any general flags are set, the output includes the flags.
Router# show ip cache verbose flow
.
.
.
SrcIf          SrcIPaddress    DstIf          DstIPaddress    Pr TOS Flgs  Pkts
Port Msk AS                    Port Msk AS    NextHop              B/Pk  Active
BGP: BGP NextHop
Et1/0          10.8.8.8         Et0/0*         10.9.9.9         01 00  10       3
0000 /8  302                   0800 /8  300   10.3.3.3               100     0.1
BGP: 2.2.2.2         Sampler: 1  Class: 1  FFlags: 01
The table below describes the significant fields shown in the NetFlow output for a sampler, for an MQC policy class, and for general flags.
| Table 11 | show ip cache verbose flow Field Descriptions for a NetFlow Sampler, an MCQ Policy Class, and General Flags |
|
Field (with Sample Values) |
Description |
|---|---|
|
Sampler |
ID of the sampler that captured the flow. The sampler ID in this example is 1. |
|
Class |
ID of the Modular QoS CLI (MQC) traffic class. The class ID in this example is 1. |
|
FFlags |
General flow flag (shown in hexadecimal format), which is either the bitwise or one or more of the following:
The flow flag in this example is 01 (an egress flow). |
The following example shows the NetFlow output from the show ip cache verbose flowcommand when NetFlow BGP next-hop accounting is enabled:
Router# show ip cache verbose flow

.
.
.
SrcIf          SrcIPaddress    DstIf          DstIPaddress    Pr TOS Flgs   Pkts
Port Msk AS                    Port Msk AS    NextHop              B/Pk   Active
BGP:BGP_NextHop
Et0/0/2        10.0.0.2        Et0/0/4        10.0.0.5        01 00  10      20
0000 /8  0                     0800 /8  0     10.0.0.6              100     0.0
BGP:26.0.0.6
Et0/0/2        10.0.0.2        Et0/0/4        10.0.0.7        01 00  10      20
0000 /8  0                     0800 /8  0     10.0.0.6              100     0.0
BGP:26.0.0.6
Et0/0/2        10.0.0.2        Et0/0/4        10.0.0.7        01 00  10      20
0000 /8  0                     0000 /8  0     10.0.0.6              100     0.0
BGP:26.0.0.6
The table below describes the significant fields shown in the NetFlow BGP next-hop accounting lines of the output.
| Table 12 | show ip cache verbose flow Field Descriptions in NetFlow BGP Next-Hop Accounting Output |
|
Field |
Description |
|---|---|
|
BGP:BGP_NextHop |
Destination address for the BGP next hop. |
The following example shows the NetFlow output from the show ip cache verbose flowcommand when NetFlow multicast accounting is configured:
Router# show ip cache verbose flow

.
.
.
SrcIf          SrcIPaddress    DstIf          DstIPaddress    Pr TOS Flgs  Pkts
Port Msk AS                    Port Msk AS    NextHop              B/Pk  Active
IPM:OPkts    OBytes
IPM:    0       0
Et1/1/1        10.0.0.1        Null           192.168.1.1       01 55  10     100
0000 /8  0                     0000 /0  0     0.0.0.0                28     0.0
IPM:  100    2800
Et1/1/1        10.0.0.1        Se2/1/1.16     192.168.1.1       01 55  10     100
0000 /8  0                     0000 /0  0     0.0.0.0                28     0.0
IPM:    0       0
Et1/1/2        10.0.0.1        Et1/1/4        192.168.2.2       01 55  10     100
0000 /8  0                     0000 /0  0     0.0.0.0                28     0.1
Et1/1/2        10.0.0.1        Null           192.168.2.2       01 55  10     100
0000 /8  0                     0000 /0  0     0.0.0.0                28     0.1
IPM:  100    2800
The table below describes the significant fields shown in the NetFlow multicast accounting lines of the output.
| Table 13 | show ip cache verbose flow Field Descriptions in NetFlow Multicast Accounting Output |
|
Field |
Description |
|---|---|
|
OPkts |
Number of IP multicast (IPM) output packets. |
|
OBytes |
Number of IPM output bytes. |
|
DstIPaddress |
Destination IP address for the IPM output packets. |
The following example shows the output for both the IP and MPLS sections of the flow record in the NetFlow cache when MPLS-aware NetFlow is enabled:
Router# show ip cache verbose flow
.
.
.
SrcIf          SrcIPaddress    DstIf          DstIPaddress    Pr TOS Flgs  Pkts
Port Msk AS                    Port Msk AS    NextHop              B/Pk  Active
PO3/0          10.1.1.1        PO5/1          10.2.1.1        01 00  10       9
0100 /0  0                     0200 /0  0     0.0.0.0               100     0.0
Pos:Lbl-Exp-S 1:12305-6-0 (LDP/10.10.10.10) 2:12312-6-1
The table below describes the significant fields for the IP and MPLS sections of the flow record in the output.
| Table 14 | show ip cache verbose flow Field Descriptions for the IP and MPLS Sections of the Flow Record in the Output |
|
Field |
Description |
|---|---|
|
Pos |
Position of the MPLS label in the label stack, starting with 1 as the top label. |
|
Lbl |
Value given to the MPLS label by the router. |
|
Exp |
Value of the experimental bit. |
|
S |
Value of the end-of-stack bit. Set to 1 for the oldest entry in the stack and to 0 for all other entries. |
|
LDP/10.10.10.10 |
Type of MPLS label and associated IP address for the top label in the MPLS label stack. |
Related Commands
|
Command |
Description |
|---|---|
|
attach |
Connects to a specific line card for the purpose of executing monitoring and maintenance commands on that line card only. |
|
clear ip flow stats |
Clears the NetFlow accounting statistics. |
|
execute-on |
Executes commands on a line card. |
|
show ip cache flow |
Displays a summary of the NetFlow accounting statistics. |
|
show ip flow interface |
Displays NetFlow accounting configuration for interfaces. |
|
show ip interface |
Displays the usability status of interfaces configured for IP. |
show ip cache verbose flow aggregation
To display the aggregation cache configuration, use the show ip cache verbose flow aggregation command in user EXEC and privileged EXEC mode.
Syntax Description
|
prefix mask |
(Optional) Displays only the entries in the cache that match the prefix and mask combination. |
||
|
interface-type interface-number |
(Optional) Displays only the entries in the cache that match the interface type and interface number combination. |
||
|
verbose |
(Optional) Displays additional information from the aggregation cache. |
||
|
as |
Displays the configuration of the autonomous system aggregation cache scheme. |
||
|
as-tos |
Displays the configuration of the autonomous system type of service (ToS) aggregation cache scheme. |
||
|
bgp-nexthop-tos |
Displays the BGP next hop and ToS aggregation cache scheme.
|
||
|
destination-prefix |
Displays the configuration of the destination prefix aggregation cache scheme. |
||
|
destination-prefix-tos |
Displays the configuration of the destination prefix ToS aggregation cache scheme. |
||
|
prefix |
Displays the configuration of the prefix aggregation cache scheme. |
||
|
prefix-port |
Displays the configuration of the prefix port aggregation cache scheme. |
||
|
prefix-tos |
Displays the configuration of the prefix ToS aggregation cache scheme. |
||
|
protocol-port |
Displays the configuration of the protocol port aggregation cache scheme. |
||
|
protocol-port-tos |
Displays the configuration of the protocol port ToS aggregation cache scheme. |
||
|
source-prefix |
Displays the configuration of the source prefix aggregation cache scheme. |
||
|
source-prefix-tos |
Displays the configuration of the source prefix ToS aggregation cache scheme. |
||
|
exp-bgp-prefix |
Displays the configuration of the exp-bgp-prefix aggregation cache scheme. |
Command History
|
Release |
Modification |
|---|---|
|
12.0(3)T |
This command was introduced. |
|
12.0(15)S |
This command was modified to include new show output for ToS aggregation schemes. |
|
12.2(14)S |
This command was integrated into Cisco IOS Release 12.2(14)S. |
|
12.3(1) |
Support for the BGP Next Hop Support feature was added. |
|
12.2(18)S |
Support for the BGP Next Hop Support feature was added. |
|
12.2(27)SBC |
This command was integrated into Cisco IOS Release 12.2(27)SBC. |
|
12.2(14)SX |
Support for this command was introduced on the Supervisor Engine 720. |
|
12.2(17b)SXA |
The output was changed to include hardware-entry information. |
|
12.2(17d)SXB |
Support for this command on the Supervisor Engine 2 was extended to the 12.2 SX release. |
|
12.2(18)SXE |
The output was changed to add fragment offset (FO) information on the Supervisor Engine 720 only. |
|
12.2(18)SXF |
This command was integrated into Cisco IOS Release 12.2(18)SXF. |
|
12.2(33)SRA |
This command was integrated into Cisco IOS Release 12.2(33)SRA. |
|
12.2(31)SB2 |
This command was integrated into Cisco IOS Release 12.2(31)SB2. The exp-bgp-prefix aggregation cache was added. |
Usage Guidelines
Use the show ip cache verbose flow aggregationcommand to display flow record fields in the NetFlow aggregation cache in addition to the fields that are displayed with the show ip cache flow aggregationcommand. The values in the additional fields that are shown depend on the NetFlow features that are enabled and the flags that are set in the flow.
Note | The flags, and therefore the fields, might vary from flow to flow. |
Some of the content in the display of the show ip cache verbose flow aggregationcommand uses multiline headings and multiline data fields. Figure 1 uses an example of the output from the show ip cache verbose flowto show how to associate the headings with the correct data fields when there are two or more lines of headings and two or more lines of data fields. The first line of the headings is associated with the first line of data fields. The second line of the headings is associated with the second line of data fields, and so on.
When other features such as IP Multicast are configured, the number of lines in the headings and data fields increases. The method for associating the headings with the correct data fields remains the same
NetFlow Multicast Support
When the NetFlow Multicast Support feature is enabled, the show ip cache verbose flow command displays the number of replicated packets and the packet byte count for NetFlow multicast accounting. When you configure the NetFlow Version 9 Export Format feature, this command displays additional NetFlow fields in the header.
MPLS-aware NetFlow
When you configure the MPLS-aware NetFlow feature, you can use the show ip cache verbose flowcommand to display both the IP and MPLS portions of MPLS flows in the NetFlow cache on a router line card. To display only the IP portion of the flow record in the NetFlow cache when MPLS-aware NetFlow is configured, use the show ip cache flowcommand.
NetFlow BGP Nexthop
The NetFlow bgp-nexthop command can be configured when either the Version 5 export format or the Version 9 export format is configured. The following caveats apply to the bgp-nexthop command:
- The values for the BGP nexthop IP address are exported to a NetFlow collector only when the Version 9 export format is configured.
- In order for the BGP information to be populated in the main cache you must either have a NetFlow export destination configured or NetFlow aggregation configured.
Displaying Detailed NetFlow Cache Information on Platforms Running Distributed Cisco Express Forwarding
On platforms running distributed Cisco Express Forwarding, NetFlow cache information is maintained on each line card or Versatile Interface Processor. If you want to use the show ip cache verbose flow command to display this information on a distributed platform, you must enter the command at a line card prompt.
Cisco 7600 Series Platforms
The module num keyword and argument are supported on DFC-equipped modules only.
Cisco 7500 Series Platform
The Cisco 7500 series platforms are not supported by Cisco IOS Release 12.4T and later. Cisco IOS Release 12.4 is the last Cisco IOS release to support the Cisco 7500 series platforms.
To display detailed NetFlow cache information on a Cisco 7500 series router that is running distributed Cisco Express Forwarding, enter the following sequence of commands:
Router# if-con

slot-number
LC-
slot-number
# show ip cache verbose
 flow
For Cisco IOS Releases 12.3(4)T, 12.3(6), and 12.2(20)S and later, enter the following command to display detailed NetFlow cache information:
Router# execute-on
slot-number
show ip cache verbose
 flow
Cisco 12000 Series Platform
To display detailed NetFlow cache information on a Cisco 12000 Series Internet Router, enter the following sequence of commands:
Router# attach

slot-number
LC-
slot-number
# show ip cache verbose
 flow
For Cisco IOS Releases 12.3(4)T, 12.3(6), and 12.2(20)S and later, enter the following command to display detailed NetFlow cache information:
Router# execute-on
slot-number
show ip cache verbose
 flow
Examples
The following is a sample display of an prefix port aggregation cache with the show ip cache verbose flow aggregation prefix-portcommand:
Router# show ip cache verbose flow aggregation prefix-port
IP Flow Switching Cache, 278544 bytes
  20 active, 4076 inactive, 377 added
  98254 ager polls, 0 flow alloc failures
  Active flows timeout in 5 minutes
  Inactive flows timeout in 15 seconds
IP Sub Flow Cache, 25736 bytes
  0 active, 1024 inactive, 0 added, 0 added to flow
  0 alloc failures, 0 force free
  1 chunk, 1 chunk added
Src If         Src Prefix      Dst If         Dst Prefix      TOS Flows    Pkts
               Port Msk                       Port Msk        Pr  B/Pk   Active
Et0/0.1        0.0.0.0         Et1/0.1        172.16.10.0     80     2     136
               0016 /0                        0015 /24        06   840    62.2
Et0/0.1        0.0.0.0         Et1/0.1        172.16.30.0     80     1      68
               00B3 /0                        00B3 /24        06  1140    60.3
Et0/0.1        0.0.0.0         Et1/0.1        172.16.30.0     80     1      68
               0043 /0                        0043 /24        11   156    60.3
Et0/0.1        0.0.0.0         Et1/0.1        172.16.30.0     00     1      68
               0000 /0                        0000 /24        01    28    60.3
Et0/0.1        0.0.0.0         Et1/0.1        172.16.10.0     80     1      68
               0035 /0                        0035 /24        06  1140    60.3
Et0/0.1        0.0.0.0         Et1/0.1        172.16.30.0     80     1      68
               0041 /0                        0041 /24        06  1140    60.3
Et2/0          0.0.0.0         Et3/0          192.168.10.0    80     1      68
               006E /0                        006E /24        06   296    60.3
FFlags: 01
Et0/0.1        0.0.0.0         Et1/0.1        172.16.30.0     80     1      68
               0016 /0                        0015 /24        06   840    60.3
Et0/0.1        0.0.0.0         Et1/0.1        172.16.10.0     00     1      68
               0000 /0                        0000 /24        01   554    60.3
Et0/0.1        0.0.0.0         Et1/0.1        172.16.10.0     80     1      68
               00A1 /0                        00A1 /24        11   156    60.3
Et0/0.1        0.0.0.0         Et1/0.1        172.16.10.0     80     1      67
               00DC /0                        00DC /24        06  1140    59.4
Et2/0          0.0.0.0         Et3/0          192.168.10.0    00     1      68
               0000 /0                        0000 /24        01    28    60.2
FFlags: 01
Et2/0          0.0.0.0         Et3/0          192.168.10.0    80     1      67
               0041 /0                        0041 /24        06  1140    59.4
FFlags: 01
Et0/0.1        0.0.0.0         Et1/0.1        172.16.30.0     80     1      68
               0019 /0                        0019 /24        06   168    60.3
Et2/0          0.0.0.0         Et3/0          192.168.10.0    80     1      68
               0016 /0                        0015 /24        06   840    60.3
FFlags: 01
Et0/0.1        0.0.0.0         Et1/0.1        172.16.30.0     80     1      67
               027C /0                        027C /24        06  1240    59.4
Et2/0          0.0.0.0         Et3/0          192.168.10.0    80     1      68
               0077 /0                        0077 /24        06  1340    60.2
FFlags: 01
Et0/0.1        0.0.0.0         Et1/0.1        172.16.10.0     00     1      68
               0000 /0                        0800 /24        01  1500    60.3
Et0/0.1        0.0.0.0         Et1/0.1        172.16.10.0     80     1      68
               0089 /0                        0089 /24        06   296    60.3
Et2/0          0.0.0.0         Et3/0          192.168.10.0    80     1      68
               0045 /0                        0045 /24        11   156    60.2
FFlags: 01
Router#
The table below describes the significant fields shown in the output of the show ip cache verbose flow aggregation prefix-port command.
| Table 15 | show ip cache verbose flow aggregation Field Descriptions |
|
Field |
Description |
|---|---|
|
Src If |
Specifies the source interface. |
|
Src AS |
Specifies the source autonomous system. |
|
Src Prefix |
The prefix for the source IP addresses. |
|
Msk |
The numbers of bits in the source or destination prefix mask. |
|
Dst If |
Specifies the destination interface. |
|
AS |
Autonomous system. This is the source or destination AS number as appropriate for the keyword used. For example, if you enter the show ip cache flow aggregation destination-prefix-tos command, this is the destination AS number. |
|
TOS |
The value in the type of service (ToS) field in the packets. |
|
Dst AS |
Specifies the destination autonomous system. |
|
Dst Prefix |
The prefix for the destination IP addresses |
|
Flows |
Number of flows. |
|
Pkts |
Number of packets. |
|
Port |
The source or destination port number. |
|
Msk |
The source or destination prefix mask. |
|
Pr |
IP protocol "well-known" port number, displayed in hexadecimal format. (Refer to http://www.iana.org , Protocol Assignment Number Services , for the latest RFC values.) |
|
B/Pk |
Average number of bytes observed for the packets seen for this protocol (total bytes for this protocol or the total number of flows for this protocol for this summary period). |
|
Active |
The time in seconds that this flow has been active at the time this command was entered. |
The following is a sample display of an exp-bgp-prefix aggregation cache with the show ip cache verbose flow aggregation exp-bgp-prefix command:
Router# show ip cache verbose flow aggregation exp-bgp-prefix
IP Flow Switching Cache, 278544 bytes
  1 active, 4095 inactive, 4 added
  97 ager polls, 0 flow alloc failures
  Active flows timeout in 30 minutes
  Inactive flows timeout in 15 seconds
IP Sub Flow Cache, 17032 bytes
  1 active, 1023 inactive, 4 added, 4 added to flow
  0 alloc failures, 0 force free
  1 chunk, 1 chunk added
Src If        BGP Nexthop     Label  MPLS EXP    Flows    Pkts   B/Pk    Active
Gi4/0/0.102   10.40.40.40     0      0           1        5      100     0.0
The table below describes the significant fields shown in the output of the show ip cache verbose flow aggregation exp-bgp-prefix command.
| Table 16 | show ip cache verbose flow aggregation Field Descriptions |
|
Field |
Description |
||
|---|---|---|---|
|
Src If |
Specifies the source interface. |
||
|
Flows |
Number of flows. |
||
|
Pkts |
Number of packets. |
||
|
B/Pk |
Average number of bytes observed for the packets seen for this protocol (total bytes for this protocol or the total number of flows for this protocol for this summary period). |
||
|
Active |
Number of active flows in the NetFlow cache at the time this command was entered. |
||
|
BGP Nexthop |
The exit point from the MPLS cloud. |
||
|
Label |
The MPLS label value.
|
||
|
MPLS EXP |
The 3-bit value of the MPLS labels EXP field. |
Related Commands
|
Command |
Description |
|---|---|
|
cache |
Defines operational parameters for NetFlow accounting aggregation caches. |
|
enabled (aggregation cache) |
Enables a NetFlow accounting aggregation cache. |
|
export destination (aggregation cache) |
Enables the exporting of NetFlow accounting information from NetFlow aggregation caches. |
|
ip flow-aggregation cache |
Enables NetFlow accounting aggregation cache schemes. |
|
mask (IPv4) |
Specifies the source or destination prefix mask for a NetFlow accounting prefix aggregation cache. |
|
show ip cache flow aggregation |
Displays a summary of the NetFlow aggregation cache accounting statistics. |
|
show ip cache verbose flow |
Displays a detailed summary of the NetFlow accounting statistics. |
|
show ip flow export |
Displays the statistics for the data export. |
|
show ip flow interface |
Displays NetFlow accounting configuration for interfaces. |
show ip flow export
To display the status and the statistics for NetFlow accounting data export, including the main cache and all other enabled caches, use the show ip flow export command in user EXEC or privileged EXEC mode.
Syntax Description
|
sctp |
(Optional) Displays the status and statistics for export destinations that are configured to use the Stream Control Transmission Protocol (SCTP). |
|
verbose |
(Optional) Displays the current values for the SCTP fail-over and restore-time timers in addition to the status and statistics that are displayed by the show ip flow export sctpcommand. For a Multiprotocol Label Switching (MPLS) Prefix/Application/Label (PAL) record, displays additional export information, such as the number of MPLS PAL records exported to a NetFlow collector. |
|
template |
(Optional) Displays the data export statistics (such as template timeout and refresh rate) for the template-specific configurations. |
|
nbar |
(Optional) Displays cumulative Network-Based Application Recognition (NBAR) statistics. |
Command History
|
Release |
Modification |
|---|---|
|
11.1CC |
This command was introduced. |
|
12.2(2)T |
This command was modified to display multiple NetFlow export destinations. |
|
12.0(24)S |
The template keyword was added. |
|
12.3(1) |
Support for the NetFlow v9 Export Format feature was added. |
|
12.2(14)S |
This command was integrated into Cisco IOS Release 12.2(14)S. |
|
12.2(18)S |
Support for the NetFlow v9 Export Format, and Multiple Export Destination features was added. |
|
12.2(27)SBC |
This command was integrated into Cisco IOS Release 12.2(27)SBC. |
|
12.2(14)SX |
Support for this command was introduced on the Supervisor Engine 720. |
|
12.2(18)SXD |
The output was changed to include information about NDE for hardware-switched flows. |
|
12.2(18)SXF |
This command was integrated into Cisco IOS Release 12.2(18)SXF. |
|
12.4(4)T |
The sctp and verbose keywords were added. |
|
12.2(28)SB |
The number of MPLS PAL records exported by NetFlow was added to the verbose keyword output. |
|
12.2(33)SRA |
This command was integrated into Cisco IOS Release 12.2(33)SRA. |
|
12.2(31)SB2 |
This command was integrated into Cisco IOS Release 12.2(31)SB2. |
|
12.2(33)SXI |
The output was modified to display the data export version and aggregation cache scheme. |
|
12.4(24)T |
The output was modified to display information about Border Gateway Protocol (BGP) next-hop. |
|
12.2(18)ZYA2 |
This command was modified. The nbarkeyword was added. |
Examples
The following is sample output from the show ip flow export command with NetFlow export over User Datagram Protocol (UDP) (the default NetFlow export transport protocol) configured on the networking device:
Note | No NetFlow export over SCTP destinations are configured. |
Router# show ip flow export
Flow export v9 is enabled for main cache
  Exporting flows to 172.17.10.2 (100)
  Exporting using source interface Loopback0
  Version 9 flow records, origin-as bgp-nexthop
  Cache for as aggregation v9
  62 flows exported in 17 udp datagrams
  0 flows failed due to lack of export packet
  8 export packets were sent up to process level
  0 export packets were dropped due to no fib
  0 export packets were dropped due to adjacency issues
  0 export packets were dropped due to fragmentation failures
  0 export packets were dropped due to encapsulation fixup failures
  0 export packets were dropped enqueuing for the RP
  0 export packets were dropped due to IPC rate limiting
  0 export packets were dropped due to output drops
The following is sample output from the show ip flow export command with NetFlow export over UDP and NetFlow SCTP export destinations configured:
Router# show ip flow export

Flow export v9 is enabled for main cache
  Exporting flows to 172.17.10.2 (100)
  Exporting flows to 172.16.45.57 (100) via SCTP
  Exporting using source interface Loopback0
  Version 9 flow records, origin-as bgp-nexthop
  Cache for as aggregation v9
    Exporting flows to 192.168.247.198 (200) via SCTP
    Exporting using source IP address 172.16.254.254
  479 flows exported in 318 udp datagrams
  467 flows exported in 315 sctp messages
  0 flows failed due to lack of export packet
  159 export packets were sent up to process level
  0 export packets were dropped due to no fib
  0 export packets were dropped due to adjacency issues
  0 export packets were dropped due to fragmentation failures
  0 export packets were dropped due to encapsulation fixup failures
The table below describes the significant fields shown in the display of the show ip flow export command.
| Table 17 | show ip flow export Field Descriptions |
|
Field |
Description |
||
|---|---|---|---|
|
Exporting flows to |
Indicates the export destinations and ports. The ports are in parentheses.
|
||
|
Exporting using source IP address or Exporting using source interface |
Indicates the source IP address or source interface.
|
||
|
Version flow records |
Displays the version of the flow records. |
||
|
Cache for destination-prefix aggregation |
Indicates the type of NetFlow aggregation caches that are configured.
|
||
|
Flows exported in udp datagrams |
Indicates the total number of export packets (datagrams) sent over UDP, and the total number of flows contained within them. |
||
|
Flows exported in sctp messages |
Displays the total number of export packets (messages) sent over SCTP, and the total number of flows contained within them.
|
||
|
Flows failed due to lack of export packet |
Indicates the number of flows that failed because no memory was available to create an export packet. |
||
|
Export packets were sent up to process level |
The packet could not be processed by Cisco Express Forwarding or by fast switching. |
||
|
Export packets were dropped due to no fib Export packets were dropped due to adjacency issues |
Indicates the number of packets that Cisco Express Forwarding was unable to switch, or forward to the process level. |
||
|
Export packets were dropped due to fragmentation failures Export packets were dropped due to encapsulation fixup failures |
Indicates the number of packets that were dropped because of problems constructing the IP packet. |
||
|
Export packets were dropped enqueuing for the RP Export packets were dropped due to IPC rate limiting |
Indicates the number of times that there was a problem transferring the export packet between the RP and the line card. |
||
|
Export packets were dropped due to output drops |
Indicates the number of times the packets were dropped when the send queue was full. |
The following is sample output from the show ip flow export sctp command with NetFlow SCTP export primary and backup SCTP export destinations configured for the NetFlow main cache and the NetFlow destination-prefix aggregation cache. The primary SCTP export destinations are active:
Router# show ip flow export sctp

IPv4 main cache exporting to 172.16.45.57, port 100, none
status: connected
backup mode: fail-over
912 flows exported in 619 sctp messages.
0 packets dropped due to lack of SCTP resources
fail-over time: 25 milli-seconds
restore time:   25 seconds
backup: 192.168.247.198, port 200
   status: not connected
   fail-overs: 2
   9 flows exported in 3 sctp messages.
   0 packets dropped due to lack of SCTP resources
destination-prefix cache exporting to 172.16.12.200, port 100, full
status: connected
backup mode: redundant
682 flows exported in 611 sctp messages.
0 packets dropped due to lack of SCTP resources
fail-over time: 25 milli-seconds
restore time:   25 seconds
backup: 192.168.247.198, port 200
   status: connected
   fail-overs: 8
   2 flows exported in 2 sctp messages.
   0 packets dropped due to lack of SCTP resources
The following is sample output from the show ip flow export sctp command with NetFlow SCTP export primary and backup SCTP export destinations configured for the NetFlow main cache and the NetFlow destination-prefix aggregation cache. The backup SCTP export destinations are active because the primary SCTP export destinations are unavailable.
Router# show ip flow export sctp

IPv4 main cache exporting to 172.16.45.57, port 100, none
status: fail-over
backup mode: fail-over
922 flows exported in 625 sctp messages.
0 packets dropped due to lack of SCTP resources
fail-over time: 25 milli-seconds
restore time:   25 seconds
backup: 192.168.247.198, port 200
   status: connected, active for 00:00:24
   fail-overs: 3
   11 flows exported in 4 sctp messages.
   0 packets dropped due to lack of SCTP resources
destination-prefix cache exporting to 172.16.12.200, port 100, full
status: fail-over
backup mode: redundant
688 flows exported in 617 sctp messages.
0 packets dropped due to lack of SCTP resources
fail-over time: 25 milli-seconds
restore time:   25 seconds
backup: 192.168.247.198, port 200
   status: connected, active for 00:00:00
   fail-overs: 13
   2 flows exported in 2 sctp messages.
   0 packets dropped due to lack of SCTP resources
Router#
The table below describes the significant fields shown in the display of the show ip flow export sctp and the show ip flow export sctp verbosecommands.
| Table 18 | show ip flow export sctp Field Descriptions |
|
Field |
Description |
||
|---|---|---|---|
|
IPv4 main cache exporting to 172.16.45.57, port 100, none |
Indicates the type of cache, the IP address and port number used to reach the destination, and the level of reliability for the association:
|
||
|
status |
The current state of each association. The states are:
|
||
|
backup mode |
The backup mode of each association. The modes are:
|
||
|
flows exported in sctp messages |
Indicates the total number of export packets (messages) sent over SCTP, and the total number of flows contained within them.
|
||
|
packets dropped due to lack of SCTP resources |
The number of packets that were dropped due to lack of SCTP resources. |
||
|
fail-over time: milli-seconds |
The period of time that the networking device waits after losing connectivity to the primary SCTP export destination before attempting to use a backup SCTP export destination.
|
||
|
restore time: seconds |
The period of time that the networking device waits before reverting to the primary SCTP export destination after connectivity to it has been restored.
|
||
|
backup: 192.168.247.198 port 200 |
The IP address and SCTP port used for the SCTP export backup destination.
|
||
|
fail-overs |
The number of times that fail-over has occurred. |
||
|
destination-prefix cache exporting to 172.16.12.200, port 100, full |
Indicates the type of cache configures, the destination address and port number for the SCTP export, and the level of reliability for the association:
|
The following is sample output from the show ip flow export templatecommand:
Router# show ip flow export template
   Template Options Flag = 1
   Total number of Templates added = 4
   Total active Templates = 4
   Flow Templates active = 3
   Flow Templates added = 3
   Option Templates active = 1
   Option  Templates added = 1
   Template ager polls = 2344
   Option Template ager polls = 34
Main cache version 9 export is enabled
 Template export information
   Template timeout = 30
   Template refresh rate = 20
 Option export information
   Option timeout = 800
   Option refresh rate = 300
Aggregation cache destination-prefix version 9 export is enabled
 Template export information
   Template timeout = 30
   Template refresh rate = 20
 Option export information
   Option timeout = 30
   Option refresh rate = 20
The table below describes the significant fields shown in the display of the show ip flow export templatecommand.
| Table 19 | show ip flow export template Field Descriptions |
|
Field |
Description |
||
|---|---|---|---|
|
Template Options Flag |
Identifies which options are enabled. The values are:
|
||
|
Total number of Templates added |
Indicates the number of Flow Templates and Option Templates that have been added since Version 9 export was first configured. The value in this field is the sum of the "Flow Templates added" and the "Option Templates added" fields. The value is incremented when a new template is created, because each template requires a unique ID. |
||
|
Total active Templates |
Sum of the values in the "Flow Templates active" and "Option Templates" active fields. The value in this field is incremented when a new data template or option template is created. |
||
|
Flow Templates active |
Indicates the number of (data) templates in use for Version 9 data export. When a new data template is created, this count, the "Total active Templates," the "Flow Templates added,"and the "Total number of Templates added" counts are all incremented.
|
||
|
Flow Templates added |
Indicates the number of Flow Templates and Option Templates that have been added since Version 9 export was first configured. The value is incremented when a new flow template is created, because each template requires a unique ID. |
||
|
Option Templates active |
Indicates the number of option templates which are currently in use for Version 9 options export. Configuring a new option increments this count and also the "Total active Templates,"the "Option Templates added," and the "Total number of Templates added" counts. Removing (unconfiguring) an option decrements only the "Option Templates active" count and the "Total active Templates" count. |
||
|
Option Templates added |
Indicates the number of Option Templates that have been added since Version 9 export was first configured. The count is incremented when a new option template is created, because each template requires a unique ID. |
||
|
Template ager polls |
The number of times, since Version 9 export was configured, that the (data) template ager has run. The template ager checks up to 20 templates per invocation, resending any that need refreshed. |
||
|
Option Template ager polls |
The number of times, since Version 9 export was configured, that the option template ager has run. The template ager checks up to 20 templates per invocation, resending any that need refreshed. |
||
|
Main cache version 9 export is enabled |
NetFlow export Version 9 is enabled for the main NetFlow cache. |
||
|
Template export information |
Template timeout--The interval (in minutes) that the router waits after sending the templates (flow and options) before they are sent again. You can specify from 1 to 3600 minutes. The default is 30 minutes.
|
||
|
Option export information |
|
||
|
Aggregation cache destination-prefix version 9 export is enabled |
NetFlow export Version 9 is enabled for the NetFlow destination-prefix aggregation cache. |
The following example displays the additional line in the show ip flow export command output when the verbose keyword is specified and MPLS PAL records are being exported to a NetFlow collector:
Router# show ip flow export verbose
Flow export v9 is enabled for main cache
  Exporting flows to 10.23.0.5 (4200)
  Exporting using source IP address 10.2.72.35
  Version 9 flow records, origin-as bgp-nexthop
  Cache for destination-prefix aggregation:
    Exporting flows to 10.2.0.1 (4200)
    Exporting using source IP address 10.2.72.35
    182128 MPLS PAL records exported
  189305 flows exported in 6823 udp datagrams
  0 flows failed due to lack of export packet
  0 export packets were sent up to process level
  0 export packets were dropped due to no fib
  0 export packets were dropped due to adjacency issues
  0 export packets were dropped due to fragmentation failures
  0 export packets were dropped due to encapsulation fixup failures swat72f3#
The line of output added for the MPLS PAL records precedes the "x flows exported in y UDP datagrams" line. In this example, the additional line of output precedes "189305 flows exported in 6823 UDP datagrams."
The following example shows the sample output of the show ip flow export nbar command:
Router# show ip flow export nbar
  Nbar netflow is enabled
  10 nbar flows exported
  0 nbar flows failed to export due to lack of internal buffers
Related Commands
|
Command |
Description |
|---|---|
|
ip flow-export |
Enables export of NetFlow accounting information in NetFlow cache entries. |
|
show ip cache flow |
Displays a summary of the NetFlow accounting statistics. |
|
show ip cache verbose flow |
Displays a detailed summary of the NetFlow accounting statistics. |
|
show ip flow interface |
Displays the NetFlow accounting configuration on interfaces. |
|
show mpls flow mappings |
Displays the full MPLS PAL table. |
show ip flow top-talkers
To display the statistics for the NetFlow aggregated top talkers or unaggregated top flows, use the show ip flow top-talkerscommand in user EXEC or privileged EXEC mode.
Cisco IOS Releases 12.4(9)T and Newer
Cisco IOS Releases 12.4(4)T and 12.4(6)
Cisco IOS Releases Prior to 12.4(4)T
Syntax Description
|
verbose |
(Optional) Displays additional details for the unaggregated top flows. |
|
number |
(Optional) Specifies the number of top talkers to show in the display. The range is 1 to 100. |
|
from-cache |
(Optional) Specifies the cache that the display output is generated from. |
|
main |
Display output is generated from the main cache. |
|
aggregate aggregate-field |
(Optional) The combination of the aggregate and the aggregate-field keywords and arguments specifies which field to aggregate for the display output. See the table below. |
|
sorted-by |
(Optional) Specifies which field to sort by. If this keyword is specified, you must select one of the following keywords: |
|
ascending |
(Optional) Arranges the display output in ascending order. |
|
descending |
(Optional) Arranges the display output in descending order. |
|
match match-field match-value |
(Optional) The combination of the match, match-field , and match-value keywords and arguments specifies the field from the flows - and the value in the field - to match. See the table below. |
Command Default
The show ip flow top-talkers number command string displays output in descending order based on the value in the sorted-by field.
The show ip flow top-talkers number command string displays data from the main NetFlow cache.
Command History
|
Release |
Modification |
|---|---|
|
Original version of the show ip flow top-talkers command (unaggregated top flows) |
|
|
12.2(25)S |
This command was introduced. |
|
12.3(11)T |
This feature was integrated into Cisco IOS Release 12.3(11)T. |
|
12.2(27)SBC |
This feature was integrated into Cisco IOS Release 12.2(27)SBC. |
|
12.2(33)SRA |
This feature was integrated into Cisco IOS Release 12.2(33)SRA. |
|
12.2(31)SB2 |
This command was integrated into Cisco IOS Release 12.2(31)SB2. |
|
Original version of the show ip flow top command (aggregated top talkers) |
|
|
12.4(4)T |
This command was introduced. |
|
Merged show ip flow top-talkers and show ip flow top commands |
|
|
12.4(9)T |
The show ip flow top command was merged into the show ip flow top-talkers command. |
|
12.2SX |
This command is supported in the Cisco IOS Release 12.2SX train. Support in a specific 12.2SX release of this train depends on your feature set, platform, and platform hardware. |
Usage Guidelines
You must have NetFlow configured before you can use the show ip flow top-talkerscommand.
The show ip flow top-talkers command can be used to display statistics for unaggregated top flows or aggregated top talkers. Prior to Cisco IOS release 12.4(9)T the show ip flow top-talkers command could only be used to display statistics for unaggregated top flows. In Cisco IOS release 12.4(9)T and newer releases, the show ip flow top-talkers command can be used to display statistics for both unaggregated top flows and aggregated top talkers.
Refer to the following sections for more information on using either of these methods:
Unaggregated Top Flows--All Cisco IOS Releases Prior to 12.4(9)T
When you use the show ip flow top-talkers command in releases prior to Cisco IOS release 12.4(9)T, the display output shows only separate (unaggregated) statistics for the number of top flows that you specified with the top command.
Note | The sort-by and top commands must be configured before you enter the show ip flow top-talkers [verbose] command. Optionally, the match command can be configured to specify additional matching criteria. Refer to the configuration documentation for the " NetFlow MIB and Top Talkers " feature for more information on using the top, sort-by, and match commands. |
This method of viewing flow statistics is useful for identifying the unique flows that are responsible for the highest traffic utilization in your network. For example, if you have a centralized WEB server farm and you want to see statistics for the top 50 flows between your servers and your users regardless of the network protocol or application in use, you can configure top 50 and use the show ip flow top-talkers verbose command to view the statistics from the 50 top flows.
 Tip | If you want to limit the flows that are displayed to specific protocols or IP addresses, you can configure match criteria with the match command. |
Displaying information on individual top flows will not provide you with a true map of your network utilization when the highest volume application or protocol traffic on your network is being generated by a large number of users who are sending small amounts of traffic. For example, if you configure top 10 and there are ten or more users generating more FTP traffic than any other type of traffic in your network, you will see the FTP traffic as the top flows even though there might be 10,000 users using HTTP to access web sites at much lower individual levels of network utilization that account for a much larger aggregated traffic volume. In this situation you need to aggregate the traffic patterns across flows using the show ip flow top-talkers [number] command string.
The timeout period as specified by the cache-timeout command does not start until the show ip flow top-talkers command is entered. From that time, the same top talkers are displayed until the timeout period expires. To recalculate a new list of top talkers before the timeout period expires, you can change the parameters of the cache-timeout, top, or sort-by command prior to entering the show ip flow top-talkers command.
A long timeout period for the cache-timeout command limits the system resources that are used by the NetFlow MIB and Top Talkers feature. However, the list of top talkers is calculated only once during the timeout period. If a request to display the top talkers is made more than once during the timeout period, the same results are displayed for each request, and the list of top talkers is not recalculated until the timeout period expires.
A short timeout period ensures that the latest list of top talkers is retrieved; however too short a period can have undesired effects:
- The list of top talkers is lost when the timeout period expires. You should configure a timeout period for at least as long as it takes the network management system (NMS) to retrieve all the required NetFlow top talkers.
- The list of top talkers is updated every time the top talkers information is requested, possibly causing unnecessary usage of system resources.
A good method to ensure that the latest information is displayed, while also conserving system resources, is to configure a large value for the timeout period, but cause the list of top talkers to be recalculated by changing the parameters of the cache-timeout, top, or sort-by command prior to entering the show ip flow top-talkerscommand to display the top talkers. Changing the parameters of the cache-timeout, top, or sort-by command causes the list of top talkers to be recalculated upon receipt of the next command line interface (CLI) or MIB request.
Aggregated Top Talkers--Cisco IOS Releases 12.4(9)T and Newer
The show ip flow top command was merged with the show ip flow top-talkers command in Cisco IOS release 12.4(9)T. The two commands were merged to make it easier for you to display cache information on either unaggregated top flows, or aggregated top talkers, using the same root command.
The CLI help for the show ip flow top-talkers command was modified to help you differentiate between the two command formats.
Router# show ip flow top-talkers ?

Display aggregated top talkers:
  <1-100>  Number of aggregated top talkers to show
Display unaggregated top flows:
  verbose  Display extra information about unaggregated top flows
  |        Output modifiers
  <cr>
Router#
When you use the show ip flow top-talkers [number] command the display output will consist of aggregated statistics from the flows (aggregated top talkers) for the number of top talkers that you specified with the number argument.
Unlike the show ip flow top-talkers [verbose] command, the show ip flow top-talkers [number] command string does not require:
- Any pre-configuration of the router for the show ip flow top-talkers [number] command string itself. You can use the show ip flow top-talkers [number] command string immediately after enabling NetFlow on at least one interface in the router.
- Manipulating a cache timeout parameter to force a recalculation of the aggregated top talkers. The information in the display output of the show ip flow top-talkers [number] command string always contains the latest, most up-to-date information because it is not cached.
The arguments that are available with the show ip flow top-talkers [number] command enable you to quickly modify the criteria to be used for generating the display output. Refer to the configuration documentation for the " NetFlow Dynamic Top Talkers CLI " feature which is included in the Cisco IOS Release 12.4(4)T module " Detecting and Analyzing Network Threats With NetFlow ", for additional information using the show ip flow top-talkers [number] command string.
For additional usage guidelines on displaying statistics for aggregated top talkers using the show ip flow top-talkers [number] command string, see the following sections:
Top Traffic Flows
Using the show ip flow top-talkerscommand to display the aggregated statistics from the flows on a router for the highest volume applications and protocols in your network helps you identify, and classify, security problems such as a denial of service (DoS) attacks because DoS attack traffic almost always show up as one of the highest volume protocols in your network when a DoS attack is in progress. Displaying the aggregated statistics from the flows on a router is also useful for traffic engineering, diagnostics and troubleshooting.
Data Displayed by the show ip flow top command
The data in the display output from the show ip flow top-talkers command is not flow centric. You cannot identify individual flows with the show ip flow top-talkers command.
For example, when you use the show ip flow top-talkers 5 aggregate destination-address command:
- If you do not specify any match criteria, the aggregated statistics for the top five destination IP addresses from the flows on a router are displayed.
- If you specify match criteria, the aggregated statistics for the top five destination IP addresses that meet the match criteria that you specified is displayed.
Top Talkers Display Output With Aggregation Only
If you do not use any of the optional parameters the show ip flow top-talkerscommand displays the aggregated statistics from the flows on the router for the aggregation field that you enter. For example, to aggregate the flows based on the destination IP addresses, and display the top five destination IP addresses, you use the show ip flow top-talkers 5 aggregate destination-address command.
Top Talkers Display Output With Aggregation and Match Criteria
You can limit the display output by adding an optional match criterion. For example, to aggregate the statistics from the flows based on the destination IP addresses, and display the top five destination IP addresses that contain TCP traffic, you use the show ip flow top-talkers 5 aggregate destination-address match protocol tcp command.
Top Talkers Display Output in Ascending Order With Aggregation and Match Criteria
You can change the default sort order of the display output by using the sorted-by keyword. For example, to aggregate the statistics from the flows based on the destination IP addresses, and display the top five destination IP addresses that contain TCP traffic sorted on the aggregated field in ascending order, you use the show ip flow top-talkers 5 aggregate destination-address sorted-by aggregate ascending match protocol tcp command.
Tip | This usage of the show ip flow top-talkers 5 aggregate destination-address sorted-by aggregate ascending match protocol tcp command string is useful for capacity planning because it shows the smallest flows first. The smallest flows indicate the minimum amount of capacity that you need to provide. |
Aggregate-field and Match-field Match-value Keywords, Arguments, and Descriptions
The table below shows the keywords and descriptions for the aggregate-field argument of the show ip flow top-talkers number aggregateaggregate-field command. You must enter one of the keywords from this table.
| Table 20 | Keywords and Descriptions for aggregate-field Argument |
|
Keyword |
Description |
|---|---|
|
bgp-nexthop |
Flows that have the same value in the bgp-nexthop field are aggregated. |
|
bytes |
Flows that have the same number of bytes are aggregated. |
|
destination-address |
Flows that have the same value in the destination-address field are aggregated. |
|
destination-as |
Flows that have the same value in the destination-as field are aggregated. |
|
destination-interface |
Flows that have the same value in the destination-interface field are aggregated. |
|
destination-port |
Flows that have the same value in the destination-port field are aggregated. |
|
destination-vlan |
Flows that have the same value in the destination-vlan field are aggregated. |
|
dscp |
Flows that have the same value in the dscp field are aggregated. |
|
fragment-offset |
Flows that have the same value in the fragment-offset field are aggregated. |
|
icmp |
Flows that have the same value in the icmp-type and icmp code fields are aggregated. |
|
icmp-code |
Flows that have the same value in the icmp-code field are aggregated. |
|
icmp-type |
Flows that have the same value in the icmp-type field are aggregated. |
|
incoming-mac |
Flows that have the same value in the incoming-mac address field are aggregated. |
|
ip-id |
Flows that have the same value in the ip-id field are aggregated. |
|
ip-nexthop-address |
Flows that have the same value in the ip-nexthop-address field are aggregated. |
|
max-packet-length |
Flows that have the same value in the max-packet-length field are aggregated. |
|
max-ttl |
Flows that have the same value in the max-ttl field are aggregated. |
|
min-packet-length |
Flows that have the same value in the min-packet-length field are aggregated. |
|
min-ttl |
Flows that have the same value in the min-ttl field are aggregated. |
|
outgoing-mac |
Flows that have the same value in the outgoing-mac address field are aggregated. |
|
packets |
Flows that have the same number of packets are aggregated. |
|
precedence |
Flows that have the same value in the precedence field are aggregated. |
|
protocol |
Flows that have the same value in the protocol field are aggregated. |
|
source-address |
Flows that have the same value in the source-address field are aggregated. |
|
source-as |
Flows that have the same value in the source-as field are aggregated. |
|
source-interface |
Flows that have the same value in the source-interface field are aggregated. |
|
source-port |
Flows that have the same value in the source-port field are aggregated. |
|
source-vlan |
Flows that have the same value in the source-vlan field are aggregated. |
|
tcp-flags |
Flows that have the same value in the tcp-flags field are aggregated. |
|
tos |
Flows that have the same value in the tos field are aggregated. |
The table below shows the keywords, arguments, and descriptions for the match-field match-value arguments for the show ip flow top-talkers number aggregateaggregate-fieldmatchmatch-fieldmatch-value command. These keywords are all optional.
Note | In the table below, the match criteria that you select must be available in the cache. For example, if you use the show ip flow top 20 aggregate destination-address match destination-vlan 1 command, and you have not configured the ip flow-capture vlan-id command, the "% VLAN id is not available for this cache" error message is displayed. |
Note | In the table below, the match-field is the keyword in the keyword column and the match-value is the argument(s) for the keyword. For example, for the keyword bgp-nexthop, bgp-nexthop is the match-field and [ip-address | hostname] is the match-value . |
Many of the values shown in the display output of the show ip cache verbose flow command are in hexadecimal. If you want to match these values using the show ip flow top-talkers command with the match keyword, you must enter the field value that you want to match in hexadecimal. For example, to match on the destination port of 0x00DC in the following excerpt from the show ip cache verbose flow command, you would use the match destination-port0x00DC keywords and argument for the show ip flow top-talkers command.
R3# show ip cache verbose flow
.
.
.
SrcIf          SrcIPaddress    DstIf
          DstIPaddress    Pr TOS Flgs  Pkts
Port Msk AS                    Port
 Msk AS    NextHop              B/Pk  Active
Et0/0.1        10.10.11.4      Et1/0.1        172.16.10.8     06 00  00     209
0023
 /0  0                     00DC
 /0  0     0.0.0.0                40   281.4
.
.
.
| Table 21 | Keywords, Arguments, and Descriptions for match-field match-value |
|
Keyword |
Description |
||
|---|---|---|---|
|
bgp-nexthop {ip-address | hostname} |
IP address or hostname of the BGP nexthop router to match in the flows. |
||
|
bytes {[bytes ] | [minbytes ] [maxbytes ]} |
Range of bytes to match in the flows.
|
||
|
destination-as as-number |
Destination Autonomous System number to match in the flows. The range is 0 to 65535. |
||
|
destination-interface interface-type interface-number |
Destination interface to match in the flows. |
||
|
destination-port {[port ] | [minport ] [maxport ]} |
The range of destination ports to match in the flows.
|
||
|
destination-prefix prefix /mask |
Destination IP address prefix and mask to match in the flows.
|
||
|
destination-vlan vlan-id |
Destination VLAN ID to match in the flows. |
||
|
dscp dscp |
Value in the DSCP field to match in the flows. |
||
|
flows {[flows] | [min flows] [max flows]} |
The range of flows in the aggregated data to match in the flows.
|
||
|
fragment-offset fragment-offset |
Value in the fragment offset field to match in the flows. |
||
|
icmp type type code code |
ICMP type and code values to match in the flows. |
||
|
icmp-code code |
ICMP code value to match in the flows. |
||
|
icmp-type type |
ICMP type value to match in the flows. |
||
|
incoming-mac mac-address |
Incoming MAC address to match in the flows. |
||
|
ip-id ip-id |
IP ID value to match in the flows. |
||
|
ip-nexthop-prefix prefix/mask |
IP nexthop address prefix and mask to match in the flows.
|
||
|
max-packet-length {[max-packet-length] | [min max-packet-length] [max max-packet-length]} |
The range of maximum packet length values to match in the flows.
|
||
|
max-ttl {[max-ttl] | [min max-ttl] [max max-ttl]} |
The range of maximum TTL values to match in the flows.
|
||
|
min-packet-length {[min-packet-length] | [min min-packet-length] [max min-packet-length]} |
The range of minimum packet length values to match in the flows.
|
||
|
min-ttl {[min-ttl] | [min min-ttl] [max min-ttl]} |
The range of minimum TTL values to match in the flows.
|
||
|
outgoing-mac mac-address |
Outgoing MAC address to match in the flows. |
||
|
packets {[packet-size] | [min packet-size] [max packet-size]} |
The range of packet sizes to match in the flows.
|
||
|
precedence precedence |
Precedence value to match in the flows. |
||
|
protocol {[protocol-number ] | [tcp | udp | icmp | igmp | ip-in-ip | gre | ipv6-in-ipv6]} |
Protocol value to match in the flows.
|
||
|
source-as source-as |
Source autonomous system value to match in the flows. |
||
|
source-interface interface-type interface-number |
Source interface to match in the flows. |
||
|
source-port {[port] | [[min port] [max port]]} |
The range of source port values to match in the flows.
|
||
|
source-prefix prefix/mask |
Source address prefix and mask to match in the flows.
|
||
|
source-vlan vlan-id |
Source VLAN ID to match in the flows. |
||
|
tcp-flags flag |
Value in the TCP flag field to match in the flows. |
||
|
tos tos |
Value in the TOS flag field to match in the flows. |
The Order That Aggregation Occurs in
With the exception of the flows keyword in the table above, all matches made with the match-fieldmatch-value arguments are performed prior to aggregation, and only matching flows are aggregated. For example, the show ip flow top-talkers5aggregate destination-address match destination-prefix172.16.0.0/16 command analyzes all of the available flows looking for any flows that have destination addresses that match the destination-prefix value of 172.16.0.0/16 . If it finds any matches it aggregates them, and then displays the number of aggregated destination-address flows that is equal to the number of top talkers that were requested in the command-in this case five.
The flows keyword matches the number of aggregated flows post-aggregation. For example, the show ip flow top2aggregate destination-address match flows 6command aggregates all of the flows on the values in their destination IP address field, and then displays the top talkers that have 6 aggregated flows.
Number of Flows Matched
If you do not specify match criteria and there are flows in the cache that include the field that you used to aggregate the flows on, all of the flows will match. For example, if your router has 20 flows with IP traffic and you enter the show ip flow top-talkers 10 aggregate destination-address command the display will indicate that 20 of 20 flows matched, and the 10 top talkers will be displayed.
If you use the match keyword to limit the flows that are aggregated to the flows with a destination prefix of 224.0.0.0/3, and only one flow matches this criterion the output will indicate that one out of 20 flows matched. For example, if your router has 20 flows with IP traffic, but only one of them has a destination prefix of 224.0.0.0/3, and you enter the show ip flow top-talkers 10 aggregate destination-address match destination-prefix224.0.0.0/3 command, the display will indicate that 1 of 20 flows matched.
If the total number of top talkers is less than the number of top talkers that were requested in the command, the available number of top talkers is displayed. For example, if you enter a value of five for the number of top talkers to display and there are only three top talkers that match the criteria that you used, the display will only include three top talkers.
When a match criterion is included with the show ip flow top-talkerscommand, the display output will indicate "N of M flows matched" where N is the number of matched flows, M is the total number of flows seen, and N is less than or equal to M. The numbers of flows seen could potentially be more than the total number of flows in the cache if some of the analyzed flows were expired from the cache and new flows were created, as the top talkers feature scans through the cache. Therefore, M is NOT the total number of flows in the cache, but rather, the number of flows observed in the cache by the top talkers feature.
If you attempt to display the top talkers by aggregating them on a field that is not in the cache you will see the "% aggregation-field is not available for this cache" message. For example, if you use the show ip flow top5 aggregate source-vlan command, and you have not enabled the capture of VLAN IDs from the flows, you will see the "% VLAN id is not available for this cache" message.
TCP-Flags
If you want to use the tcp-flags flag match criteria you must enter the hexadecimal values for the type of TCP flag that you want to match.
The TCP flags as used in the tcp-flags flag match criteria are provided in the table below.
| Table 22 | Values for the tcp-flags flag match criteria |
|
Hexadecimal Value |
Field Name |
|---|---|
|
0x01 |
FIN-Finish; end of session |
|
0x02 |
SYN-Synchronize; indicates request to start session |
|
0x04 |
RST-Reset; drop a connection |
|
0x08 |
PUSH-Push; packet is sent immediately |
|
0x10 |
ACK-Acknowledgement |
|
0x20 |
URG-Urgent |
|
0x40 |
ECE-Explicit Congestion Notification Echo |
|
0x80 |
CWR-Congestion Window Reduced |
For more information on TCP and TCP flags, refer to RFC 3168 at the following URL: http://www.ietf.org/rfc/rfc3168.txt.
Examples
The show ip flow top-talkers command can be used to display information for unaggregated top flows or aggregated top talkers. Refer to the following sections for examples on using either of these methods:
Examples for Unaggregated Top Flows--All Cisco IOS releases that Support the NetFlow MIB and Top Talkers Feature
The following example shows the output of the show ip flow top-talkers command.
In the example, the NetFlow MIB and Top Talkers feature has been configured to allow a maximum of five top talkers to be viewed. The display output is configured to be sorted by the total number of bytes in each top talker, and the list of top talkers is configured to be retained for 2 seconds (2000 milliseconds).
Router(config)# ip flow-top-talkers
Router(config-flow-top-talkers)# top 5
Router(config-flow-top-talkers)# sort-by bytes
Router(config-flow-top-talkers)# cache-timeout 2000
Router# show ip flow top-talkers
SrcIf         SrcIPaddress    DstIf         DstIPaddress    Pr SrcP DstP Bytes
Et0/0.1       10.10.18.1      Et1/0.1       172.16.10.232   11 00A1 00A1   144K
Et0/0.1       10.10.19.1      Et1/0.1       172.16.10.2     11 00A2 00A2   144K
Et0/0.1       172.30.216.196  Et1/0.1       172.16.10.2     06 0077 0077   135K
Et0/0.1       10.162.37.71    Et1/0.1       172.16.10.2     06 0050 0050   125K
Et0/0.1       10.92.231.235   Et1/0.1       172.16.10.2     06 0041 0041   115K
5 of 5 top talkers shown. 11 flows processed
The table below describes the significant fields shown in the display.
| Table 23 | show ip flow top-talkers Field Descriptions |
|
Field |
Description |
|---|---|
|
SrcIf |
Source interface |
|
SrcIPaddress |
Source IP address |
|
DstIf |
Destination interface |
|
DstIPaddress |
Destination IP address |
|
Pr |
Protocol number |
|
SrcP |
Source port |
|
DstP |
Destination port |
|
Bytes |
Total number of bytes in each top talker |
|
X of Y top talkers shown |
Y-The number of Top Talkers specified by the top command. X-The number of flows displayed. The value for "X" is always <= the value for "Y". For example, if "Y" = 5 and there are 3 Top Talkers, the display will show 3 of 5 top talkers shown. |
|
flows processed |
The number of flows observed in the NetFlow cache. |
The table below shows messages that could be received in response to the show ip flow top-talkers command and their explanations.
| Table 24 | show ip flow top-talkers Message Descriptions |
|
Message |
Description |
|---|---|
|
% Top talkers not configured |
The NetFlow MIB and Top Talkers feature has not yet been configured. |
|
% Cache is not enabled |
The cache is not enabled |
|
% Cache is empty |
There are no flows in the cache to be viewed. |
|
% There are no matching flows to show |
The match criteria that were specified do not match any flows in the cache. |
Examples for Aggregated Top Talkers--All Cisco IOS releases that Support the NetFlow Dynamic Top Talkers CLI Feature
The following example looks for up to 10 top talkers, aggregates them on the protocol type, sorts them by the number of packets in the flows, and displays the output in descending order:
Router# show ip flow top-talkers 10 aggregate protocol sorted-by packets descending
There are 3 top talkers:
IPV4 PROT       bytes        pkts       flows
=========  ==========  ==========  ==========
        1  2009729203     1455464          11
        6    33209300       30690          19
       17          92           1           1
31 of 31 flows matched.
Things to note in this display output:
- All 31 flows in the router are aggregated into three top talkers. In this example all of the flow traffic is top talker traffic.
- The majority of the traffic that is aggregated into the first flow is ICMP traffic (IP protocol type 1). This might indicate an ICMP DoS attack is in progress.
The table below describes the significant fields shown in the display.
| Table 25 | show ip flow top-talkers 10 aggregate protocol sorted-by packets descending Field Descriptions |
|
Field |
Description |
|---|---|
|
There are top X talkers |
The number of top talkers (X) is displayed. |
|
IPV4 PROT 2 |
This position in the display output is used to show the field that you selected to aggregate the flows on. The protocol keyword aggregates IPv4 traffic in the flows based on the IPv4 protocol type. In this example there are three IPv4 protocol types in the flows: |
|
bytes |
Displays the numbers of bytes in the aggregated flows for each top talker. |
|
pkts |
Displays the numbers of packets in the aggregated flows for each top talker. |
|
flows |
Displays the numbers of aggregated flows for each top talker. |
|
X of Y flows matched. |
Y-Number of flows seen in the cache. X-Number of flows in the cache that matched the criteria you specified. |
The following example looks for up to five top talkers, aggregates them on the source IP address, sorts them in descending order by the numbers of packets, matches on the ICMP type value of 8, and displays the output in descending order:
Router# show ip flow top-talkers 5 aggregate source-address sorted-by packets descending match icmp-type 8
There are 3 top talkers:
IPV4 SRC-ADDR         bytes        pkts       flows
===============  ==========  ==========  ==========
192.168.87.200     23679120       16501           1
10.234.53.1        18849000       12566           1
172.30.231.193     12094620        8778           1
3 of 29 flows matched.
The following example looks for up to five top talkers, aggregates them on the destination IP address, sorts them in descending order by the numbers of packets, matches on the ICMP type value of 8, and displays the output in descending order:
Router# show ip flow top-talkers 5 aggregate destination-address sorted-by packets descending match icmp-type 8
There are 2 top talkers:
IPV4 DST-ADDR         bytes        pkts       flows
===============  ==========  ==========  ==========
172.16.1.2         32104500       21403           2
172.16.10.2         2128620        2134           1
3 of 32 flows matched.
The table below describes the significant fields shown in the display.
| Table 26 | show ip flow top-talkers 5 aggregate {source-address | destination-address} sorted-by packets descending match icmp-type 8 Field Descriptions |
|
Field |
Description |
|---|---|
|
There are top X talkers |
The number of top talkers (X) is displayed. |
|
IPV4 SRC-ADDR 3 |
This position in the display output is used to show the field that you selected to aggregate the flows on. The source-addresskeyword aggregates IPv4 traffic in the flows based on the source IPv4 IP address. In this example there are 3 IP source addresses in the flows: |
|
IPV4 DST-ADDR 4 |
This position in the display output is used to show the field that you selected to aggregate the flows on. The destination-addresskeyword aggregates IPv4 traffic in the flows based on the destination IPv4 IP address. In this example there are 2 IP destination addresses in the flows: |
|
bytes |
Displays the numbers of bytes in the aggregated flows for each top talker. |
|
pkts |
Displays the numbers of packets in the aggregated flows for each top talker. |
|
flows |
Displays the numbers of aggregated flows for each top talker. |
|
X of Y flows matched. |
Y-Number of flows seen in the cache. X-Number of flows in the cache that matched the criteria you specified. |
The following example looks for up to five top talkers, aggregates them on the source IP address, sorts them in descending order by the number of bytes in the flow, matches on the port range of 20 to 21 (FTP Data and control ports, respectively), and displays the output in descending order:
Router# show ip flow top-talkers 5 aggregate source-address sorted-by bytes descending match destination-port min 20 max 21
There are 5 top talkers:
IPV4 SRC-ADDR         bytes        pkts       flows
===============  ==========  ==========  ==========
10.231.185.254          920          23           2
10.10.12.1              480          12           2
10.251.138.218          400          10           2
10.132.221.111          400          10           2
10.71.200.138           280           7           1
9 of 34 flows matched.
Tip | You can enter the port numbers in their decimal values as shown (20 and 21), or in their hexadecimal equivalents of 0x14 and 0x15. |
The table below describes the significant fields shown in the display.
| Table 27 | show ip flow top-talkers 5 aggregate source-address sorted-by packets descending match icmp-type 8 Field Descriptions |
|
Field |
Description |
|---|---|
|
There are top X talkers |
The number of top talkers (X) is displayed. |
|
IPV4 SRC-ADDR |
This position in the display output is used to show the field that you selected to aggregate the flows on. The source-addresskeyword aggregates IPv4 traffic in the flows based on the source IPv4 IP address. In this example there are 5 IP source addresses in the flows: |
|
bytes |
Displays the numbers of bytes in the aggregated flows for each top talker. |
|
pkts |
Displays the numbers of packets in the aggregated flows for each top talker. |
|
flows |
Displays the numbers of aggregated flows for each top talker. |
|
X of Y flows matched. |
Y-Number of flows seen in the cache. X-Number of flows in the cache that matched the criteria you specified. |
The following example looks for up to five top talkers, aggregates them on the source IP address, sorts them in descending order by the aggregated field (source IP address), and displays the output in descending order:
Router# show ip flow top-talkers 5 aggregate source-address sorted-by aggregate descending

There are 5 top talkers:
IPV4 SRC-ADDR         bytes        pkts       flows
===============  ==========  ==========  ==========
172.16.1.85           97360        2434           2
172.16.1.84           97320        2433           2
10.251.138.218        34048        1216           1
10.231.185.254        34048        1216           1
10.132.221.111        34076        1217           1
7 of 18 flows matched.
The table below describes the significant fields shown in the display.
| Table 28 | show ip flow top-talkers 5 aggregate source-address sorted-by aggregate descending Field Descriptions |
|
Field |
Description |
|---|---|
|
There are top X talkers |
The number of top talkers (X) is displayed. |
|
IPV4 SRC-ADDR |
This position in the display output is used to show the field that you selected to aggregate the flows on. The source-addresskeyword aggregates IPv4 traffic in the flows based on the source IPv4 IP address. In this example there are 5 IP source addresses in the flows: |
|
bytes |
Displays the numbers of bytes in the aggregated flows for each top talker. |
|
pkts |
Displays the numbers of packets in the aggregated flows for each top talker. |
|
flows |
Displays the numbers of aggregated flows for each top talker. |
|
X of Y flows matched. |
Y-Number of flows seen in the cache. X-Number of flows in the cache that matched the criteria you specified. |
Related Commands
|
Command |
Description |
|---|---|
|
cache-timeout |
Specifies the length of time for which the list of top talkers (heaviest traffic patterns and most-used applications in the network) for the NetFlow MIB and Top Talkers feature is retained. |
|
ip flow-top-talkers |
Enters the configuration mode for the NetFlow MIB and Top Talkers (heaviest traffic patterns and most-used applications in the network) feature. |
|
match (NetFlow) |
Specifies match criteria for the NetFlow MIB and Top Talkers (heaviest traffic patterns and most-used applications in the network) feature. |
|
sort-by |
Specifies the sorting criterion for top talkers (heaviest traffic patterns and most-used applications in the network) to be displayed for the NetFlow MIB and Top Talkers feature. |
|
top |
Specifies the maximum number of top talkers (heaviest traffic patterns and most-used applications in the network) to be displayed for the NetFlow MIB and Top Talkers feature. |
|
show ip cache flow |
Displays a summary of the NetFlow accounting statistics. |
|
show ip cache verbose flow |
Displays a detailed summary of the NetFlow accounting statistics. |
|
show ip flow interface |
Displays NetFlow accounting configuration for interfaces. |
show mls ip non-static
To display information for the software-installed nonstatic entries, use the show mls ip non-static command in user EXEC or privileged in the EXEC mode.
Usage Guidelines
This command is not supported on Cisco 7600 series routers that are configured with a Supervisor Engine 2.
Examples
This sections contains examples from the show mls ip non-static command. The fields shown in the display are self-explanatory.
This example shows how to display the software-installed nonstatic entries:
Router> show mls ip non-static
Displaying Netflow entries in Supervisor Earl
DstIP           SrcIP           Prot:SrcPort:DstPort  Src i/f:AdjPtr
--------------------------------------------------------------------
Pkts         Bytes       Age   LastSeen  Attributes
---------------------------------------------------
Router>
This example shows how to display detailed information for the software-installed nonstatic entries:
Router> show mls ip non-static detail
Displaying Netflow entries in Supervisor Earl
DstIP           SrcIP           Prot:SrcPort:DstPort  Src i/f:AdjPtr
--------------------------------------------------------------------
Pkts         Bytes       Age   LastSeen  Attributes
---------------------------------------------------
QoS     Police Count Threshold    Leak     Drop Bucket  Use-Tbl Use-Enable
-----------+------------+---------+-----------+----+-------+-------+----------+
Router>
This example shows how to display the total number of software-installed nonstatic entries:
Router> show mls ip non-static count
Displaying Netflow entries in Supervisor Earl
 Number of shortcuts = 0
Router>
show mls ip routes
To display the NetFlow routing entries, use the show mls ip routescommand in user EXEC or privileged EXEC mode.
Syntax Description
|
non-static |
(Optional) Displays the software-installed nonstatic entries. |
|
static |
(Optional) Displays the software-installed static entries. |
|
count |
(Optional) Displays the total number of NetFlow routing entries. |
|
module number |
(Optional) Displays the entries that are downloaded on the specified module; see the "Usage Guidelines" section for valid values. |
|
detail |
(Optional) Specifies a detailed per-flow output. |
Usage Guidelines
This command is not supported on Cisco 7600 series routers that are configured with a Supervisor Engine 2.
Examples
This section contains examples of the show mls ip routes non-static command. The fields shown in the display are self-explanatory.
This example shows how to display the software-installed nonstatic routing entries:
Router> show mls ip routes non-static
Displaying Netflow entries in Supervisor Earl
DstIP           SrcIP           Prot:SrcPort:DstPort  Src i/f:AdjPtr
--------------------------------------------------------------------
Pkts         Bytes       Age   LastSeen  Attributes
---------------------------------------------------
Router>
This example shows how to display detailed information for the software-installed nonstatic routing entries:
Router> show mls ip routes non-static detail
Displaying Netflow entries in Supervisor Earl
DstIP           SrcIP           Prot:SrcPort:DstPort  Src i/f:AdjPtr
--------------------------------------------------------------------
Pkts         Bytes       Age   LastSeen  Attributes
---------------------------------------------------
    QoS     Police Count Threshold    Leak     Drop Bucket  Use-Tbl Use-Enable
-----------+------------+---------+-----------+----+-------+-------+----------+
Router>
This example shows how to display the total number of software-installed routing entries:
Router> show mls ip routes count
Displaying Netflow entries in Supervisor Earl
 Number of shortcuts = 0
Router>
show mls ip static
To display the information for the software-installed static IP entries, use the show mls ip static command in user EXEC or privileged EXEC mode.
Usage Guidelines
This command is not supported on Cisco 7600 series routers that are configured with a Supervisor Engine 2.
Examples
This section contains examples from the show mls ip staticcommand. The fields shown in the display are self-explanatory.
This example shows how to display the software-installed static entries:
Router> show mls ip static
Displaying Netflow entries in Supervisor Earl
DstIP           SrcIP           Prot:SrcPort:DstPort  Src i/f:AdjPtr
--------------------------------------------------------------------
Pkts         Bytes       Age   LastSeen  Attributes
---------------------------------------------------
Router>
This example shows how to display detailed information for the software-installed static entries:
Router> show mls ip static detail
Displaying Netflow entries in Supervisor Earl
DstIP           SrcIP           Prot:SrcPort:DstPort  Src i/f:AdjPtr
--------------------------------------------------------------------
Pkts         Bytes       Age   LastSeen  Attributes
---------------------------------------------------
    QoS     Police Count Threshold    Leak     Drop Bucket  Use-Tbl Use-Enable
-----------+------------+---------+-----------+----+-------+-------+----------+
Router>
This example shows how to display the total number of software-installed static entries:
Router> show mls ip static count
Displaying Netflow entries in Supervisor Earl
 Number of shortcuts = 0
Router>
show mls nde
To display information about the NetFlow Data Export (NDE) hardware-switched flow, use the show mls ndecommand in user EXEC or privileged EXEC mode.
Command History
|
Release |
Modification |
|---|---|
|
12.2(14)SX |
Support for this command was introduced on the Supervisor Engine 720. |
|
12.2(17d)SXB |
Support for this command on the Supervisor Engine 2 was extended to the 12.2 SX release. |
|
12.2(18)SXD |
The output for Cisco 7600 series routers that are configured with a Supervisor Engine 720 was changed to include the current NDE mode. |
|
12.2(33)SRA |
This command was integrated into Cisco IOS Release 12.2(33)SRA. |
|
12.2(33)SXI |
The output was modified to display the data export version and aggregation cache scheme. |
Usage Guidelines
The output for Cisco 7600 series routers that are configured with a Supervisor Engine 720 includes the current NDE mode.
Supervisor Engine 2 Examples
This example shows the output from Cisco 7600 series routers that are configured with a Supervisor Engine 2.
This example shows how to display information about the NDE status on a Cisco 7600 series router that is configured with a Supervisor Engine 2:
Router# show mls nde
 Netflow Data Export is Enabled
Router#
Supervisor Engine 720 Examples
This example shows how to display information about the NDE hardware-switched flow on a Cisco 7600 series router that is configured with a Supervisor Engine 720:
Router# show mls nde
 Netflow Data Export enabled (Interface Mode)
 Exporting flows to 172.20.55.71 (9991)
 Exporting flows from 10.6.60.120 (59020)
 Version: 9
 Include Filter not configured
 Exclude Filter not configured
 Total Netflow Data Export Packets are:
	as aggregation v9 0 packets, 0 no packets, 0 records
Router#
Related Commands
|
Command |
Description |
|---|---|
|
mls nde sender |
Enables MLS NDE export. |
|
show ip flow-export |
Displays the information about the hardware-switched and software-switched flows for the data export, including the main cache and all other enabled caches. |
|
show mls netflow |
Displays configuration information about the NetFlow hardware. |
show mls netflow
To display configuration information about the NetFlow hardware, use the show mls netflow command in user EXEC or privileged EXEC mode.
IPv6, MLPS, and software Configuration
Syntax Description
|
aging |
Displays the NetFlow-aging information. |
|
aggregation flowmask |
Displays the flow mask that is set for the current NetFlow aggregations. |
|
creation |
Displays the configured protocol-creation filters. |
|
flowmask |
Displays the current NetFlow IP and IPX flow mask. |
|
table-contention |
Displays the NetFlow table-contention level information. |
|
detailed |
Displays detailed NetFlow table-contention level information. |
|
summary |
Displays a summary of NetFlow table-contention levels. |
|
ip |
(Optional) Displays information about the NetFlow IP table; see the show mls netflow ip command. |
|
ipv6 |
(Optional) Displays information about the NetFlow IPv6 table; see the show mls netflow ipv6 command. |
|
mpls |
(Optional) Displays information about the NetFlow Multiprotocol Label Switching(MPLS) table. |
|
any |
(Optional) Displays detailed NetFlow table-entry information with no test wrap. |
|
count |
(Optional) Displays the total number of MLS NetFlow IP entries. |
|
destination hostname |
(Optional) Displays the entries for a specific destination hostname. |
|
destination ip-address |
(Optional) Displays the entries for a specific destination IP address. |
|
detail |
(Optional) Specifies a detailed output. |
|
dynamic |
(Optional) Displays the hardware-created dynamic entries; see the show mls netflow ip dynamic command. |
|
flow tcp |
(Optional) Displays information about the TCP flows. |
|
flow udp |
(Optional) Displays information about the User Datagram Protocol(UDP) flows. |
|
module number |
(Optional) Displays the entries that are downloaded on the specified module; see the "Usage Guidelines" section for valid values. |
|
nowrap |
(Optional) Displays information without text wrap. |
|
source hostname |
(Optional) Displays the entries for a specific source address. |
|
source ip-address |
(Optional) Displays the entries for a specific source IP address. |
|
sw-installed |
(Optional) Displays the routing NetFlow entries; see the show mls netflow ip sw-installed command. |
|
non-static |
(Optional) Displays information for software-installed non-static IP entries; see the show mls netflow ip sw-installed command. |
|
static |
(Optional) Displays information for the software-installed static IP entries; see the show mls netflow ip sw-installed command. |
Command History
|
Release |
Modification |
|---|---|
|
12.2(14)SX |
This command was introduced on the Supervisor Engine 720. |
|
12.2(17a)SX |
This command was changed as follows:
|
|
12.2(17b)SXA |
This command was changed to add the following keywords and arguments:
|
|
12.2(17d)SXB |
Support for this command on the Supervisor Engine 2 was extended to the 12.2SX train. |
|
12.2(18)SXD |
The creation keyword was added. |
|
12.2(33)SRA |
This command was integrated into Cisco IOS Release 12.2(33)SRA. |
Usage Guidelines
Note | The creation keyword is not supported in releases prior to Release 12.2(18)SXD. |
The ipv6 and mpls keywords are not supported on Cisco 7600 series routers that are configured with a Supervisor Engine 2.
When you view the output, note that a colon (:) is used to separate the fields.
For TCP intercept flows, the packet count is 0 on DFC. TCP intercept will install a zero count entry in each DFC and PFC for each intercepted flow because TCP intercept is a global feature.
Examples
This example shows how to display the NetFlow-aging configuration:
Router#
show mls netflow aging
             enable timeout  packet threshold
             ------ -------  ----------------
normal aging true       300        N/A
fast aging   true       32         100
long aging   true       900        N/A
Router#
This example shows how to display the configured protocol-creation filters:
Router
#  show mls netflow creation
Excluded protocols:
port protocol
-------+----------
10     tcp
8      udp/tcp
Router#
Supervisor Engine 720 Examples
These examples show the output from Cisco 7600 series routers that are configured with a Supervisor Engine 720.
This example shows how to display the flow mask that is set for the current NetFlow aggregation:
Router#
show mls netflow aggregation flowmask

Current flowmask set for netflow aggregation : Dest only
Minimum flowmask required for netflow aggregation schemes
----------------------+-------------------+-----------------
Aggregation Scheme Min. Flowmask Status
----------------------+-------------------+-----------------
as Intf Src Dest disabled
protocol-port Full Flow disabled
source-prefix Intf Src Dest disabled
destination-prefix Dest only enabled
prefix Intf Src Dest disabled
Router#
This example shows how to display detailed information about the NetFlow table-contention level:
Router# show mls netflow table-contention detailed
Earl in Module 2
Detailed Netflow CAM (TCAM and ICAM) Utilization
================================================
TCAM Utilization   :     0%
ICAM Utilization   :     0%
Netflow TCAM count :     0
Netflow ICAM count :     0
Router#
This example shows how to display a summary of the NetFlow table-contention level:
Router# show mls netflow table-contention summary
Earl in Module 2
Summary of Netflow CAM Utilization (as a percentage)
====================================================
TCAM Utilization   :     0%
ICAM Utilization   :     0%
Router#
Supervisor Engine 2 Examples
These examples show the output from Cisco 7600 series routers that are configured with a Supervisor Engine 2.
This example shows how to display the flow mask that is set for the current NetFlow aggregations:
Router#
show mls netflow aggregation flowmask

Current flowmask set for netflow aggregation : interface and full flow
Minimum flowmask required for netflow aggregation schemes
----------------------+-------------------+-----------------
Aggregation Scheme Min. Flowmask Status
----------------------+-------------------+-----------------
as if-dst-src enabled
protocol-port full enabled
source-prefix if-dst-src enabled
destination-prefix dst enabled
prefix if-dst-src enabled
Router#
This example shows how to display detailed information about the NetFlow table-contention level:
Router# show mls netflow table-contention detailed
Earl in Module 1
Detailed Table Contention Level Information
===========================================
Layer 3
-------
L3 Contention Level:     0
Page Hits Requiring 1 Lookup    =        0
Page Hits Requiring 2 Lookups   =        0
Page Hits Requiring 3 Lookups   =        0
Page Hits Requiring 4 Lookups   =        0
Page Hits Requiring 5 Lookups   =        0
Page Hits Requiring 6 Lookups   =        0
Page Hits Requiring 7 Lookups   =        0
Page Hits Requiring 8 Lookups   =        0
Page Misses                     =        0
Router#
This example shows how to display a summary of the NetFlow table-contention level:
Router# show mls netflow table-contention summary
Earl in Module 1
Summary of Table Contention Levels (on a scale of 0 (lowest) to 5 (highest))
============================================================================
L3 Contention Level: 0
Router#
show mls netflow ip
To display information about MLS NetFlow IP traffic, use the show mls netflow ipcommand in user EXEC or privileged EXEC mode.
Syntax Description
|
any |
Displays detailed NetFlow table-entry information with no test wrap. |
|
count |
Displays the total number of MLS NetFlow IP entries. |
|
destination hostname |
Displays the entries for a specific destination hostname. |
|
destination ip-address |
Displays the entries for a specific destination IP address. |
|
detail |
(Optional) Specifies a detailed output. |
|
dynamic |
Displays the hardware-created dynamic entries; see the show mls netflow ip dynamic command. |
|
flow icmp |
Displays information about the ICMP flows. |
|
flow tcp |
Displays information about the TCP flows. |
|
flow udp |
Displays information about the UDP flows. |
|
/ ip-mask |
Masks the IP address. |
|
module number |
Displays the entries on the specified module; see the "Usage Guidelines" section for valid values. |
|
nowrap |
Displays information without text wrap. |
|
qos |
Displays QoS microflow policing information. |
|
source hostname |
Displays the entries for a specific source address. |
|
source ip-address |
Displays the entries for a specific source IP address. |
|
sw-installed |
(Optional) Displays the routing NetFlow entries; see the show mls netflow ip sw-installed command. |
|
non-static |
(Optional) Displays information for software-installed static IP entries; see the show mls netflow ip sw-installed command. |
|
static |
(Optional) Displays information for the software-installed nonstatic IP entries; see the show mls netflow ip sw-installed command. |
Command History
|
Release |
Modification |
|---|---|
|
12.2(14)SX |
Support for this command was introduced on the Supervisor Engine 720. |
|
12.2(17a)SX |
This command was changed as follows:
|
|
12.2(17b)SXA |
Changed the syntax from show mls [ip | ipv6 | mpls] to show mls netflow [ip | ipv6 | mpls] and added the nowrap keyword. |
|
12.2(17d)SXB |
Support for this command on the Supervisor Engine 2 was extended to Release 12.2(17d)SXB. |
|
12.2(18)SXD |
This command was changed to include the following keywords:
|
|
12.2(18)SXF |
This command was changed to remove support for the any keyword. |
|
12.2(33)SRA |
This command was integrated into Cisco IOS Release 12.2(33)SRA. |
|
12.2(33)SRB |
This command was modified to show the VPN name and VPN ID in the display output. In addition, the command was modified to support per-interface NetFlow. |
Usage Guidelines
If you enter the show mls netflow ip command with no arguments, the output of the show mls netflow ip sw-installed and show mls netflow ip dynamic commands are displayed.
When you view the output, note that a colon (:) is used to separate the fields.
The multicast keyword appears on systems that are not configured with a Supervisor Engine 720.
In Cisco IOS Release 12.2SR and later, the NetFlow cache might contain null entries (with an IP source and destination address of 0.0.0.0). This behavior is the result of changes made to support per-interface NetFlow, which allows you to enable NetFlow for IPv4 traffic on individual interfaces. By default, the hardware cache is populated with information about packets received on all IP interfaces. However, if NetFlow is not enabled on an IP interface, a null flowmask is used, which results in a null cache entry being created for the interface.
Examples
This example shows how to display information about any MLS NetFlow IP:
Router# show mls netflow ip
Displaying Netflow entries in Supervisor Earl
DstIP SrcIP Prot:SrcPort:DstPort Src i/f:AdjPtr
-----------------------------------------------------------------------------
Pkts Bytes Age LastSeen Attributes
---------------------------------------------------
10.1.1.2 11.1.1.2 tcp :3 :5 Fa5/11 :0x0
459983 21159218 6 07:45:13 L3 - Dynamic
10.1.1.2 11.1.1.3 tcp :3 :5 Fa5/11 :0x0
459984 21159264 6 07:45:13 L3 - Dynamic
Router#
This example shows how to display detailed NetFlow table-entry information:
Router# show mls netflow ip detail
Displaying Netflow entries in Supervisor Earl
DstIP SrcIP Prot:SrcPort:DstPort Src i/f:AdjPtr
--------------------------------------------------------------------
Pkts Bytes Age LastSeen Attributes
---------------------------------------------------
Mask Pi R CR Xt Prio Dsc IP_EN OP_EN Pattern Rpf FIN_RDT FIN/RST
----+--+-+--+--+----+---+-----+-----+-------+---+-------+-------
Ig/acli Ig/aclo Ig/qosi Ig/qoso Fpkt Gemini MC-hit Dirty Diags
-------+-------+-------+-------+----+------+------+-----+------
QoS Police Count Threshold Leak Drop Bucket Use-Tbl Use-Enable
-----------+------------+---------+-----------+----+-------+-------+----------+
172.30.46.2 172.30.45.2 4 :0 :0 Gi7/1: 0x0
140063 6442898 15 01:42:52 L3 - Dynamic
1 1 0 0 1 0 0 1 1 0 0 0 0
0 0 0 0 0 0 0 0 0
0x0 672645504 0 0 NO 31784 NO NO
Router#
This example shows how to display NetFlow table-entry information with no test wrap:
Router# show mls netflow ip nowrap
 Displaying Netflow entries in Supervisor Earl
 DstIP SrcIP Prot:SrcPort:DstPort Src i/f
 :AdjPtr Pkts Bytes Age LastSeen Attributes
 -----------------------------------------------------------------------
 -
 ------------------------------------------------------------------
 10.1.1.2 11.1.1.92 udp :63 :63 Fa5/11
 :0x0 176339 8111594 912 22:31:15 L3 - Dynamic
 10.1.1.2 11.1.1.93 udp :63 :63 Fa5/11
 :0x0 176338 8111548 912 22:31:15 L3 - Dynamic
 10.1.1.2 11.1.1.94 udp :63 :63 Fa5/11
 :0x0 176338 8111548 912 22:31:15 L3 - Dynamic
 10.1.1.2 11.1.1.95 udp :63 :63 Fa5/11
 :0x0 176338 8111548 912 22:31:15 L3 - Dynamic
 10.1.1.2 11.1.1.96 udp :63 :63 Fa5/11
 :0x0 176338 8111548 912 22:31:15 L3 - Dynamic
 10.1.1.2 11.1.1.97 udp :63 :63 Fa5/11
 :0x0 176337 8111502 912 22:31:15 L3 - Dynamic
 10.1.1.2 11.1.1.98 udp :63 :63 Fa5/11
 :0x0 176337 8111502 912 22:31:15 L3 - Dynamic
 10.1.1.2 11.1.1.99 udp :63 :63 Fa5/11
 :0x0 176337 8111502 912 22:31:15 L3 - Dynamic
 10.1.1.2 11.1.1.100 udp :63 :63 Fa5/11
 :0x0 176337 8111502 912 22:31:15 L3 - Dynamic
Router#
This example shows how to display information about the MLS NetFlow on a specific interface:
Router#
show mls netflow ip interface FastEthernet 3/1
Displaying Netflow entries in Supervisor Earl
DstIP           SrcIP           Prot:SrcPort:DstPort  Src i/f:AdjPtr
--------------------------------------------------------------------
Pkts         Bytes       Age   LastSeen  Attributes
---------------------------------------------------
172.20.52.19    0.0.0.0         0   :0      :0        0   : 0
0            0           1635  11:05:26   L3 - Dynamic
Router#
This example shows how to display information about the MLS NetFlow on a specific IP address:
Router#
show mls netflow ip destination 172.20.52.122
Displaying Netflow entries in Supervisor Earl
DstIP           SrcIP           Prot:SrcPort:DstPort  Src i/f:AdjPtr
--------------------------------------------------------------------
Pkts         Bytes       Age   LastSeen  Attributes
---------------------------------------------------
Router#
This example shows how to display information about the MLS NetFlow on a specific flow:
Router#
show mls netflow ip flow udp
Displaying Netflow entries in Supervisor Earl
DstIP           SrcIP           Prot:SrcPort:DstPort  Src i/f:AdjPtr
--------------------------------------------------------------------
Pkts         Bytes       Age   LastSeen  Attributes
---------------------------------------------------
172.20.52.19    0.0.0.0         0   :0      :0        0   : 0
0            0           1407  11:01:32   L3 - Dynamic
Router#
This example shows how to display detailed information about the MLS NetFlow on a full-flow mask:
Router#
show mls netflow ip detail
Displaying Netflow entries in Supervisor Earl
DstIP           SrcIP           Prot:SrcPort:DstPort  Src i/f:AdjPtr
--------------------------------------------------------------------
Pkts         Bytes       Age   LastSeen  Attributes
---------------------------------------------------
    QoS     Police Count Threshold    Leak     Drop Bucket  Use-Tbl Use-Enable
-----------+------------+---------+-----------+----+-------+-------+----------+
172.20.52.19    0.0.0.0         0   :0      :0        0   : 0
0            0           1464  11:02:31   L3 - Dynamic
  0x0          0               0        0       NO   64        NO       NO
Router#
This example shows how to display detailed information about a specific flow type:
Router#
 show mls netflow ip flow icmp
Displaying Netflow entries in Supervisor Earl
DstIP SrcIP Prot:SrcPort:DstPort Src i/f
:AdjPtr
>
>---------------------------------------------------------------------------
-
-
Pkts Bytes Age LastSeen Attributes
---------------------------------------------------
10.1.1.2 11.1.10.151 icmp:0 :0 Fa5/11
:0x0
1945 89470 1062 08:45:15 L3 - Dynamic
10.1.1.2 11.1.10.153 icmp:0 :0 Fa5/11
:0x0
1945 89470 1062 08:45:15 L3 - Dynamic
10.1.1.2 11.1.10.155 icmp:0 :0 Fa5/11
:0x0
1945 89470 1062 08:45:15 L3 - Dynamic
10.1.1.2 11.1.10.157 icmp:0 :0 Fa5/11
:0x0
1945 89470 1062 08:45:15 L3 - Dynamic
10.1.1.2 11.1.10.159 icmp:0 :0 Fa5/11
:0x0
1945 89470 1062 08:45:15 L3 - Dynamic
10.1.1.2 11.1.10.161 icmp:0 :0 Fa5/11
:0x0
1945 89470 1062 08:45:15 L3 - Dynamic
10.1.1.2 11.1.10.163 icmp:0 :0 Fa5/11
:0x0
Router#
This example shows how to display QoS information:
Router
# show mls netflow ip qos

Displaying netflow qos information in Supervisor Earl
DstIP            SrcIP           Prot:SrcPort:DstPort Src i/f:AdjPtr
-------------------------------------------------------------------------
Pkts         Bytes        LastSeen   QoS   PoliceCount Threshold  Leak
-------------------------------------------------------------------------
Drop  Bucket
------------
xxx.xxxx.xxx.xxx xxx.xxx.xxx.xxx xxxx:63     :63      Fa5/11 :0x0
772357       35528422     17:59:01   xxx   xxx         xxx        xxx
xxx   xxx
Router#
This example shows how to display VPN information on a Cisco 7600 series router:
Router# show mls netflow ip module 5
Displaying Netflow entries in module 5
DstIP           SrcIP           Prot:SrcPort:DstPort  Src i/f          :AdjPtr
-----------------------------------------------------------------------------
Pkts         Bytes         Age   LastSeen  Attributes
---------------------------------------------------
10.1.1.1        10.2.0.2        0   :0      :0        vpn:red
          :0x0
504          398020        1     23:20:48   L3 - Dynamic
224.0.0.5       172.16.1.1      89  :0      :0        Fa1/1            :0x0
1            84            7     23:20:42   L2 - Dynamic
0.0.0.0         0.0.0.0         0   :0      :0        --               :0x0
2238         1582910       33    23:20:48   L3 - Dynamic
224.0.0.2       172.16.1.1      udp :646    :646      Fa1/1            :0x0
5            310           21    23:20:46   L2 - Dynamic
172.16.2.6      172.16.1.2      0   :0      :0        Fa1/1            :0x0
1            140           22    23:20:27   L2 - Dynamic
Router#
Related Commands
|
Command |
Description |
|---|---|
|
flow hardware mpls-vpn ip |
Enables NetFlow to create and export hardware cache entries for traffic entering the router on the last MPLS hop of an IPv4 MPLS VPN network. |
|
ip flow ingress |
Enables (ingress) NetFlow accounting for traffic arriving on an interface. |
|
mls flow ip |
Configures the flow mask to use for NetFlow Data Export. |
|
show mls netflow ip dynamic |
Displays the statistics for NetFlow IP entries. |
|
show mls netflow ip sw-installed |
Displays information for the software-installed IP entries. |
|
show mls netflow ip routes |
Displays the NetFlow IP routing entries. |
show mls netflow ipv6
To display information about the hardware NetFlow IPv6 configuration, use the show mls netflow ipv6 command in privileged EXEC mode.
Syntax Description
|
any |
Displays the NetFlow-aging information. |
|
count |
Displays the total number of Multilayer Switching (MLS) NetFlow IPv6 entries. |
|
module number |
(Optional) Displays the entries that are downloaded on the specified module; see the "Usage Guidelines" section for valid values. |
|
destination ipv6-address |
Displays the entries for a specific destination IPv6 address. |
|
/ ipv6-prefix |
(Optional) IPv6 prefix; valid values are from 0 to 128. |
|
detail |
Specifies a detailed output. |
|
dynamic |
Displays the hardware-created dynamic entries. |
|
flow icmp | tcp | udp |
Specifies the flow type. |
|
nowrap |
Turns off text wrapping. |
|
qos |
Displays information about quality of service (QoS) statistics. |
|
source ipv6-address |
(Optional) Displays the entries for a specific source IPv6 address. |
|
sw-installed |
(Optional) Displays the routing NetFlow entries. |
|
non-static |
(Optional) Displays information about the software-installed static IPv6 entries. |
|
static |
(Optional) Displays information about the software-installed nonstatic IPv6 entries. |
Command History
|
Release |
Modification |
|---|---|
|
12.2(17a)SX |
This command was introduced on the Supervisor Engine 720. |
|
12.2(17d)SXB |
Support for this command on the Supervisor Engine 2 was extended to Release 12.2(17d)SXB. |
|
12.2(18)SXE |
This command was changed to add the show mls netflow ipv6 qos [module number] [ nowrap ] keywords and argument on the Supervisor Engine 720 only. |
|
12.2(18)SXF |
This command was changed as follows: |
|
12.2(33)SRA |
This command was integrated into Cisco IOS Release 12.2(33)SRA. |
Examples
This example shows how to display information about the hardware NetFlow configuration:
Router# show mls netflow ipv6
Displaying Netflow entries in Supervisor Earl
DstIP                                   SrcIP
-------------------------------------------------------------------------------
Prot:SrcPort:DstPort   Src i/f          :AdjPtr
Pkts        Bytes       Age  LastSeen   Attributes
------------------------------------------------------------------------------------------
50::2                                   47::2
tcp :16     :32        Vl47             :0x0
23758       1425480     4    23:48:36   L3 (IPv6) - Dynamic
50::2                                   47::3
tcp :16     :32        Vl47             :0x0
23758       1425480     4    23:48:36   L3 (IPv6) - Dynamic
50::2                                   47::4
tcp :16     :32        Vl47             :0x0
23758       1425480     4    23:48:36   L3 (IPv6) - Dynamic
50::2                                   47::5
tcp :16     :32        Vl47             :0x0
23758       1425480     4    23:48:36   L3 (IPv6) - Dynamic
50::2                                   47::6
tcp :16     :32        Vl47             :0x0
23758       1425480     4    23:48:36   L3 (IPv6) - Dynamic
This example shows how to display IPv6 microflow policing information:
Router# show mls netflow ipv6 qos
Displaying Netflow entries in Supervisor Earl
DstIP                                   SrcIP
--------------------------------------------------------------------------------
Prot:SrcPort:DstPort  Src i/f          :AdjPtr    Pkts         Bytes
--------------------------------------------------------------------------------
LastSeen   QoS    PoliceCount  Threshold   Leak      Drop  Bucket
--------------------------------------------------------------------
101::3                                  100::2
icmp:0      :0        --               0x0          0            0
22:22:09   0x0    0                  0         0       NO  0
101::2                                  100::2
icmp:0      :0        --               0x0          0            0
22:22:09   0x0    0                  0         0       NO  0
This example shows how to display IPv6 microflow policing information for a specific module:
Router# show mls netflow ipv6 qos module 7
Displaying Netflow entries in module 7
DstIP                                   SrcIP
--------------------------------------------------------------------------------
Prot:SrcPort:DstPort  Src i/f          :AdjPtr    Pkts         Bytes
--------------------------------------------------------------------------------
LastSeen   QoS    PoliceCount  Threshold   Leak      Drop  Bucket
--------------------------------------------------------------------
101::2                                  100::2
icmp:0      :0        --               0x0          0            0
22:22:56   0x0    0                  0         0       NO  0
101::3                                  100::2
icmp:0      :0        --               0x0          0            0
22:22:56   0x0    0                  0         0       NO  0
This example shows the output display when you turn off text wrapping:
Router# show mls netflow ipv6 qos nowrap
Displaying Netflow entries in Supervisor Earl
DstIP                                   SrcIP                                   Prot:SrcPort:DstPort  Src i/f          :AdjPtr    Pkts         Bytes            LastSeen   QoS    PoliceCount  Threshold   Leak      Drop  Bucket
------------------------------------------------------------------------------------------------------------------------------------------------------------------------------------------------------------------------------------
101::3                                  100::2                                  icmp:0      :0        --               0x0          0            0              22:22:19   0x0    0                  0         0       NO  0
101::2                                  100::2                                  icmp:0      :0        --               0x0          0            0              22:22:19   0x0    0                  0         0       NO  0
This example shows the output display when you turn off text wrapping for a specific module:
Router# show mls netflow ipv6 qos nowrap module 7
Displaying Netflow entries in module 7
DstIP                                   SrcIP                                   Prot:SrcPort:DstPort  Src i/f          :AdjPtr    Pkts         Bytes            LastSeen   QoS    PoliceCount  Threshold   Leak      Drop  Bucket
------------------------------------------------------------------------------------------------------------------------------------------------------------------------------------------------------------------------------------
101::3                                  100::2                                  icmp:0      :0        --               0x0          0            0              22:22:38   0x0    0                  0         0       NO  0
101::2                                  100::2                                  icmp:0      :0        --               0x0          0            0              22:22:38   0x0    0                  0         0       NO  0
show mls netflow ip dynamic
To display the statistics for NetFlow IP entries, use the showmls netflow ip dynamic command in user EXEC or privileged EXEC mode.
Command History
|
Release |
Modification |
|---|---|
|
12.2(14)SX |
Support for this command was introduced on the Supervisor Engine 720. |
|
12.2(17a)SX |
This command replaced the show mls netflow ip statistics command. |
|
12.2(17d)SXB |
Support for this command on the Supervisor Engine 2 was extended to the 12.2 SX release. |
|
12.2(33)SRA |
This command was integrated into Cisco IOS Release 12.2(33)SRA. |
Usage Guidelines
The show mls netflow ip statisticscommand is supported on releases prior to Release 12.2(17a)SX. For Release 12.2(17a)SX and later releases, use the show mls netflow ip dynamic command.
Examples
This example shows how to display the statistics for the NetFlow IP entries:
Router> show mls netflow ip dynamic
Displaying Netflow entries in Supervisor Earl
DstIP           SrcIP           Prot:SrcPort:DstPort  Src i/f:AdjPtr
--------------------------------------------------------------------
Pkts         Bytes       Age   LastSeen  Attributes
---------------------------------------------------
Router>
This example shows how to display the statistics for the NetFlow IP entries:
Router> show mls netflow ip dynamic detail
Displaying Netflow entries in Supervisor Earl
DstIP           SrcIP           Prot:SrcPort:DstPort  Src i/f:AdjPtr
--------------------------------------------------------------------
Pkts         Bytes       Age   LastSeen  Attributes
---------------------------------------------------
    QoS     Police Count Threshold    Leak     Drop Bucket  Use-Tbl Use-Enable
-----------+------------+---------+-----------+----+-------+-------+----------+
Router>
Related Commands
|
Command |
Description |
|---|---|
|
show mls netflow ip |
Displays information about MLS NetFlow IP traffic. |
|
show mls netflow ip dynamic |
Displays the statistics for NetFlow IP entries. |
|
show mls netflow ip sw-installed |
Displays information for the software-installed IP entries. |
|
show mls netflow ip routes |
Displays the NetFlow IP routing entries. |
show mls netflow ip routes
To display the NetFlow IP routing entries, use the show mls netflow ip routes command in user EXEC or privileged EXEC mode.
Syntax Description
|
non-static |
(Optional) Displays the software-installed routing entries. |
|
static |
(Optional) Displays the software-installed static routing entries. |
|
count |
(Optional) Displays the total number of NetFlow IP routing entries. |
|
module number |
(Optional) Displays the entries that are downloaded on the specified module; see the "Usage Guidelines" section for valid values. |
|
detail |
(Optional) Specifies a detailed per-flow output. |
Usage Guidelines
The show mls netflow ip routescommand is supported on releases prior to Release 12.2(17a)SX. For Release 12.2(17a)SX and later releases, use the show mls netflow ip sw-installedcommand.
This command is not supported on Cisco 7600 series routers that are configured with a Supervisor Engine 2.
Examples
This example shows how to display the software-installed nonstatic routing entries:
Router> show mls netflow ip routes non-static
Displaying Netflow entries in Supervisor Earl
DstIP           SrcIP           Prot:SrcPort:DstPort  Src i/f:AdjPtr
--------------------------------------------------------------------
Pkts         Bytes       Age   LastSeen  Attributes
---------------------------------------------------
Router>
This example shows how to display detailed information for the software-installed nonstatic routing entries:
Router> show mls netflow ip routes non-static detail
Displaying Netflow entries in Supervisor Earl
DstIP           SrcIP           Prot:SrcPort:DstPort  Src i/f:AdjPtr
--------------------------------------------------------------------
Pkts         Bytes       Age   LastSeen  Attributes
---------------------------------------------------
    QoS     Police Count Threshold    Leak     Drop Bucket  Use-Tbl Use-Enable
-----------+------------+---------+-----------+----+-------+-------+----------+
Router>
This example shows how to display the total number of software-installed routing entries:
Router> show mls netflow ip routes count
Displaying Netflow entries in Supervisor Earl
 Number of shortcuts = 0
Router>
show mls netflow ip sw-installed
To display information for the software-installed IP entries, use the show mls netflow ip sw-installedcommand in user EXEC or privileged EXEC mode.
Syntax Description
|
non-static |
Displays the software-installed routing entries. |
|
static |
Displays the software-installed static routing entries. |
|
count |
(Optional) Displays the total number of nonstatic entries. |
|
module number |
(Optional) Displays the entries that are downloaded on the specified module; see the "Usage Guidelines" section for valid values. |
|
detail |
(Optional) Specifies a detailed per-flow output. |
Command History
|
Release |
Modification |
|---|---|
|
12.2(17a)SX |
The show mls netflow ip routes command was changed to the show mls netflow ip sw-installed command. |
|
12.2(17d)SXB |
Support for this command on the Supervisor Engine 2 was extended to the 12.2 SX release. |
|
12.2(33)SRA |
This command was integrated into Cisco IOS Release 12.2(33)SRA. |
Examples
This example shows how to display the software-installed nonstatic entries:
Router> show mls netflow ip sw-installed non-static
Displaying Netflow entries in Supervisor Earl
DstIP           SrcIP           Prot:SrcPort:DstPort  Src i/f:AdjPtr
--------------------------------------------------------------------
Pkts         Bytes       Age   LastSeen  Attributes
---------------------------------------------------
Router>
This example shows how to display detailed information for the software-installed nonstatic entries:
Router> show mls netflow ip sw-installed non-static detail
Displaying Netflow entries in Supervisor Earl
DstIP           SrcIP           Prot:SrcPort:DstPort  Src i/f:AdjPtr
--------------------------------------------------------------------
Pkts         Bytes       Age   LastSeen  Attributes
---------------------------------------------------
    QoS     Police Count Threshold    Leak     Drop Bucket  Use-Tbl Use-Enable
-----------+------------+---------+-----------+----+-------+-------+----------+
Router>
This example shows how to display the total number of software-installed nonstatic entries:
Router> show mls netflow ip sw-installed non-static count
Displaying Netflow entries in Supervisor Earl
 Number of shortcuts = 0
Router>
show mls netflow ipx
To display MLS NetFlow IPX information in the EXEC command mode, use the show mls netflow ipx command.
Syntax Description
|
count |
(Optional) Displays the total number of MLS NetFlow IPX entries. |
|
destination hostname |
(Optional) Displays the entries for a specific destination IPX hostname. |
|
destination ipx-address |
(Optional) Displays the entries for a specific destination IPX address. |
|
detail |
(Optional) Specifies a detailed output. |
|
flow |
(Optional) Changes the flow type. |
|
tcp | udp |
Specifies the flow type. |
|
interface |
(Optional) Specifies the interface. |
|
interface |
(Optional) Interface type; possible valid values are ethernet, fastethernet, gigabitethernet, tengigabitethernet, pos, atm, and ge-wan. |
|
interface-number |
(Optional) Module and port number; see the "Usage Guidelines" section for valid values. |
|
vlan vlan-id |
(Optional) Specifies the VLAN ID; valid values are from 1 to 4094. |
|
macd destination-mac-address |
(Optional) Specifies the destination MAC address. |
|
macs source- mac-address |
(Optional) Specifies the source MAC address. |
|
routes num |
(Optional) Displays the routing NetFlow entries. |
|
module number |
(Optional) Displays the entries that are downloaded on the specified module; see the "Usage Guidelines" section for valid values. |
|
source hostname |
(Optional) Displays the entries for a specific source address. |
|
source ipx-address |
(Optional) Displays the entries for a specific destination IPX address. |
|
statistics |
(Optional) Displays the statistics for NetFlow entries. |
Usage Guidelines
The show mls netflow ipx command is only supported on systems that have a version 2 Supervisior Engine.
The interface, macd, and macs keywords are not supported.
When you enter the ipx-network, the format is N.H.H.H.
When you enter the destination-mac-address, the format for the 48-bit MAC address is H.H.H.
The interface-number argument designates the module and port number. Valid values for interface-number depend on the specified interface type and the chassis and module used. For example, if you specify a Gigabit Ethernet interface and have a 48-port 10/100BASE-T Ethernet module installed in a 13-slot chassis, valid values for the module number are from 1 to 13 and valid values for the port number are from 1 to 48. These valid values also apply when entering the module number keyword and argument.
show mls sampling
To display information about the sampled NDE status, use the show mls sampling command in user EXEC or privileged EXEC mode.
sort-by
To specify the sorting criterion for the NetFlow top talkers (unaggregated top flows), use the sort-by command in NetFlow top talkers configuration mode. To disable NetFlow top talkers, use the no form of this command.
Command History
|
Release |
Modification |
|---|---|
|
12.2(25)S |
This command was introduced. |
|
12.3(11)T |
This feature was integrated into Cisco IOS Release 12.3(11)T. |
|
12.2(27)SBC |
This feature was integrated into Cisco IOS Release 12.2(27)SBC. |
|
12.2(33)SRA |
This command was integrated into Cisco IOS Release 12.2(33)SRA. |
|
12.2SX |
This command is supported in the Cisco IOS Release 12.2SX train. Support in a specific 12.2SX release of this train depends on your feature set, platform, and platform hardware. |
Usage Guidelines
Configuring NetFlow Top Talkers
You must enable NetFlow on at least one interface in the router; and configure NetFlow top talkers before you can use the show ip flow top-talkers command to display the traffic statistics for the unaggregated top flows in the network. NetFlow top talkers also requires that you configure the sort-by and top commands. Optionally, the match command can be configured to specify additional matching criteria.
Examples
In the following example, a maximum of four top talkers is configured. The sort criterion is configured to sort the list of top talkers by the total number of bytes for each top talker.
Router(config)# ip flow-top-talkers
Router(config-flow-top-talkers)# top 4
Router(config-flow-top-talkers)# sort-by bytes
The following example shows the output of the show ip flow top talkers command with the configuration from the previous example:
Router# show ip flow top-talkers

SrcIf         SrcIPaddress    DstIf         DstIPaddress    Pr SrcP DstP Bytes
Et0/0.1       10.10.18.1      Et1/0.1       172.16.10.232   11 00A1 00A1   349K
Et0/0.1       10.10.19.1      Et1/0.1       172.16.10.2     11 00A2 00A2   349K
Et0/0.1       172.30.216.196  Et1/0.1       172.16.10.2     06 0077 0077   328K
Et0/0.1       10.162.37.71    Et1/0.1       172.16.10.2     06 0050 0050   303K
4 of 4 top talkers shown. 11 flows processed
Related Commands
|
Command |
Description |
|---|---|
|
cache-timeout |
Specifies the length of time for which the list of top talkers (heaviest traffic patterns and most-used applications in the network) for the NetFlow MIB and top talkers feature is retained. |
|
ip flow-top-talkers |
Enters the configuration mode for the NetFlow MIB and top talkers (heaviest traffic patterns and most-used applications in the network) feature. |
|
match (NetFlow) |
Specifies match criteria for the NetFlow MIB and top talkers (heaviest traffic patterns and most-used applications in the network) feature. |
|
show ip cache flow |
Displays a summary of the NetFlow accounting statistics. |
|
show ip cache verbose flow |
Displays a detailed summary of the NetFlow accounting statistics. |
|
show ip flow interface |
Displays NetFlow accounting configuration for interfaces. |
|
show ip flow top-talkers |
Displays the statistics for the NetFlow accounting top talkers (heaviest traffic patterns and most-used applications in the network). |
|
top |
Specifies the maximum number of top talkers (heaviest traffic patterns and most-used applications in the network) to be displayed for the NetFlow MIB and top talkers feature. |
top
To specify the maximum number of NetFlow top talkers (unaggregated top flows) to display the statistics for, use the topcommand in NetFlow top talkers configuration mode. To disable NetFlow top talkers, use the no form of this command.
Command History
|
Release |
Modification |
|---|---|
|
12.2(25)S |
This command was introduced. |
|
12.3(11)T |
This feature was integrated into Cisco IOS Release 12.3(11)T. |
|
12.2(27)SBC |
This feature was integrated into Cisco IOS Release 12.2(27)SBC. |
|
12.2(33)SRA |
This command was integrated into Cisco IOS Release 12.2(33)SRA. |
|
12.2SX |
This command is supported in the Cisco IOS Release 12.2SX train. Support in a specific 12.2SX release of this train depends on your feature set, platform, and platform hardware. |
Usage Guidelines
Configuring NetFlow Top Talkers
You must enable NetFlow on at least one interface in the router; and configure NetFlow top talkers before you can use the show ip flow top-talkers command to display the traffic statistics for the unaggregated top flows in the network. NetFlow top talkers also requires that you configure the sort-by and top commands. Optionally, the match command can be configured to specify additional matching criteria.
Examples
In the following example, a maximum of four top talkers is configured. The sort criterion is configured to sort the list of top talkers by the total number of bytes for each top talker.
Router(config)# ip flow-top-talkers
Router(config-flow-top-talkers)# top 4
Router(config-flow-top-talkers)# sort-by bytes
The following example shows the output of the show ip flow top talkers command with the configuration from the previous example:
Router# show ip flow top-talkers

SrcIf         SrcIPaddress    DstIf         DstIPaddress    Pr SrcP DstP Bytes
Et0/0.1       10.10.18.1      Et1/0.1       172.16.10.232   11 00A1 00A1   349K
Et0/0.1       10.10.19.1      Et1/0.1       172.16.10.2     11 00A2 00A2   349K
Et0/0.1       172.30.216.196  Et1/0.1       172.16.10.2     06 0077 0077   328K
Et0/0.1       10.162.37.71    Et1/0.1       172.16.10.2     06 0050 0050   303K
4 of 4 top talkers shown. 11 flows processed
Related Commands
|
Command |
Description |
|---|---|
|
cache-timeout |
Specifies the length of time for which the list of top talkers (heaviest traffic patterns and most-used applications in the network) for the NetFlow MIB and top talkers feature is retained. |
|
ip flow-top-talkers |
Enters the configuration mode for the NetFlow MIB and top talkers (heaviest traffic patterns and most-used applications in the network) feature. |
|
match (NetFlow) |
Specifies match criteria for the NetFlow MIB and top talkers (heaviest traffic patterns and most-used applications in the network) feature. |
|
show ip cache flow |
Displays a summary of the NetFlow accounting statistics. |
|
show ip cache verbose flow |
Displays a detailed summary of the NetFlow accounting statistics. |
|
show ip flow interface |
Displays NetFlow accounting configuration for interfaces. |
|
show ip flow top-talkers |
Displays the statistics from to the top talkers (heaviest traffic patterns and most-used applications in the network). |
|
sort-by |
Specifies the sorting criterion for top talkers (heaviest traffic patterns and most-used applications in the network) to be displayed for the NetFlow MIB and top talkers feature. |