Feedback
Contents
debug ip http all through debug ip rsvp
- debug ip http all
- debug ip http authentication
- debug ip http client
- debug ip http client cookie
- debug ip http ezsetup
- debug ip http secure-all
- debug ip http secure-session
- debug ip http secure-state
- debug ip http ssi
- debug ip http ssl error
- debug ip http token
- debug ip http transaction
- debug ip http url
- debug ip icmp
- debug ip igmp
- debug ip igmp snooping
- debug ip igrp events
- debug ip igrp transactions
- debug ip inspect
- debug ip inspect ha
- debug ip inspect L2-transparent
- debug ip ips
- debug ip mbgp dampening
- debug ip mbgp updates
- debug ip mcache
- debug ip mds ipc
- debug ip mds mevent
- debug ip mds mpacket
- debug ip mds process
- debug ip mfib adjacency
- debug ip mfib db
- debug ip mfib fs
- debug ip mfib init
- debug ip mfib interface
- debug ip mfib mrib
- debug ip mfib nat
- debug ip mfib pak
- debug ip mfib platform
- debug ip mfib ppr
- debug ip mfib ps
- debug ip mfib signal
- debug ip mfib table
- debug ip mhbeat
- debug ip mobile
- debug ip mobile advertise
- debug ip mobile dyn-pbr
- debug ip mobile host
- debug ip mobile mib
- debug ip mobile redundancy
- debug ip mobile router
- debug ip mpacket
- debug ip mrib
- debug ip mrm
- debug ip mrouting
- debug ip mrouting limits
- debug ip msdp
- debug ip msdp resets
- debug ip multicast hardware-switching
- debug ip multicast redundancy
- debug ip multicast rpf tracked
- debug ip multicast topology
- debug ip nat
- debug ip nat redundancy
- debug ip nbar trace
- debug ip nbar clients
- debug ip nbar config
- debug ip nbar platform
- debug ip ospf adj
- debug ip ospf database-timer rate-limit
- debug ip ospf events
- debug ip ospf mpls traffic-eng advertisements
- debug ip ospf nsf
- debug ip ospf packet
- debug ip ospf rib
- debug ip ospf spf statistic
- debug ip packet
- debug ip pgm host
- debug ip pgm router
- debug ip pim
- debug ip pim atm
- debug ip pim auto-rp
- debug ip policy
- debug ip rbscp
- debug ip rbscp ack-split
- debug ip rgmp
- debug ip rip
- debug ip routing
- debug ip routing static bfd
- debug ip rsvp
- debug ip rsvp aggregation
- debug ip rsvp authentication
- debug ip rsvp detail
- debug ip rsvp dump-messages
- debug ip rsvp errors
- debug ip rsvp hello
- debug ip rsvp high-availability
- debug ip rsvp p2mp
- debug ip rsvp policy
- debug ip rsvp rate-limit
- debug ip rsvp reliable-msg
- debug ip rsvp sbm
- debug ip rsvp sso
- debug ip rsvp summary-refresh
- debug ip rsvp traffic-control
- debug ip rsvp wfq
debug ip http all
To enable debugging output for all HTTP processes on the system, use the debug ip http allcommand in privileged EXEC mode. To disable debugging output, use the no form of this command.
Command History
Release
Modification
12.2(15)T
This command was introduced.
12.2(31)SB2
This command was integrated into Cisco IOS Release 12.2(31)SB2.
12.2(33)SRC
This command was integrated into Cisco IOS Release 12.2(33)SRC.
12.2SX
This command is supported in the Cisco IOS Release 12.2SX train. Support in a specific 12.2SX release of this train depends on your feature set, platform, and platform hardware.
12.2(33)SB
This command was integrated into Cisco IOS Release 12.2(33)SB.
Usage Guidelines
Use this command to enable debugging messages for all HTTP processes and activity. Issuing this command is equivalent to issuing the following commands:
- debug ip http authentication
- debug ip http ezsetup
- debug ip http ssi
- debug ip http token
- debug ip http transaction
- debug ip http url
Examples
For sample output and field descriptions of this command, see the documentation of the commands listed in the “Usage Guidelines” section.
Related Commands
Command
Description
debug ip http authentication
Enables debugging output for all processes for HTTP server and client access.
debug ip http ezsetup
Displays the configuration changes that occur during the EZ Setup process.
debug ip http ssi
Displays SSI translations and SSI ECHO command execution.
debug ip http token
Displays individual tokens parsed by the HTTP server.
debug ip http transaction
Displays HTTP server transaction processing.
debug ip http url
Displays the URLs accessed from the router.
debug ip http authentication
To troubleshoot HTTP authentication problems, use the debug ip http authentication command in privileged EXEC mode. To disable debugging output, use the no form of this command.
Command History
Release
Modification
12.2(15)T
This command was introduced.
12.2(31)SB2
This command was integrated into Cisco IOS Release 12.2(31)SB2.
12.2SX
This command is supported in the Cisco IOS Release 12.2SX train. Support in a specific 12.2SX release of this train depends on your feature set, platform, and platform hardware.
Usage Guidelines
Use this command to display the authentication method the router attempted and authentication-specific status messages.
Examples
The following is sample output from the debug ip http authentication command:
Router# debug ip http authentication
Authentication for url ‘/’ ‘/’ level 15 privless ‘/’
Authentication username = ‘local15’ priv-level = 15 auth-type = local
The table below describes the significant fields shown in the display.
Related Commands
Command
Description
debug ip http all
Displays authentication processes for all HTTP server processes on the system.
debug ip http ezsetup
Displays the configuration changes that occur during the EZ Setup process.
debug ip http ssi
Displays SSI translations and SSI ECHO command execution.
debug ip http token
Displays individual tokens parsed by the HTTP server.
debug ip http transaction
Displays HTTP server transaction processing.
debug ip http url
Displays the URLs accessed from the router.
debug ip http client
To enable debugging output for the HTTP client, use the debug ip http client command in privileged EXEC mode. To disable debugging output for the HTTP client, use the no or undebug form of this command.
debug ip http client { all | api | cache | error | main | msg | socket }
no debug ip http client { all | api | cache | error | main | msg | socket }
undebug ip http client { all | api | cache | error | main | msg | socket }
Syntax Description
all
Enables debugging for all HTTP client elements.
api
Enables debugging output for the HTTP client application interface (API).
cache
Enables debugging output for the HTTP client cache.
error
Enables debugging output for HTTP communication errors.
main
Enables debugging output specific to the Voice XML (VXML) applications interacting with the HTTP client.
msg
Enables debugging output of HTTP client messages.
socket
Enables debugging output specific to the HTTP client socket.
Command History
Release
Modification
12.3(2)T
This command was introduced.
12.2(31)SB2
This command was integrated into Cisco IOS Release 12.2(31)SB2.
12.2(33)SRC
This command was integrated into Cisco IOS Release 12.2(33)SRC.
12.2SX
This command is supported in the Cisco IOS Release 12.2SX train. Support in a specific 12.2SX release of this train depends on your feature set, platform, and platform hardware.
12.2(33)SB
This command was integrated into Cisco IOS Release 12.2(33)SB.
Usage Guidelines
Use this command to display transactional information for the HTTP client for debugging purposes.
Examples
The following example shows sample debugging output for a failed copy transfer operation when the host name resolution fails:
Router# debug ip http client all
2w4d: Cache ager called
Router# copy http://www.example.com/index.html flash:index.html

Destination filename [index.html]?
Erase flash: before copying? [confirm] no

Translating "www.example.com"
% Bad IP address for host www.example.com
%Error opening http://www.example.com/index.html (I/O error)
Router#
2w4d: http_client_request:
2w4d: httpc_setup_request:
2w4d: http_client_process_request:
2w4d: HTTPC: Host name resolution failed for www.example.com
2w4d: http_transaction_free:
2w4d: http_transaction_free: freed httpc_transaction_t
The following example shows sample debugging output for a failed copy transfer operation when the source file is not available:
Router# copy http://example.com/hi/file.html flash:/file.html
Destination filename [file.html]?
%Error opening http://example.com/hi/file.html (No such file or directory)
Router#
2w4d: http_client_request:
2w4d: httpc_setup_request:
2w4d: http_client_process_request:
2w4d: httpc_request:Dont have the credentials
Thu, 17 Jul 2003 07:05:25 GMT  http://209.168.200.225/hi/file.html ok
        Protocol = HTTP/1.1
        Content-Type = text/html; charset=iso-8859-1
        Date = Thu, 17 Jul 2003 14:24:29 GMT
2w4d: http_transaction_free:
2w4d: http_transaction_free:freed httpc_transaction_t
2w4d: http_client_abort_request:
2w4d: http_client_abort_request:Bad Transaction Id
Router#
The table below describes the significant fields shown in the display.
Related Commands
Command
Description
copy
Copies a file from any supported remote location to a local file system, or from a local file system to a remote location, or from a local file system to a local file system.
ip http client connection
Configures the HTTP client connection.
ip http client password
Configures a password for all HTTP client connections.
ip http client proxy-server
Configures an HTTP proxy server.
ip http client source-interface
Configures a source interface for the HTTP client.
ip http client username
Configures a login name for all HTTP client connections.
service timestamps
Configures the time-stamping format for debugging or system logging messages.
show ip http client connection
Displays a report about HTTP client active connections.
show ip http client history
Displays the URLs accessed by the HTTP client.
show ip http client session-module
Displays a report about sessions that have registered with the HTTP client.
debug ip http client cookie
To debug the HTTP client cookie, use the debug ip http client cookiecommand in privileged EXEC mode. To disable this debugging activity, use the no form of this command.
Examples
The following is sample output from the debug ip http client cookie command:
Device# debug ip http client cookie
ClientCookie: Receiving Set-Cookie cookie1=1 domain=172.16.0.2 path=/cwmp-1-0/testacs flags=264 expire=Mon,30-Jun-2008 05:51:27 GMT now=48686D74
ClientCookie2: Receiving Set-Cookie2 cookie1= 1  domain=172.16.0.2 path=/cwmp-1-0/ flags=256 expire=60 port=0 now=48686E1A comment= commentURL=
debug ip http ezsetup
To display the configuration changes that occur during the EZ Setup process, use the debug ip http ezsetupcommand in privileged EXEC mode. To disable debugging output, use the no form of this command.
Usage Guidelines
Use this command to verify the EZ Setup actions without changing the configuration of the router.
EZ Setup is a form you fill out to perform basic router configuration from most HTML browsers.
Examples
The following sample output from the debug ip http ezsetupcommand shows the configuration changes for the router when the EZ Setup form has been submitted:
Router# debug ip http ezsetup
service timestamps debug
service timestamps log
service password-encryption
!
hostname router-name
!
enable secret router-pw
line vty 0 4
password router-pw
!
interface ethernet 0
 ip address 172.69.52.9 255.255.255.0
 no shutdown
 ip helper-address 172.31.2.132
ip name-server 172.31.2.132
isdn switch-type basic-5ess
username Remote-name password Remote-chap
interface bri 0
 ip unnumbered ethernet 0
 encapsulation ppp
 no shutdown
 dialer map ip 192.168.254.254 speed 56 name Remote-name Remote-number
 isdn spid1 spid1
 isdn spid2 spid2
 ppp authentication chap callin
 dialer-group 1
!
ip classless
access-list 101 deny udp any any eq snmp
access-list 101 deny udp any any eq ntp
access-list 101 permit ip any any
dialer-list 1 list 101
ip route 0.0.0.0 0.0.0.0 192.168.254.254
ip route 192.168.254.254 255.255.255.255 bri 0
logging buffered
snmp-server community public RO
ip http server
ip classless
ip subnet-zero
!
end
Related Commands
Command
Description
debug ip http all
Displays authentication processes for all HTTP server processes on the system.
debug ip http authentication
Displays authentication processes for HTTP server and client access.
debug ip http ssi
Displays SSI translations and SSI ECHO command execution.
debug ip http token
Displays individual tokens parsed by the HTTP server.
debug ip http transaction
Displays HTTP server transaction processing.
debug ip http url
Displays the URLs accessed from the router.
debug ip http secure-all
To generate the following output, use the debug ip http secure-all command in privileged EXEC mode:
- The debugging information generated by the debug ip http secure-session command
- The debugging information generated by the debug ip http secure-statecommand
- Debugging information for each call to the SSL driver, for use primarily by Cisco support personnel
To disable this debugging, use the no form of this command.
Usage Guidelines
This command generates the following:
- The debugging information generated by the debug ip http secure-session command. See the debug ip http secure-session command page for example debugging output.
- The debugging information generated by the debug ip http secure-state command. See the debug ip http secure-statecommand page for example debugging output.
- Debugging information for each call to the SSL driver, for use primarily by Cisco support personnel
Examples
The following example generates the following output:
- The debugging information generated by the debug ip http secure-session command
- The debugging information generated by the debug ip http secure-state command
- Debugging information for each call to the SSL driver
Router# debug ip http secure-alldebug ip http secure-session
To generate debugging information about each new secure HTTPS session when it is created, use the debug ip http secure-session command in privileged EXEC mode. To disable this debugging, use the no form of this command.
Usage Guidelines
This command generates debugging information about each new HTTPS session when it is created. When a new HTTPS session is created, debugging information is generated in the following format:
HTTPS SSL Session Established/Handshake done - Peer 10.0.0.1
state = SSL negotiation finished successfully
SessionInfo: Digest=RC4-MD5 SSLVer=SSLv3 KeyEx=RSA Auth=RSA Cipher=RC4(128) Mac=MD5
The SessionInfo fields provide the following information about the session:
- Digest-- digest mechanism
- SSLVer-- SSL or TSL version
- KeyEx-- key exchange mechanism
- Auth-- authentication mechanism
- Cipher-- encryption algorithm
- Mac-- Message Authentication Code algorithm
debug ip http secure-state
To generate debugging output each time the Secure HTTP (HTTPS) feature changes state, use the debug ip http secure-state command in privileged EXEC mode. To disable this debugging, use the no form of this command.
Usage Guidelines
This command generates debugging information each time the Secure HTTP (HTTPS) feature changes state. When the Secure HTTP (HTTPS) feature changes state, debugging information is generated in the following format:
HTTPS SSL State Change - Peer 10.0.0.1 Old State = SSLv3 read finished A, New State = SSL negotiation finished successfullydebug ip http ssi
To display information about the HTML SSI EXEC command or HTML SSI ECHO command, use the debug ip http ssi command in privileged EXEC mode. To disable debugging output, use the no form of this command.
Examples
The following is sample output from the debug ip http ssi command:
Router# debug ip http ssi
HTML: filtered command ‘exec cmd="show users"’
HTML: SSI command ‘exec’
HTML: SSI tag ‘cmd’ = "show users"
HTML: Executing CLI ‘show users’ in mode ‘exec’ done
The following line shows the contents of the SSI EXEC command:
HTML: filtered command ‘exec cmd="show users"’The following line indicates the type of SSI command that was requested:
HTML: SSI command ‘exec’The following line shows the show users argumentassigned to the tag command:
HTML: SSI tag ’cmd’ = "show users"The following line indicates that the show users command is being executed in EXEC mode:
HTML: Executing CLI ‘show users’ in mode ‘exec’ doneRelated Commands
Command
Description
debug ip http all
Displays authentication processes for all HTTP server processes on the system.
debug ip http authentication
Displays authentication processes for HTTP server and client access.
debug ip http ezsetup
Displays the configuration changes that occur during the EZ Setup process.
debug ip http token
Displays individual tokens parsed by the HTTP server.
debug ip http transaction
Displays HTTP server transaction processing.
debug ip http url
Displays the URLs accessed from the router.
debug ip http ssl error
To enable debugging messages for the secure HTTP (HTTPS) web server and client, use the debug ip http ssl error command in privileged EXEC mode. To disable debugging messages for the HTTPS web server and client, use the no form of this command.
Command History
Release
Modification
12.2(15)T
This command was introduced.
12.2(33)SRA
This command was integrated into Cisco IOS Release 12.2(33)SRA.
12.2(33)SXH
This command was integrated into Cisco IOS Release 12.2(33)SXH.
12.2SX
This command is supported in the Cisco IOS Release 12.2SX train. Support in a specific 12.2SX release of this train depends on your feature set, platform, and platform hardware.
12.2(33)SB
This command was integrated into Cisco IOS Release 12.2(33)SB.
Usage Guidelines
This command displays output for debugging purposes related to the HTTPS server and HTTPS client. HTTPS services use the Secure Socket Layer (SSL) protocol, version 3.0, for encryption.
Examples
The following is sample debugging output from the debug ip http ssl error command:
Router# 000030:00:08:01:%HTTPS:Key pair generation failed
Router# 000030:00:08:10:%HTTPS:Failed to generate self-signed cert
Router# 000030:00:08:15:%HTTPS:SSL handshake fail
Router# 000030:00:08:21:%HTTPS:SSL read fail, uninitialized hndshk ctxt
Router# 000030:00:08:25:%HTTPS:SSL write fail, uninitialized hndshk ctxt
The table below describes the debug messages shown above.
Table 3 debug ip http ssl error Field Descriptions Field
Description
%HTTPS:Key pair generation failed
The RSA key pair generation failed.
%HTTPS:Failed to generate self-signed cert
The HTTPS server or client failed to generate a self-signed certificate.
%HTTPS:SSL handshake fail
SSL connection handshake failed.
%HTTPS:SSL read fail, uninitialized hndshk ctxt
A read operation failed for SSL with an unitialized handshake context
debug ip http token
To display individual tokens parsed by the HTTP server, use the debug ip http tokencommand in privileged EXEC mode. To disable debugging output, use the no form of this command.
Usage Guidelines
Use the debug ip http token command to display low-level HTTP server parsings. To display high-level HTTP server parsings, use the debug ip http transaction command.
Examples
The following is part of sample output from the debug ip http token command. In this example, the browser accessed the router’s home page http://router-name/. The output gives the token parsed by the HTTP server and its length.
Router# debug ip http token
HTTP: token len 3: 'GET'
HTTP: token len 1: ' '
HTTP: token len 1: '/'
HTTP: token len 1: ' '
HTTP: token len 4: 'HTTP'
HTTP: token len 1: '/'
HTTP: token len 1: '1'
HTTP: token len 1: '.'
HTTP: token len 1: '0'
HTTP: token len 2: '\15\12'
HTTP: token len 7: 'Referer'
HTTP: token len 1: ':'
HTTP: token len 1: ' '
HTTP: token len 4: 'http'
HTTP: token len 1: ':'
HTTP: token len 1: '/'
HTTP: token len 1: '/'
HTTP: token len 3: 'www'
HTTP: token len 1: '.'
HTTP: token len 3: 'thesite'
HTTP: token len 1: '.'
HTTP: token len 3: 'com'
HTTP: token len 1: '/'
HTTP: token len 2: '\15\12'
HTTP: token len 10: 'Connection'
HTTP: token len 1: ':'
HTTP: token len 1: ' '
HTTP: token len 4: 'Keep'
HTTP: token len 1: '-'
HTTP: token len 5: 'Alive'
HTTP: token len 2: '\15\12'
HTTP: token len 4: 'User'
HTTP: token len 1: '-'
HTTP: token len 5: 'Agent'
HTTP: token len 1: ':'
HTTP: token len 1: ' '
HTTP: token len 7: 'Mozilla'
HTTP: token len 1: '/'
HTTP: token len 1: '2'
HTTP: token len 1: '.'
.
.
.
Related Commands
Command
Description
debug ip http all
Displays authentication processes for all HTTP server processes on the system.
debug ip http authentication
Displays authentication processes for HTTP server and client access.
debug ip http ezsetup
Displays the configuration changes that occur during the EZ Setup process.
debug ip http ssi
Displays SSI translations and SSI ECHO command execution.
debug ip http transaction
Displays HTTP server transaction processing.
debug ip http url
Displays the URLs accessed from the router.
debug ip http transaction
To display HTTP server transaction processing, use the debug ip http transactioncommand in privileged EXEC mode. To disable debugging output, use the no form of this command.
Usage Guidelines
Use the debug ip http transaction command to display what the HTTP server is parsing at a high level. To display what the HTTP server is parsing at a low level, use the debug ip http toke n command.
Examples
The following is sample output from the debug ip http transaction command. In this example, the browser accessed the router’s home page http://router-name/.
Router# debug ip http transaction
HTTP: parsed uri '/'
HTTP: client version 1.1
HTTP: parsed extension Referer
HTTP: parsed line http://www.company.com/
HTTP: parsed extension Connection
HTTP: parsed line Keep-Alive
HTTP: parsed extension User-Agent
HTTP: parsed line Mozilla/2.01 (X11; I; FreeBSD 2.1.0-RELEASE i386)
HTTP: parsed extension Host
HTTP: parsed line router-name
HTTP: parsed extension Accept
HTTP: parsed line image/gif, image/x-xbitmap, image/jpeg, image/
HTTP: parsed extension Authorization
HTTP: parsed authorization type Basic
HTTP: received GET ''
The table below describes the significant fields shown in the display.
Table 4 debug ip http transaction Field Descriptions Field
Description
HTTP: parsed uri '/'
Uniform resource identifier that is requested.
HTTP: client version 1.1
Client HTTP version.
HTTP: parsed extension Referer
HTTP extension.
HTTP: parsed line http://www.company.com/
Value of HTTP extension.
HTTP: received GET ''
HTTP request method.
Related Commands
Command
Description
debug ip http all
Displays authentication processes for all HTTP server processes on the system.
debug ip http authentication
Displays authentication processes for HTTP server and client access.
debug ip http ezsetup
Displays the configuration changes that occur during the EZ Setup process.
debug ip http token
Displays individual tokens parsed by the HTTP server.
debug ip http ssi
Displays SSI translations and SSI ECHO command execution.
debug ip http url
Displays the URLs accessed from the router.
debug ip http url
To show the URLs accessed from the router, use the debug ip http url command in privileged EXEC mode. To disable debugging output, use the no form of this command.
Usage Guidelines
Use the debug ip http urlcommand to keep track of the URLs that are accessed and to determine from which hosts the URLs are accessed.
Examples
The following is sample output from the debug ip http urlcommand. In this example, the HTTP server accessed the URLs and /exec. The output shows the URL being requested and the IP address of the host requesting the URL.
Router# debug ip http url
HTTP: processing URL '/' from host 172.31.2.141
HTTP: processing URL '/exec' from host 172.31.2.141
Related Commands
Command
Description
debug ip http all
Displays authentication processes for all HTTP server processes on the system.
debug ip http authentication
Displays authentication processes for HTTP server and client access.
debug ip http ezsetup
Displays the configuration changes that occur during the EZ Setup process.
debug ip http ssi
Displays SSI translations and SSI ECHO command execution.
debug ip http token
Displays individual tokens parsed by the HTTP server.
debug ip http transaction
Displays HTTP server transaction processing.
debug ip icmp
To display information on Internal Control Message Protocol (ICMP ) transactions, use the debug ip icmp command in privileged EXEC mode. To disable debugging output, use the no form of this command.
Usage Guidelines
This command helps you determine whether the router is sending or receiving ICMP messages. Use it, for example, when you are troubleshooting an end-to-end connection problem.
NoteFor more information about the fields in debug ip icmp command output, refer to RFC 792, Internet Control Message Protocol ; Appendix I of RFC 950, Internet Standard Subnetting Procedure ; and RFC 1256, ICMP Router Discovery Messages .
Examples
The following is sample output from the debug ip icmp command:
Router# debug ip icmp
ICMP: rcvd type 3, code 1, from 10.95.192.4
ICMP: src 10.56.0.202, dst 172.69.16.1, echo reply
ICMP: dst (10.120.1.0) port unreachable rcv from 10.120.1.15
ICMP: src 172.69.12.35, dst 172.69.20.7, echo reply
ICMP: dst (255.255.255.255) protocol unreachable rcv from 10.31.7.21
ICMP: dst (10.120.1.0) port unreachable rcv from 10.120.1.15
ICMP: dst (255.255.255.255) protocol unreachable rcv from 10.31.7.21
ICMP: dst (10.120.1.0) port unreachable rcv from 10.120.1.15
ICMP: src 10.56.0.202, dst 172.69.16.1, echo reply
ICMP: dst (10.120.1.0) port unreachable rcv from 10.120.1.15
ICMP: dst (255.255.255.255) protocol unreachable rcv from 10.31.7.21
ICMP: dst (10.120.1.0) port unreachable rcv from 10.120.1.15
The table below describes the significant fields shown in the display.
Table 5 debug ip icmp Field Descriptions Field
Description
ICMP:
Indication that this message describes an ICMP packet.
rcvd type 3
The type field can be one of the following:
- 0--Echo Reply
- 3--Destination Unreachable
- 4--Source Quench
- 5--Redirect
- 8--Echo
- 9--Router Discovery Protocol Advertisement
- 10--Router Discovery Protocol Solicitations
- 11--Time Exceeded
- 12--Parameter Problem
- 13--Timestamp
- 14--Timestamp Reply
- 15--Information Request
- 16--Information Reply
- 17--Mask Request
- 18--Mask Reply
code 1
This field is a code. The meaning of the code depends upon the type field value, as follows:
- Echo and Echo Reply--The code field is always zero.
- Destination Unreachable--The code field can have the following values:
0--Network unreachable
1--Host unreachable
2--Protocol unreachable
3--Port unreachable
4--Fragmentation needed and DF bit set
5--Source route failed
0--Redirect datagrams for the network
1--Redirect datagrams for the host
2--Redirect datagrams for the command mode of service and network
3--Redirect datagrams for the command mode of service and host
- Time Exceeded--The code field can have the following values: 0--Time to live exceeded in transit 1--Fragment reassembly time exceeded
from 10.95.192.4
Source address of the ICMP packet.
The table below describes the significant fields shown in the second line of the display.
Table 6 debug ip icmp Field Descriptions Field
Description
ICMP:
Indicates that this message describes an ICMP packet.
src 10.56.10.202
Address of the sender of the echo.
dst 172.69.16.1
Address of the receiving router.
echo reply
Indicates that the router received an echo reply.
Other messages that the debug ip icmp command can generate follow.
When an IP router or host sends out an ICMP mask request, the following message is generated when the router sends a mask reply:
ICMP: sending mask reply (255.255.255.0) to 172.69.80.23 via Ethernet0The following two lines are examples of the two forms of this message. The first form is generated when a mask reply comes in after the router sends out a mask request. The second form occurs when the router receives a mask reply with a nonmatching sequence and ID. Refer to Appendix I of RFC 950, Internet Standard Subnetting Procedures, for details.
ICMP: mask reply 255.255.255.0 from 172.69.80.31
ICMP: unexpected mask reply 255.255.255.0 from 172.69.80.32
The following output indicates that the router sent a redirect packet to the host at address 172.69.80.31, instructing that host to use the gateway at address 172.69.80.23 in order to reach the host at destination address 172.69.1.111:
ICMP: redirect sent to 172.69.80.31 for dest 172.69.1.111 use gw 172.69.80.23The following message indicates that the router received a redirect packet from the host at address 172.69.80.23, instructing the router to use the gateway at address 172.69.80.28 in order to reach the host at destination address 172.69.81.34:
ICMP: redirect rcvd from 172.69.80.23 -- for 172.69.81.34 use gw 172.69.80.28The following message is displayed when the router sends an ICMP packet to the source address (172.69.94.31 in this case), indicating that the destination address (172.69.13.33 in this case) is unreachable:
ICMP: dst (172.69.13.33) host unreachable sent to 172.69.94.31The following message is displayed when the router receives an ICMP packet from an intermediate address (172.69.98.32 in this case), indicating that the destination address (172.69.13.33 in this case) is unreachable:
ICMP: dst (172.69.13.33) host unreachable rcv from 172.69.98.32Depending on the code received (as the first table above describes), any of the unreachable messages can have any of the following “strings” instead of the “host” string in the message:
net
protocol
port
frag. needed and DF set
source route failed
prohibited
The following message is displayed when the TTL in the IP header reaches zero and a time exceed ICMP message is sent. The fields are self-explanatory.
ICMP: time exceeded (time to live) send to 10.95.1.4 (dest was 172.69.1.111)The following message is generated when parameters in the IP header are corrupted in some way and the parameter problem ICMP message is sent. The fields are self-explanatory.
ICMP: parameter problem sent to 128.121.1.50 (dest was 172.69.1.111)Based on the preceding information, the remaining output can be easily understood:
ICMP: parameter problem rcvd 172.69.80.32
ICMP: source quench rcvd 172.69.80.32
ICMP: source quench sent to 128.121.1.50 (dest was 172.69.1.111)
ICMP: sending time stamp reply to 172.69.80.45
ICMP: sending info reply to 172.69.80.12
ICMP: rdp advert rcvd type 9, code 0, from 172.69.80.23
ICMP: rdp solicit rcvd type 10, code 0, from 172.69.80.43
debug ip igmp
To display Internet Group Management Protocol (IGMP) packets received and sent, and IGMP-host related events, use the debug ip igmp command in privileged EXEC mode. To disable debugging output, use the no form of this command.
Command History
Release
Modification
10.2
This command was introduced.
12.1(3)T
Fields were added to the output of this command to support the Source Specific Multicast (SSM) feature.
12.0(23)S
The vrf keyword and vrf-name argument were added.
12.2(13)T
The vrf keyword and vrf-name argument were added.
12.2(14)S
This command was integrated into Cisco IOS Release 12.2(14)S.
12.3(2)T
Fields were added to the output of this command to support the SSM Mapping feature. The group-address attribute was added.
12.2(18)SXD3
This command was integrated into Cisco IOS Release 12.2(18)SXD3.
12.2(27)SBC
This command was integrated into Cisco IOS Release 12.2(27)SBC.
Usage Guidelines
This command helps discover whether the IGMP processes are functioning. In general, if IGMP is not working, the router process never discovers that another host is on the network that is configured to receive multicast packets. In dense mode, this situation will result in packets being delivered intermittently (a few every 3 minutes). In sparse mode, packets will never be delivered.
Use this command in conjunction with the debug ip pim and debug ip mrouting commands to observe additional multicast activity and to learn the status of the multicast routing process, or why packets are forwarded out of particular interfaces.
When SSM mapping is enabled, a debug message is displayed to indicate that the router is converting an IGMP version 2 report from the group (G) into an IGMP version 3 join. After SSM mapping has generated the appropriate IGMP version 3 report, any debug output that follows is seen as if the router had received the same IGMP version 3 report directly.
Examples
The following is sample output from the debug ip igmp command:
Router# debug ip igmp
IGMP: Received Host-Query from 172.16.37.33 (Ethernet1)
IGMP: Received Host-Report from 172.16.37.192 (Ethernet1) for 224.0.255.1
IGMP: Received Host-Report from 172.16.37.57 (Ethernet1) for 224.2.127.255
IGMP: Received Host-Report from 172.16.37.33 (Ethernet1) for 225.2.2.2
The messages displayed by the debug ip igmp command show query and report activity received from other routers and multicast group addresses.
The following is sample output from the debug ip igmp command when SSM is enabled. Because IGMP version 3 lite (IGMPv3lite) requires the host to send IGMP version 2 (IGMPv2) packets, IGMPv2 host reports also will be displayed in response to the router IGMPv2 queries. If SSM is disabled, the word “ignored” will be displayed in the debug ip igmp command output.
IGMP:Received v3-lite Report from 10.0.119.142 (Ethernet3/3), group count 1
IGMP:Received v3 Group Record from 10.0.119.142 (Ethernet3/3) for 232.10.10.10
IGMP:Update source 224.1.1.1
IGMP:Send v2 Query on Ethernet3/3 to 224.0.0.1
IGMP:Received v2 Report from 10.0.119.142 (Ethernet3/3) for 232.10.10.10
IGMP:Update source 224.1.1.1
The following is sample output from the debug ip igmpcommand when SSM static mapping is enabled. The following output indicates that the router is converting an IGMP version 2 join for group (G) into an IGMP version 3 join:
IGMP(0): Convert IGMPv2 report (*,232.1.2.3) to IGMPv3 with 2 source(s) using STATIC.The following is sample output from the debug ip igmp command when SSM DNS-based mapping is enabled. The following output indicates that a DNS lookup has succeeded:
IGMP(0): Convert IGMPv2 report (*,232.1.2.3) to IGMPv3 with 2 source(s) using DNS.The following is sample output from the debug ip igmp command when SSM DNS-based mapping is enabled and a DNS lookup has failed:
IGMP(0): DNS source lookup failed for (*, 232.1.2.3), IGMPv2 report faileddebug ip igmp snooping
To display debugging messages about Internet Group Management Protocol (IGMP) snooping services, use the debug ip igmp snooping command in privileged EXEC mode. To disable debugging output, use the no form of this command.
debug ip igmp snooping { group | management | router | timer }
no debug ip igmp snooping { group | management | router | timer }
Command History
Release
Modification
12.1(6)EA2
This command was introduced.
12.2(15)ZJ
This command was implemented on the following platforms: Cisco 2600 series, Cisco 3600 series, and Cisco 3700 series routers.
12.3(4)T
This command was integrated into Cisco IOS Release 12.3(4)T on the following platforms: Cisco 2600 series, Cisco 3600 series, and Cisco 3700 series routers.
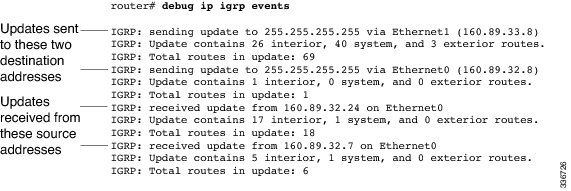
debug ip igrp events
To display summary information on Interior Gateway Routing Protocol (IGRP) routing messages that indicate the source and destination of each update, and the number of routes in each update, use the debug ip igrp events command in privileged EXEC mode. To disable debugging output, use the no form of this command.
Usage Guidelines
If the IP address of an IGRP neighbor is specified, the resulting debug ip igrp events output includes messages describing updates from that neighbor and updates that the router broadcasts toward that neighbor. Messages are not generated for each route.
This command is particularly useful when there are many networks in your routing table. In this case, using debug ip igrp transactions could flood the console and make the router unusable. Use debug ip igrp events instead to display summary routing information.
Examples
The following is sample output from the debug ip igrp events command:
This shows that the router has sent two updates to the broadcast address 255.255.255.255. The router also received two updates. Three lines of output describe each of these updates.
The first line indicates whether the router sent or received the update packet, the source or destination address, and the interface through which the update was sent or received. If the update was sent, the IP address assigned to this interface is shown (in parentheses).
IGRP: sending update to 255.255.255.255 via Ethernet1 (160.89.33.8)The second line summarizes the number and types of routes described in the update:
IGRP: Update contains 26 interior, 40 system, and 3 exterior routes.The third line indicates the total number of routes described in the update:
IGRP: Total routes in update: 69debug ip igrp transactions
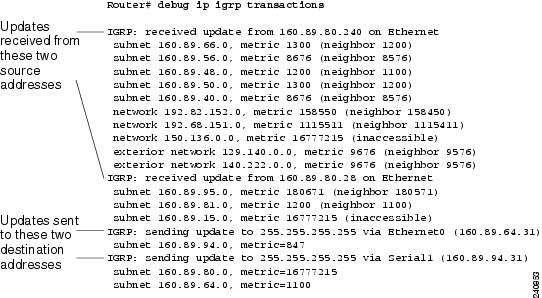
To display transaction information on Interior Gateway Routing Protocol ( IGRP) routing transactions, use the debug ip igrp transactions command in privileged EXEC mode. To disable debugging output, use the no form of this command.
Usage Guidelines
If the IP address of an IGRP neighbor is specified, the resulting debug ip igrp transactions output includes messages describing updates from that neighbor and updates that the router broadcasts toward that neighbor.
When many networks are in your routing table, the debug ip igrp transactions command can flood the console and make the router unusable. In this case, use the debug ip igrp events command instead to display summary routing information.
Examples
The following is sample output from the debug ip igrp transactions command:
The output shows that the router being debugged has received updates from two other routers on the network. The router at source address 160.89.80.240 sent information about ten destinations in the update; the router at source address 160.89.80.28 sent information about three destinations in its update. The router being debugged also sent updates--in both cases to the broadcast address 255.255.255.255 as the destination address.
On the second line the first field refers to the type of destination information: “subnet” (interior), “network” (system), or “exterior” (exterior). The second field is the Internet address of the destination network. The third field is the metric stored in the routing table and the metric advertised by the neighbor sending the information. “Metric... inaccessible” usually means that the neighbor router has put the destination in a hold down state.
The entries show that the router is sending updates that are similar, except that the numbers in parentheses are the source addresses used in the IP header. A metric of 16777215 is inaccessible.
Other examples of output that the debug ip igrp transactions command can produce follow.
The following entry indicates that the routing table was updated and shows the new edition number (97 in this case) to be used in the next IGRP update:
IGRP: edition is now 97Entries such as the following occur on startup or when some event occurs such as an interface making a transition or a user manually clearing the routing table:
IGRP: broadcasting request on Ethernet0
IGRP: broadcasting request on Ethernet1
The following type of entry can result when routing updates become corrupted between sending and receiving routers:
IGRP: bad checksum from 172.69.64.43An entry such as the following should never appear. If it does, the receiving router has a bug in the software or a problem with the hardware. In either case, contact your technical support representative.
IGRP: system 45 from 172.69.64.234, should be system 109debug ip inspect
NoteEffective with Cisco IOS Release 12.4(20)T, the debug ip inspect command is replaced by the debug policy-firewall command. See the debug policy-firewall command for more information.
To display messages about Cisco IOS Firewall events, use the debug ip inspect command in privileged EXEC mode. To disable debugging output, use the no form of this command.
debug ip inspect { function-trace | object-creation | object-deletion | events | timers | protocol | detailed | update }
Firewall MIB Statistics Syntax
debug ip inspect mib { object-creation | object-deletion | events | retrieval | update }
no debug ip inspect
Syntax Description
mib
(Optional) Displays messages about MIB functionality.
function-trace
Displays messages about software functions called by the Cisco IOS Firewall.
object-creation
Displays messages about software objects being created by the Cisco IOS Firewall. Object creation corresponds to the beginning of Cisco IOS Firewall-inspected sessions.
object-deletion
Displays messages about software objects being deleted by the Cisco IOS Firewall. Object deletion corresponds to the closing of Cisco IOS Firewall-inspected sessions.
events
Displays messages about Cisco IOS Firewall software events, including information about Cisco IOS Firewall packet processing or MIB special events.
timers
Displays messages about Cisco IOS Firewall timer events such as when the Cisco IOS Firewall idle timeout is reached.
protocol
Displays messages about Cisco IOS Firewall-inspected protocol events, including details about the packets of the protocol. The table below provides a list of protocol keywords.
detailed
Displays detailed information to be displayed for all the other enabled Cisco IOS Firewall debugging. Use this form of the command in conjunction with other Cisco IOS Firewall debug commands.
retrieval
Displays messages of statistics requested via Simple Network Management Protocol (SNMP) or command-line interface (CLI).
update
Displays messages about Cisco IOS Firewall software updates or updates to MIB counters.
Table 7 Protocol Keywords for the debug ip inspect Command Application Protocol
Protocol Keyword
Transport-layer protocols
ICMP
icmp
TCP
tcp
User Datagram Protocol (UDP)
udp
Application-layer protocols
CU-SeeMe
cuseeme
FTP commands and responses
ftp-cmd
FTP tokens (enables tracing of the FTP tokens parsed)
ftp-tokens
H.323 (version 1 and version 2)
h323
HTTP
http
IMAP
imap
Microsoft NetShow
netshow
POP3
pop3
RealAudio
realaudio
Remote procedure call (RPC)
rpc
Real Time Streaming Protocol (RTSP)
rtsp
Session Initiation Protocol (SIP)
sip
Simple Mail Transfer Protocol (SMTP)
smtp
Skinny Client Control Protocol (SCCP)
skinny
Structured Query Language*Net (SQL*Net)
sqlnet
StreamWorks
streamworks
TFTP
tftp
UNIX r-commands (rlogin, rexec, rsh)
rcmd
VDOLive
vdolive
Command History
Release
Modification
11.2 P
This command was introduced.
12.0(5)T
NetShow support was added.
12.0(7)T
H.323 V2 and RTSP protocol support were added.
12.2(11)YU
Support for the ICMP and SIP protocols was added.
12.2(15)T
This command was integrated into Cisco IOS Release 12.2(15)T.
12.3(1)
Support for the skinny protocol was added.
12.3(14)T
Support for the IMAP and POP3 protocols was added.
12.4(6)T
The MIB syntax was added.
12.2(33)SRA
This command was integrated into Cisco IOS Release 12.2(33)SRA.
12.4(20)T
This command was replaced by the debug policy-firewallcommand.
Examples
The following is sample output from the debug ip inspect function-trace command:
Router# debug ip inspect function-trace

*Mar  2 01:16:16: CBAC FUNC: insp_inspection
*Mar  2 01:16:16: CBAC FUNC: insp_pre_process_sync
*Mar  2 01:16:16: CBAC FUNC: insp_find_tcp_host_entry addr 40.0.0.1 bucket 41
*Mar  2 01:16:16: CBAC FUNC: insp_find_pregen_session
*Mar  2 01:16:16: CBAC FUNC: insp_get_idbsb
*Mar  2 01:16:16: CBAC FUNC: insp_get_idbsb
*Mar  2 01:16:16: CBAC FUNC: insp_get_irc_of_idb
*Mar  2 01:16:16: CBAC FUNC: insp_get_idbsb
*Mar  2 01:16:16: CBAC FUNC: insp_create_sis
*Mar  2 01:16:16: CBAC FUNC: insp_inc_halfopen_sis
*Mar  2 01:16:16: CBAC FUNC: insp_link_session_to_hash_table
*Mar  2 01:16:16: CBAC FUNC: insp_inspect_pak
*Mar  2 01:16:16: CBAC FUNC: insp_l4_inspection
*Mar  2 01:16:16: CBAC FUNC: insp_process_tcp_seg
*Mar  2 01:16:16: CBAC FUNC: insp_listen_state
*Mar  2 01:16:16: CBAC FUNC: insp_ensure_return_traffic
*Mar  2 01:16:16: CBAC FUNC: insp_add_acl_item
*Mar  2 01:16:16: CBAC FUNC: insp_ensure_return_traffic
*Mar  2 01:16:16: CBAC FUNC: insp_add_acl_item
*Mar  2 01:16:16: CBAC FUNC: insp_process_syn_packet
*Mar  2 01:16:16: CBAC FUNC: insp_find_tcp_host_entry addr 40.0.0.1 bucket 41
*Mar  2 01:16:16: CBAC FUNC: insp_create_tcp_host_entry
*Mar  2 01:16:16: CBAC* FUNC: insp_fast_inspection
*Mar  2 01:16:16: CBAC* FUNC: insp_inspect_pak
*Mar  2 01:16:16: CBAC* FUNC: insp_l4_inspection
*Mar  2 01:16:16: CBAC* FUNC: insp_process_tcp_seg
*Mar  2 01:16:16: CBAC* FUNC: insp_synrcvd_state
*Mar  2 01:16:16: CBAC* FUNC: insp_fast_inspection
*Mar  2 01:16:16: CBAC* FUNC: insp_inspect_pak
*Mar  2 01:16:16: CBAC* FUNC: insp_l4_inspection
*Mar  2 01:16:16: CBAC* FUNC: insp_process_tcp_seg
*Mar  2 01:16:16: CBAC* FUNC: insp_synrcvd_state
*Mar  2 01:16:16: CBAC FUNC: insp_dec_halfopen_sis
*Mar  2 01:16:16: CBAC FUNC: insp_remove_sis_from_host_entry
*Mar  2 01:16:16: CBAC FUNC: insp_find_tcp_host_entry addr 40.0.0.1 bucket 41
This output shows the functions called by the Cisco IOS Firewall as a session is inspected. Entries with an asterisk (*) after the word “CBAC” are entries when the fast path is used; otherwise, the process path is used.
The following is sample output from the debug ip inspect object-creation and debug ip inspect object-deletion commands:
Router# debug ip inspect object-creation
Router# debug ip inspect object-deletion
*Mar  2 01:18:30: CBAC OBJ_CREATE: create pre-gen sis 25A3574
*Mar  2 01:18:30: CBAC OBJ_CREATE: create acl wrapper 25A36FC -- acl item 25A3634
*Mar  2 01:18:30: CBAC OBJ_CREATE: create sis 25C1CC4
*Mar  2 01:18:30: CBAC OBJ_DELETE: delete pre-gen sis 25A3574
*Mar  2 01:18:30: CBAC OBJ_CREATE: create host entry 25A3574 addr 10.0.0.1 bucket 31
*Mar  2 01:18:30: CBAC OBJ_DELETE: delete sis 25C1CC4
*Mar  2 01:18:30: CBAC OBJ_DELETE: delete create acl wrapper 25A36FC -- acl item 25A3634
*Mar  2 01:18:31: CBAC OBJ_DELETE: delete host entry 25A3574 addr 10.0.0.1
The following is sample output from the debug ip inspect object-creation, debug ip inspect object-deletion, and debug ip inspect events commands:
Router# debug ip inspect object-creation
Router# debug ip inspect object-deletion
Router# debug ip inspect events
*Mar  2 01:18:51: CBAC OBJ_CREATE: create pre-gen sis 25A3574
*Mar  2 01:18:51: CBAC OBJ_CREATE: create acl wrapper 25A36FC -- acl item 25A3634
*Mar  2 01:18:51: CBAC Src 10.1.0.1 Port [1:65535]
*Mar  2 01:18:51: CBAC Dst 10.0.0.1 Port [46406:46406]
*Mar  2 01:18:51: CBAC Pre-gen sis 25A3574 created: 10.1.0.1[1:65535] 30.0.0.1[46406:46406]
*Mar  2 01:18:51: CBAC OBJ_CREATE: create sis 25C1CC4
*Mar  2 01:18:51: CBAC sis 25C1CC4 initiator_addr (10.1.0.1:20) responder_addr (30.0.0.1:46406) initiator_alt_addr (40.0.0.1:20) responder_alt_addr (10.0.0.1:46406)
*Mar  2 01:18:51: CBAC OBJ_DELETE: delete pre-gen sis 25A3574
*Mar  2 01:18:51: CBAC OBJ_CREATE: create host entry 25A3574 addr 10.0.0.1 bucket 31
*Mar  2 01:18:51: CBAC OBJ_DELETE: delete sis 25C1CC4
*Mar  2 01:18:51: CBAC OBJ_DELETE: delete create acl wrapper 25A36FC -- acl item 25A3634
*Mar  2 01:18:51: CBAC OBJ_DELETE: delete host entry 25A3574 addr 10.0.0.1
The following is sample output from the debug ip inspect timers command:
Router# debug ip inspect timers
*Mar  2 01:19:15: CBAC Timer Init Leaf: Pre-gen sis 25A3574
*Mar  2 01:19:15: CBAC Timer Start: Pre-gen sis 25A3574 Timer: 25A35D8 Time: 30000 milisecs
*Mar  2 01:19:15: CBAC Timer Init Leaf: sis 25C1CC4
*Mar  2 01:19:15: CBAC Timer Stop: Pre-gen sis 25A3574 Timer: 25A35D8
*Mar  2 01:19:15: CBAC Timer Start: sis 25C1CC4 Timer: 25C1D5C Time: 30000 milisecs
*Mar  2 01:19:15: CBAC Timer Start: sis 25C1CC4 Timer: 25C1D5C Time: 3600000 milisecs
*Mar  2 01:19:15: CBAC Timer Start: sis 25C1CC4 Timer: 25C1D5C Time: 5000 milisecs
*Mar  2 01:19:15: CBAC Timer Stop: sis 25C1CC4 Timer: 25C1D5C
The following is sample output from the debug ip inspect tcp command:
Router# debug ip inspect tcp
*Mar  2 01:20:43: CBAC* sis 25A3604 pak 2541C58 TCP P ack 4223720032 seq 4200176225(22) (10.0.0.1:46409) => (10.1.0.1:21)
*Mar  2 01:20:43: CBAC* sis 25A3604 ftp L7 inspect result: PROCESS-SWITCH packet
*Mar  2 01:20:43: CBAC sis 25A3604 pak 2541C58 TCP P ack 4223720032 seq 4200176225(22) (10.0.0.1:46409) => (10.1.0.1:21)
*Mar  2 01:20:43: CBAC sis 25A3604 ftp L7 inspect result: PASS packet
*Mar  2 01:20:43: CBAC* sis 25A3604 pak 2544374 TCP P ack 4200176247 seq 4223720032(30) (10.0.0. 1:46409) <= (10.1.0.1:21)
*Mar  2 01:20:43: CBAC* sis 25A3604 ftp L7 inspect result: PASS packet
*Mar  2 01:20:43: CBAC* sis 25A3604 pak 25412F8 TCP P ack 4223720062 seq 4200176247(15) (10.0.0. 1:46409) => (10.1.0.1:21)
*Mar  2 01:20:43: CBAC* sis 25A3604 ftp L7 inspect result: PASS packet
*Mar  2 01:20:43: CBAC sis 25C1CC4 pak 2544734 TCP S seq 4226992037(0) (10.1.0.1:20) => (10.0.0.1:46411)
*Mar  2 01:20:43: CBAC* sis 25C1CC4 pak 2541E38 TCP S ack 4226992038 seq 4203405054(0) (10.1.0.1:20) <= (10.0.0.1:46411)
This sample shows TCP packets being processed and lists the corresponding acknowledge (ACK) packet numbers and sequence (SEQ) numbers. The number of data bytes in the TCP packet is shown in parentheses--for example, (22). For each packet shown, the addresses and port numbers are shown separated by a colon. For example, (10.1.0.1:21) indicates an IP address of 10.1.0.1 and a TCP port number of 21.
Entries with an asterisk (*) after the word “CBAC” are entries when the fast path is used; otherwise, the process path is used.
The following is sample output from the debug ip inspect tcp and debug ip inspect detailed commands:
Router# debug ip inspect tcp
Router# debug ip inspect detailed
*Mar  2 01:20:58: CBAC* Pak 2541E38 Find session for (30.0.0.1:46409) (40.0.0.1:21) tcp
*Mar  2 01:20:58:  P ack 4223720160 seq 4200176262(22)
*Mar  2 01:20:58: CBAC* Pak 2541E38 Addr:port pairs to match: (30.0.0.1:46409) (40.0.0.1:21)
*Mar  2 01:20:58: CBAC* sis 25A3604 SIS_OPEN
*Mar  2 01:20:58: CBAC* Pak 2541E38 IP: s=30.0.0.1 (Ethernet0), d=40.0.0.1 (Ethernet1), len 76,proto=6
*Mar  2 01:20:58: CBAC sis 25A3604 Saving State: SIS_OPEN/ESTAB iisn 4200176160 i_rcvnxt 4223720160 i_sndnxt 4200176262 i_rcvwnd 8760 risn 4223719771 r_rcvnxt 4200176262 r_sndnxt 4223720160 r_rcvwnd 8760
*Mar  2 01:20:58: CBAC* sis 25A3604 pak 2541E38 TCP P ack 4223720160 seq 4200176262(22) (30.0.0.1:46409) => (40.0.0.1:21)
*Mar  2 01:20:58: CBAC* sis 25A3604 pak 2541E38 SIS_OPEN/ESTAB TCP seq 4200176262(22) Flags: ACK 4223720160 PSH
*Mar  2 01:20:58: CBAC* sis 25A3604 pak 2541E38 --> SIS_OPEN/ESTAB iisn 4200176160 i_rcvnxt 4223720160 i_sndnxt 4200176284 i_rcvwnd 8760 risn 4223719771 r_rcvnxt 4200176262 r_sndnxt 4223720160 r_rcvwnd 8760
*Mar  2 01:20:58: CBAC* sis 25A3604 L4 inspect result: PASS packet 2541E38 (30.0.0.1:46409) (40.0.0.1:21) bytes 22 ftp
*Mar  2 01:20:58: CBAC sis 25A3604 Restoring State: SIS_OPEN/ESTAB iisn 4200176160 i_rcvnxt 4223
720160 i_sndnxt 4200176262 i_rcvwnd 8760 risn 4223719771 r_rcvnxt 4200176262 r_sndnxt 4223720160 r_rcvwnd 8760
*Mar  2 01:20:58: CBAC* sis 25A3604 ftp L7 inspect result: PROCESS-SWITCH packet
*Mar  2 01:20:58: CBAC* sis 25A3604 ftp L7 inspect result: PROCESS-SWITCH packet
*Mar  2 01:20:58: CBAC* Bump up: inspection requires the packet in the process path(30.0.0.1) (40.0.0.1)
*Mar  2 01:20:58: CBAC Pak 2541E38 Find session for (30.0.0.1:46409) (40.0.0.1:21) tcp
*Mar  2 01:20:58:  P ack 4223720160 seq 4200176262(22)
*Mar  2 01:20:58: CBAC Pak 2541E38 Addr:port pairs to match: (30.0.0.1:46409) (40.0.0.1:21)
*Mar  2 01:20:58: CBAC sis 25A3604 SIS_OPEN
*Mar  2 01:20:58: CBAC Pak 2541E38 IP: s=30.0.0.1 (Ethernet0), d=40.0.0.1 (Ethernet1), len 76, proto=6
The following is sample output from the debug ip inspect icmp and debug ip inspect detailed commands:
Router# debug ip inspect icmp
Router# debug ip inspect detailed
1w6d:CBAC sis 81073F0C SIS_CLOSED
1w6d:CBAC Pak 80D2E9EC IP:s=192.168.133.3 (Ethernet1), d=0.0.0.0 (Ethernet0), len 98, proto=1
1w6d:CBAC ICMP:sis 81073F0C pak 80D2E9EC SIS_CLOSED ICMP packet (192.168.133.3:0) => (0.0.0.0:0) datalen 56
1w6d:CBAC ICMP:start session from 192.168.133.3
1w6d:CBAC sis 81073F0C --> SIS_OPENING (192.168.133.3:0) (0.0.0.0:0)
1w6d:CBAC sis 81073F0C L4 inspect result:PASS packet 80D2E9EC (192.168.133.3:0) (0.0.0.0:0) bytes 56 icmp
1w6d:CBAC sis 81073F0C SIS_OPENING
1w6d:CBAC Pak 80E72BFC IP:s=0.0.0.0 (Ethernet0), d=192.168.133.3 (Ethernet1), len 98, proto=1
1w6d:CBAC ICMP:sis 81073F0C pak 80E72BFC SIS_OPENING ICMP packet (192.168.133.3:0) <= (0.0.0.0:0) datalen 56
1w6d:CBAC sis 81073F0C --> SIS_OPEN (192.168.133.3:0) (0.0.0.0:0)
1w6d:CBAC sis 81073F0C L4 inspect result:PASS packet 80E72BFC (0.0.0.0:0) (192.168.133.3:0) bytes 56 icmp
1w6d:CBAC* sis 81073F0C SIS_OPEN
1w6d:CBAC* Pak 80D2F2C8 IP:s=192.168.133.3 (Ethernet1), d=0.0.0.0 (Ethernet0), len 98, proto=1
1w6d:CBAC* ICMP:sis 81073F0C pak 80D2F2C8 SIS_OPEN ICMP packet (192.168.133.3:0) => (0.0.0.0:0) datalen 56
1w6d:CBAC* sis 81073F0C --> SIS_OPEN (192.168.133.3:0) (0.0.0.0:0)
1w6d:CBAC* sis 81073F0C L4 inspect result:PASS packet 80D2F2C8 (192.168.133.3:0) (0.0.0.0:0) bytes 56 icmp
1w6d:CBAC* sis 81073F0C SIS_OPEN
1w6d:CBAC* Pak 80E737CC IP:s=0.0.0.0 (Ethernet0), d=192.168.133.3 (Ethernet1), len 98, proto=1
1w6d:CBAC* ICMP:sis 81073F0C pak 80E737CC SIS_OPEN ICMP packet (192.168.133.3:0) <= (0.0.0.0:0) datalen 56
1w6d:CBAC* sis 81073F0C --> SIS_OPEN (192.168.133.3:0) (0.0.0.0:0)
1w6d:CBAC* sis 81073F0C L4 inspect result:PASS packet 80E737CC (0.0.0.0:0) (192.168.133.3:0) bytes 56 icmp
1w6d:CBAC* sis 81073F0C SIS_OPEN
1w6d:CBAC* Pak 80F554F0 IP:s=192.168.133.3 (Ethernet1), d=0.0.0.0 (Ethernet0), len 98, proto=1
1w6d:CBAC* ICMP:sis 81073F0C pak 80F554F0 SIS_OPEN ICMP packet (192.168.133.3:0) => (0.0.0.0:0) datalen 56
1w6d:CBAC* sis 81073F0C --> SIS_OPEN (192.168.133.3:0) (0.0.0.0:0)
1w6d:CBAC* sis 81073F0C L4 inspect result:PASS packet 80F554F0 (192.168.133.3:0) (0.0.0.0:0) bytes 56 icmp
1w6d:CBAC* sis 81073F0C SIS_OPEN
1w6d:CBAC* Pak 80E73AC0 IP:s=0.0.0.0 (Ethernet0), d=192.168.133.3 (Ethernet1), len 98, proto=1
1w6d:CBAC* ICMP:sis 81073F0C pak 80E73AC0 SIS_OPEN ICMP packet (192.168.133.3:0) <= (0.0.0.0:0) datalen 56
1w6d:CBAC* sis 81073F0C --> SIS_OPEN (192.168.133.3:0) (0.0.0.0:0)
1w6d:CBAC* sis 81073F0C L4 inspect result:PASS packet 80E73AC0 (0.0.0.0:0) (192.168.133.3:0) bytes 56 icmp
debug ip inspect ha
To display messages about Cisco IOS stateful failover high availability (HA) events, use the debug ip inspect hacommand in privileged EXEC mode. To disable debugging output, use the no form of this command.
debug ip inspect ha [ manager | packet | update ]
no debug ip inspect ha [ manager | packet | update ]
Syntax Description
manager
(Optional) Displays detailed messages for interaction of firewall HA manager with the box-to-box high availability infrastructure.
packet
(Optional) Used to debug the processing of the first packet postfailover on the new active device.
update
(Optional) Used to debug the periodic update messages between the active and standby. The Firewall HA sends periodical messages to update the standby of the firewall sessions state on the active.
Command History
Release
Modification
12.4(6)T
This command was introduced.
12.2(33)SRA
This command was integrated into Cisco IOS Release 12.2(33)SRA.
12.2SX
This command is supported in the Cisco IOS Release 12.2SX train. Support in a specific 12.2SX release of this train depends on your feature set, platform, and platform hardware.
Examples
The following is sample output from the debug ip inspect hacommand. This example shows an add session message and a delete session message received by the the active and standby devices:
Router# debug ip inspect ha
Active debugs -
*Apr 13 17:15:20.795:  FW-HA:Send add session msg for session 2C6B820
*Apr 13 17:15:36.919:  FW-HA:Send delete session msg for session 2C6B820
Standby debugs -
*Apr 13 17:19:00.471:  FW-HA:Received add session message (10.0.0.10:56733:0)=>(11.0.0.10:23:0)
*Apr 13 17:19:12.051:  FW-HA:Received delete session message (10.0.0.10:56733:0)=>(11.0.0.10:23:0)
The following is sample output from the debug ip inspect ha managercommand. Using the manager keyword provides a more detailed debug analysis:
Router# debug ip inspect ha manager
*Apr 13 17:23:28.995: HA Message 0:flags=0x01 len=727 FW_HA_MSG_INSERT_SESSION (1)
*Apr 13 17:23:28.995:   ID: grp1
*Apr 13 17:23:28.995:   attr FW_HA_ATT_INITIATOR_ADDR (1) len 4
*Apr 13 17:23:28.995:    0A 00 00 0A
*Apr 13 17:23:28.995:   attr FW_HA_ATT_RESPONDER_ADDR (2) len 4
*Apr 13 17:23:28.995:    0B 00 00 0A
*Apr 13 17:23:28.995:   attr FW_HA_ATT_INITIATOR_PORT (3) len 2
*Apr 13 17:23:28.995:    BF 1C
*Apr 13 17:23:28.995:   attr FW_HA_ATT_RESPONDER_PORT (4) len 2
*Apr 13 17:23:28.995:    00 17
*Apr 13 17:23:28.995:   attr FW_HA_ATT_L4_PROTOCOL (5) len 4
*Apr 13 17:23:28.995:    00 00 00 01
*Apr 13 17:23:28.995:   attr FW_HA_ATT_SRC_TABLEID (6) len 1
*Apr 13 17:23:28.995:    00
*Apr 13 17:23:28.995:   attr FW_HA_ATT_DST_TABLEID (7) len 1
*Apr 13 17:23:28.995:    00
*Apr 13 17:23:28.995:   attr FW_HA_ATT_R_RCVNXT (20) len 4
*Apr 13 17:23:28.995:    79 EA E2 9A
*Apr 13 17:23:28.995:   attr FW_HA_ATT_R_SNDNXT (21) len 4
*Apr 13 17:23:28.995:    6C 7D E4 04
*Apr 13 17:23:28.995:   attr FW_HA_ATT_R_RCVWND (22) len 4
*Apr 13 17:23:28.995:    00 00 10 20
*Apr 13 17:23:28.995:   attr FW_HA_ATT_R_LAST_SEQ_TO_SND (23) len 4
*Apr 13 17:23:28.995:    00 00 00 00
*Apr 13 17:23:28.995:   attr FW_HA_ATT_I_RCVNXT (24) len 4
*Apr 13 17:23:28.995:    6C 7D E4 04
*Apr 13 17:23:28.995:   attr FW_HA_ATT_I_SNDNXT (25) len 4
*Apr 13 17:23:28.995:    79 EA E2 9A
*Apr 13 17:23:28.995:   attr FW_HA_ATT_I_RCVWND (26) len 4
*Apr 13 17:23:28.995:    00 00 10 20
*Apr 13 17:23:28.995:   attr FW_HA_ATT_I_LAST_SEQ_TO_SND (27) len 4
*Apr 13 17:23:28.995:    00 00 00 00
*Apr 13 17:23:28.995:   attr FW_HA_ATT_TCP_STATE (28) len 4
*Apr 13 17:23:28.995:    00 00 00 04
*Apr 13 17:23:28.995:   attr FW_HA_ATT_INITIATOR_ALT_ADDR (8) len 4
*Apr 13 17:23:28.995:    0A 00 00 0A
*Apr 13 17:23:28.995:   attr FW_HA_ATT_RESPONDER_ALT_ADDR (9) len 4
*Apr 13 17:23:28.995:    0B 00 00 0A
*Apr 13 17:23:28.995:   attr FW_HA_ATT_INITIATOR_ALT_PORT (10) len 2
*Apr 13 17:23:28.995:    BF 1C
*Apr 13 17:23:28.995:   attr FW_HA_ATT_RESPONDER_ALT_PORT (11) len 2
*Apr 13 17:23:28.995:    00 00
*Apr 13 17:23:28.995:   attr FW_HA_ATT_L7_PROTOCOL (12) len 4
*Apr 13 17:23:28.995:    00 00 00 05
*Apr 13 17:23:28.995:   attr FW_HA_ATT_INSP_DIR (13) len 4
*Apr 13 17:23:28.995:    00 00 00 01
*Apr 13 17:23:28.995:   attr FW_HA_ATT_I_ISN (29) len 4
*Apr 13 17:23:28.995:    79 EA E2 99
*Apr 13 17:23:28.995:   attr FW_HA_ATT_R_ISN (30) len 4
*Apr 13 17:23:28.995:    6C 7D E4 03
*Apr 13 17:23:28.995:   attr FW_HA_ATT_APPL_INSP_FLAGS (15) len 2
*Apr 13 17:23:28.995:    00 10
*Apr 13 17:23:28.995:   attr FW_HA_ATT_TERM_FLAGS (16) len 1
*Apr 13 17:23:28.995:    00
*Apr 13 17:23:28.995:   attr FW_HA_ATT_IS_LOCAL_TRAFFIC (17) len 1
*Apr 13 17:23:28.995:    00
*Apr 13 17:23:28.995:   attr FW_HA_ATT_DATA_DIR (18) len 4
*Apr 13 17:23:28.995:    00 00 00 00
*Apr 13 17:23:28.995:   attr FW_HA_ATT_SESSION_LIMITING_DONE (19) len 1
*Apr 13 17:23:28.995:    00
*Apr 13 17:23:28.995:   attr FW_HA_ATT_INSPECT_RULE (14) len 256
*Apr 13 17:23:28.995:    74 65 73 74 00 00 00 00
debug ip inspect L2-transparent
To enable debugging messages for transparent firewall events, use the debug ip inspect L2-transparent command in privileged EXEC mode. To disable debugging messages, use the no form of this command.
debug ip inspect L2-transparent { packet | dhcp-passthrough }
no debug ip inspect L2-transparent { packet | dhcp-passthrough }
Syntax Description
packet
Displays messages for all debug packets that are inspected by the transparent firewall.
Note Only IP packets (TCP, User Datagram Protocol [UDP], and Internet Control Management Protocol [ICMP]) are subjected to inspection by the transparent firewall.
dhcp-passthrough
Displays debug messages only for DHCP pass-through traffic that the transparent firewall forwards across the bridge.
To allow a transparent firewall to forward DHCP pass-through traffic, use the ip inspect L2-transparent dhcp-passthrough command.
Usage Guidelines
The debug ip inspect L2-transparentcommand can be used to help verify and troubleshoot transparent firewall-related configurations, such as a Telnet connection from the client to the server with inspection configured.
Examples
The following example shows how the transparent firewall debug command works in a basic transparent firewall configuration. (Note that each debug message is preceded by an asterisk (*).)
! Enable debug commands. Router# debug ip inspect L2-transparent packet INSPECT L2 firewall debugging is on Router# debug ip inspect object-creation INSPECT Object Creations debugging is on Router# debug ip inspect object-deletion INSPECT Object Deletions debugging is on ! Start the transparent firewall configuration process Router# config terminal Enter configuration commands, one per line. End with CNTL/Z. ! Configure bridging Router(config)# bridge 1 protocol ieee Router(config)# bridge irb Router(config)# bridge 1 route ip Router(config)# interface bvi1 *Mar 1 00:06:42.511:%LINK-3-UPDOWN:Interface BVI1, changed state to down. Router(config-if)# ip address 209.165.200.225 255.255.255.254 ! Configure inspection Router(config)# ip inspect name test tcp ! Following debugs show the memory allocated for CBAC rules. *Mar 1 00:07:21.127:CBAC OBJ_CREATE:create irc 817F04F0 (test) *Mar 1 00:07:21.127:CBAC OBJ_CREATE:create irt 818AED20 Protocol:tcp Inactivity time:0 test Router(config)# ip inspect name test icmp Router(config)# *Mar 1 00:07:39.211:CBAC OBJ_CREATE:create irt 818AEDCC Protocol:icmp Inactivity time:0 ! Configure Bridging on ethernet0 interface Router(config)# interface ethernet0 Router(config-if)# bridge-group 1 *Mar 1 00:07:49.071:%LINK-3-UPDOWN:Interface BVI1, changed state to up *Mar 1 00:07:50.071:%LINEPROTO-5-UPDOWN:Line protocol on Interface BVI1, changed state to up ! Configure inspection on ethernet0 interface Router(config-if)# ip inspect test in Router(config-if)# *Mar 1 00:07:57.543:CBAC OBJ_CREATE:create idbsb 8189CBFC (Ethernet0) ! Incremented the number of bridging interfaces configured for inspection */ *Mar 1 00:07:57.543:L2FW:Incrementing L2FW i/f count Router(config-if)# interface ethernet1 ! Configure bridging and ACL on interface ethernet1 Router(config-if)# bridge-group 1 Router(config-if)# ip access-group 101 in *Mar 1 00:08:26.711:%LINEPROTO-5-UPDOWN:Line protocol on Interface Ethernet1, changed state to up Router(config-if)# enddebug ip ips
To enable debugging messages for Cisco IOS Intrusion Prevention System (IPS), use the debug ip ips command in privileged EXEC mode. To disable debugging messages, use the no form of this command.
Syntax Description
engine
(Optional) Displays debugging messages only for a specific signature engine.
detailed
(Optional) Displays detailed debugging messages for the specified signature engine or for all IPS actions.
service-msrpc
(Optional) Displays debugging messages for Microsoft RPC (Remote Procedure Call) (MSRPC) actions.
service-sm
(Optional) Displays debugging messages for Microsoft SMB(Server Message Block) actions.
debug ip mbgp dampening
To log route flap dampening activity related to multiprotocol Border Gateway Protocol (BGP), use the debug ip mbgp dampeningcommand in privileged EXEC mode. To disable debugging output, use the no form of this command.
Examples
The following is sample output from the debug ip mbgp dampening command:
Router# debug ip mbgp dampening
BGP: charge penalty for 173.19.0.0/16 path 49 with halflife-time 15 reuse/suppress 750/2000
BGP: flapped 1 times since 00:00:00. New penalty is 1000
BGP: charge penalty for 173.19.0.0/16 path 19 49 with halflife-time 15 reuse/suppress 750/2000
BGP: flapped 1 times since 00:00:00. New penalty is 1000
debug ip mbgp updates
To log multiprotocol Border Gateway Protocol (BGP)-related information passed in BGP update messages, use the debug ip mbgp updatescommand in privileged EXEC mode. To disable debugging output, use the no form of this command.
Command Default
Logging for multiprotocol BGP-related information in BGP update messages is not enabled.
Examples
The following is sample output from the debug ip mbgp updates command:
Router# debug ip mbgp updates
BGP: NEXT_HOP part 1 net 200.10.200.0/24, neigh 171.69.233.49, next 171.69.233.34
BGP: 171.69.233.49 send UPDATE 200.10.200.0/24, next 171.69.233.34, metric 0, path 33 34 19 49 109 65000 297 3561 6503
BGP: NEXT_HOP part 1 net 200.10.202.0/24, neigh 171.69.233.49, next 171.69.233.34
BGP: 171.69.233.49 send UPDATE 200.10.202.0/24, next 171.69.233.34, metric 0, path 33 34 19 49 109 65000 297 1239 1800 3597
BGP: NEXT_HOP part 1 net 200.10.228.0/22, neigh 171.69.233.49, next 171.69.233.34
BGP: 171.69.233.49 rcv UPDATE about 222.2.2.0/24, next hop 171.69.233.49, path 49 109 metric 0
BGP: 171.69.233.49 rcv UPDATE about 131.103.0.0/16, next hop 171.69.233.49, path 49 109 metric 0
BGP: 171.69.233.49 rcv UPDATE about 206.205.242.0/24, next hop 171.69.233.49, path 49 109 metric 0
BGP: 171.69.233.49 rcv UPDATE about 1.0.0.0/8, next hop 171.69.233.49, path 49 19 metric 0
BGP: 171.69.233.49 rcv UPDATE about 198.1.2.0/24, next hop 171.69.233.49, path 49 19 metric 0
BGP: 171.69.233.49 rcv UPDATE about 171.69.0.0/16, next hop 171.69.233.49, path 49 metric 0
BGP: 171.69.233.49 rcv UPDATE about 172.19.0.0/16, next hop 171.69.233.49, path 49 metric 0
BGP: nettable_walker 172.19.0.0/255.255.0.0 calling revise_route
BGP: revise route installing 172.19.0.0/255.255.0.0 -> 171.69.233.49
BGP: 171.69.233.19 computing updates, neighbor version 267099, table version 267100, starting at 0.0.0.0
BGP: NEXT_HOP part 1 net 172.19.0.0/16, neigh 171.69.233.19, next 171.69.233.49
BGP: 171.69.233.19 send UPDATE 172.19.0.0/16, next 171.69.233.49, metric 0, path 33 49
BGP: 1 updates (average = 46, maximum = 46)
BGP: 171.69.233.19 updates replicated for neighbors : 171.69.233.34, 171.69.233.49, 171.69.233.56
BGP: 171.69.233.19 1 updates enqueued (average=46, maximum=46)
BGP: 171.69.233.19 update run completed, ran for 0ms, neighbor version 267099, start version 267100, throttled to 267100, check point net 0.0.0.0
debug ip mcache
NoteEffective with Cisco IOS Release 15.0(1)M and Cisco IOS Release 12.2(33)SRE, the debug ip mcachecommand is not available in Cisco IOS software.
To display IP multicast fast-switching events, use the debug ip mcachecommand in privileged EXEC mode. To disable debugging output, use the no form of this command.
debug ip mcache [ vrf vrf-name ] [ hostname | group-address ]
no debug ip mcache [ vrf vrf-name ] [ hostname | group-address ]
Command History
Release
Modification
11.0
This command was introduced.
12.0(23)S
The vrf keyword and vrf-name argument were added.
12.2(13)T
This command was integrated into Cisco IOS Release 12.2(13)T.
12.2(14)S
This command was integrated into Cisco IOS Release 12.2(14)S.
12.2(27)SBC
This command was integrated into Cisco IOS Release 12.2(27)SBC.
12.2(33)SRA
This command was integrated into Cisco IOS Release 12.2(33)SRA.
15.0(1)M
This command was removed.
12.2(33)SRE
This command was removed.
Examples
The following is sample output from the debug ip mcache command when an IP multicast route is cleared:
Router# debug ip mcache
IP multicast fast-switching debugging is on

Router# clear ip mroute *
MRC: Build MAC header for (172.31.60.185/32, 224.2.231.173), Ethernet0
MRC: Fast-switch flag for (172.31.60.185/32, 224.2.231.173), off -> on, caller ip_mroute_replicate-1
MRC: Build MAC header for (172.31.191.10/32, 224.2.127.255), Ethernet0
MRC: Build MAC header for (172.31.60.152/32, 224.2.231.173), Ethernet0
The table below describes the significant fields shown in the display.
Related Commands
Command
Description
debug ip dvmrp
Displays information on DVMRP packets received and sent.
debug ip igmp
Displays IGMP packets received and sent, and IGMP-host related events.
debug ip igrp transactions
Displays transaction information on IGRP routing transactions.
debug ip mrm
Displays MRM control packet activity.
debug ip sd
Displays all SD announcements received.
debug ip mds ipc
To debug multicast distributed switching ( MDS) interprocessor communication, that is, synchronization between the Multicast Forwarding Information Base (MFIB) on the line card and the multicast routing table in the Route Processor (RP), use the debug ip mds ipccommand in privileged EXEC mode. To disable debugging output, use the no form of this command.
Examples
The following is sample output from the debug ip mds ipc packet command:
Router# debug ip mds ipc packet
MDFS ipc packet debugging is on
Router#
MDFS: LC sending statistics message to RP with code 0 of size 36
MDFS: LC sending statistics message to RP with code 1 of size 680
MDFS: LC sending statistics message to RP with code 2 of size 200
MDFS: LC sending statistics message to RP with code 3 of size 152
MDFS: LC sending window message to RP with code 36261 of size 8
MDFS: LC received IPC packet of size 60 sequence 36212
The following is sample output from the debug ip mds ipc event command:
Router# debug ip mds ipc event
MDFS: LC received invalid sequence 21 while expecting 20
debug ip mds mevent
To debug Multicast Forwarding Information Base (MFIB) route creation, route updates, and so on, use the debug ip mds meventcommand in privileged EXEC mode. To disable debugging output, use the no form of this command.
Examples
The following is sample output from the debug ip mds meventcommand:
Router# debug ip mds mevent
MDFS mroute event debugging is on
Router#clear ip mdfs for *
Router#
MDFS: Create (*, 239.255.255.255)
MDFS: Create (192.168.1.1/32, 239.255.255.255), RPF POS2/0/0
MDFS: Add OIF for mroute (192.168.1.1/239.255.255.255) on Fddi0/0/0
MDFS: Create (*, 224.2.127.254)
MDFS: Create (192.168.1.1/32, 224.2.127.254), RPF POS2/0/0
MDFS: Add OIF for mroute (192.168.1.1/224.2.127.254) on Fddi0/0/0
MDFS: Create (128.9.160.67/32, 224.2.127.254), RPF POS2/0/0
debug ip mds mpacket
debug ip mds process
To debug line card process level events, use the debug ip mds processcommand in privileged EXEC mode. To disable debugging output, use the no form of this command.
Examples
The following is sample output from the debug ip mds processcommand:
Router# debug ip mds process
MDFS process debugging is on
Mar 19 16:15:47.448: MDFS: RP queueing mdb message for (210.115.194.5, 224.2.127.254) to all linecards
Mar 19 16:15:47.448: MDFS: RP queueing midb message for (210.115.194.5, 224.2.127.254) to all linecards
Mar 19 16:15:47.628: MDFS: RP servicing low queue for LC in slot 0
Mar 19 16:15:47.628: MDFS: RP servicing low queue for LC in slot 2
Mar 19 16:15:48.229: MDFS: RP queueing mdb message for (171.68.224.10, 224.2.127.254) to all linecards
Mar 19 16:15:48.229: MDFS: RP queueing mdb message for (171.68.224.10, 224.2.127.254) to all linecards
Mar 19 16:15:48.229: MDFS: RP queueing mdb message for (171.69.67.106, 224.2.127.254) to all linecards
Mar 19 16:15:48.229: MDFS: RP queueing mdb message for (171.69.67.106, 224.2.127.254) to all linecards
Mar 19 16:15:48.229: MDFS: RP queueing mdb message for (206.14.154.181, 224.2.127.254) to all linecards
Mar 19 16:15:48.229: MDFS: RP queueing mdb message for (206.14.154.181, 224.2.127.254) to all linecards
Mar 19 16:15:48.233: MDFS: RP queueing mdb message for (210.115.194.5, 224.2.127.254) to all linecards
debug ip mfib adjacency
debug ip mfib db
To enable debugging output for IPv4 Multicast Forwarding Information Base (MFIB) route database management activity, use the debug ip mfib db command in privileged EXEC mode. To disable debugging output, use the no form of this command.
debug ip mfib [ vrf { vrf-name | * } ] db [ source-address [group-address] | group-address [source-address] ]
no debug ip mfib [ vrf { vrf-name | * } ] db [ source-address [group-address] | group-address [source-address] ]
Syntax Description
vrf {vrf-name | *}
(Optional) Enables debugging output for IPv4 MFIB route database management activity associated with Multicast Virtual Private Network (MVPN) routing and forwarding (MVRF) instances.
After specifying the optional vrf keyword, you must specify either:
- vrf-name --Name of an MVRF. Enables debugging output for IPv4 MFIB route database management activity associated with the MVRF specified for the vrf-name argument.
- * --Enables debugging output for route database management activity associated with all tables (all MVRF tables and the global table).
source-address
(Optional) Multicast source address.
group-address
(Optional) Multicast group address.
debug ip mfib fs
To enable debugging output for IPv4 Multicast Forwarding Information Base (MFIB) fast switching activity, use the debug ip mfib fscommand in privileged EXEC mode. To disable debugging output, use the no form of this command.
debug ip mfib [ vrf { vrf-name | * } ] fs [ source-address [group-address] | group-address [source-address] ]
no debug ip mfib [ vrf { vrf-name | * } ] fs [ source-address [group-address] | group-address [source-address] ]
Syntax Description
vrf {vrf-name | *}
(Optional) Enables debugging output for IPv4 MFIB fast switching activity associated with Multicast Virtual Private Network (MVPN) routing and forwarding (MVRF) instances.
After specifying the optional vrf keyword, you must specify either:
- vrf-name --Name of an MVRF. Enables debugging output for IPv4 MFIB fast switching activity associated with the MVRF specified for the vrf-name argument.
- * --Enables debugging output for IPv4 MFIB fast switching activity associated with all tables (all MVRF tables and the global table).
source-address
(Optional) Multicast source address.
group-address
(Optional) Multicast group address.
debug ip mfib init
debug ip mfib interface
debug ip mfib mrib
To enable debugging output for IPv4 Multicast Forwarding Information Base (MFIB) communication with the IPv4 Multicast Routing Information Base (MRIB), use the debug ip mfib mribcommand in privileged EXEC mode. To disable debugging output, use the no form of this command.
debug ip mfib [ vrf { vrf-name | * } ] mrib [ source-address [group-address] | group-address [source-address] ] [detail]
no debug ip mfib [ vrf { vrf-name | * } ] mrib [ source-address [group-address] | group-address [source-address] ] [detail]
Syntax Description
vrf {vrf-name| *]
(Optional) Enables debugging output for IPv4 MFIB communication with the IPv4 MRIB associated with Multicast Virtual Private Network (MVPN) routing and forwarding (MVRF) instances.
After specifying the optional vrf keyword, you must specify either:
- vrf-name --Name of an MVRF. Enables debugging output for IPv4 MFIB communication with the IPv4 MRIB associated with the MVRF specified for the vrf-name argument.
- * --Enables debugging output for IPv4 MFIB communication with the IPv4 MRIB associated with all tables (all MVRF tables and the global table).
source-address
(Optional) Multicast source address.
group-address
(Optional) Multicast group address.
detail
(Optional) Displays detailed debugging output for IPv4 MFIB communication with the IPv4 MRIB.
debug ip mfib nat
To enable debugging output for IPv4 Multicast Forwarding Information Base (MFIB) Network Address Translation (NAT) events associated with all tables, use the debug ip mfib natcommand in privileged EXEC mode. To disable debugging output, use the no form of this command.
debug ip mfib nat [ source-address [group-address] | group-address [source-address] ]
no debug ip mfib nat [ source-address [group-address] | group-address [source-address] ]
debug ip mfib pak
To enable debugging output for IPv4 Multicast Forwarding Information Base (MFIB) packet forwarding activity, use the debug ip mfib pakcommand in privileged EXEC mode. To disable debugging output, use the no form of this command.
debug ip mfib [ vrf { vrf-name | * } ] pak [ source-address [group-address] | group-address [source-address] ]
no debug ip mfib [ vrf { vrf-name | * } ] pak [ source-address [group-address] | group-address [source-address] ]
Syntax Description
vrf {vrf-name | *
(Optional) Enables debugging output for IPv4 MFIB packet forwarding activity associated with Multicast Virtual Private Network (MVPN) routing and forwarding (MVRF) instances.
After specifying the optional vrf keyword, you must specify either:
- * --Enables debugging output for IPv4 MFIB packet forwarding activity associated with all tables (all MVRF tables and the global table).
- vrf-name --Name of an MVRF. Enables debugging output for IPv4 MFIB packet forwarding activity associated with the MVRF specified for the vrf-name argument.
source-address
(Optional) Multicast source address.
group-address
(Optional) Multicast group address.
debug ip mfib platform
To enable debugging output related to the hardware platform use of IPv4 Multicast Forwarding Information Base (MFIB) application program interfaces (APIs), use the debug ip mfib platformcommand in privileged EXEC mode. To disable debugging output, use the no form of this command.
debug ip mfib [ vrf { vrf-name | * } ] platform { api | callbacks | errors | notify | trnx }
no debug ip mfib [ vrf { vrf-name | * } ] platform { api | callbacks | errors | notify | trnx }
Syntax Description
vrf {vrf-name | *}
(Optional) Enables debugging output related to the hardware platform use of IPv4 MFIB APIs associated with Multicast Virtual Private Network (MVPN) routing and forwarding (MVRF) instances.
After specifying the optional vrf keyword, you must specify either:
- vrf-name --Name of an MVRF. Enables debugging output related to the hardware platform use of IPv4 MFIB APIs associated with the MVRF specified for the vrf-name argument.
- * --Enables debugging output related to the hardware platform use of IPv4 MFIB APIs associated with all tables (all MVRF tables and the global table).
api
Enables debugging output related to the hardware platform use of IPv4 MFIB API calls.
callbacks
Enables debugging output related to the hardware platform use of IPv4 MFIB API callbacks.
errors
Enables debugging output related to the hardware platform use of IPv4 MFIB API errors.
notify
Enables debugging output related to the hardware platform use of IPv4 MFIB notifications.
trnx
Enables debugging output related to the hardware platform use of IPv4 MFIB database transactions.
debug ip mfib ppr
To enable debugging output for IPv4 Multicast Forwarding Information Base (MFIB) packet preservation events, use the debug ip mfib pprcommand in privileged EXEC mode. To disable debugging output, use the no form of this command.
debug ip mfib [ vrf { vrf-name | * } ] ppr [ errors | limit | preserve | release | trnx ] [ source-address [group-address] | group-address [source-address] ]
no debug ip mfib [ vrf { vrf-name | * } ] ppr [ errors | limit | preserve | release | trnx ] [ source-address [group-address] | group-address [source-address] ]
Syntax Description
vrf {vrf-name | *}
(Optional) Enables debugging output for IPv4 MFIB packet preservation events associated with Multicast Virtual Private Network (MVPN) routing and forwarding (MVRF) instances.
After specifying the optional vrf keyword, you must specify either:
- vrf-name --Name of an MVRF. Enables debugging output for IPv4 MFIB packet preservation events associated with the MVRF specified for the vrf-name argument.
- * --Enables debugging output for IPv4 MFIB packet preservation events associated with all tables (all MVRF tables and the global table).
errors
(Optional) Enables debugging output for IPv4 MFIB packet preservation errors.
limit
(Optional) Enables debugging output for IPv4 MFIB packet preservation limits.
preserve
(Optional) Enables debugging output for IPv4 MFIB packet preservation events.
release
(Optional) Enables debugging output for IPv4 MFIB packet preservation release events.
trnx
(Optional) Enables debugging output for IPv4 MFIB packet preservation database transaction events.
source-address
(Optional) Multicast source address.
group-address
(Optional) Multicast group address.
debug ip mfib ps
To enable debugging output for IPv4 Multicast Forwarding Information Base (MFIB) process switching activity, use the debug ip mfib pscommand in privileged EXEC mode. To disable debugging output, use the no form of this command.
debug ip mfib [ vrf { vrf-name | * } ] ps [ source-address [group-address] | group-address [source-address] ]
no debug ip mfib [ vrf { vrf-name | * } ] ps [ source-address [group-address] | group-address [source-address] ]
Syntax Description
vrf {vrf-name | *}
(Optional) Enables debugging output for IPv4 MFIB process switching activity associated with Multicast Virtual Private Network (MVPN) routing and forwarding (MVRF) instances.
After specifying the optional vrf keyword, you must specify either:
- vrf-name --Name of an MVRF. Enables debugging output for IPv4 MFIB process switching activity associated with the MVRF specified for the vrf-name argument.
- * --Enables debugging output for IPv4 MFIB process switching activity associated with all tables (all MVRF tables and the global table).
source-address
(Optional) Multicast source address.
group-address
(Optional) Multicast group address.
debug ip mfib signal
To enable debugging output for IPv4 Multicast Forwarding Information Base (MFIB) signal activity, use the debug ip mfib signalcommand in privileged EXEC mode. To disable debugging output, use the no form of this command.
debug ip mfib [ vrf { vrf-name | * } ] signal [ source-address [group-address] | group-address [source-address] ]
no debug ip mfib [ vrf { vrf-name | * } ] signal [ source-address [group-address] | group-address [source-address] ]
Syntax Description
vrf {vrf-name | *}
(Optional) Enables debugging output for IPv4 MFIB signal activity associated with Multicast Virtual Private Network (MVPN) routing and forwarding (MVRF) instances.
After specifying the optional vrf keyword, you must specify either:
- vrf-name --Name of an MVRF. Enables debugging output for IPv4 MFIB signal activity associated with the MVRF specified for the vrf-name argument.
- * --Enables debugging output for IPv4 MFIB fast signal activity associated with all tables (all MVRF tables and the global table).
source-address
(Optional) Multicast source address.
group-address
(Optional) Multicast group address.
Examples
The following example shows how to enable debugging output for IPv4 MFIB signal activity for the default IPv4 table:
Router# debug ip mfib signalThe following example shows how to enable debugging output for IPv4 MFIB signal activity for the group 224.0.1.40, the source 10.1.1.1, and for the VRF Mgmt-intf:
Router# debug ip mfib vrf Mgmt-intf signal 10.1.1.1 224.0.1.40debug ip mfib table
To enable debugging output for IPv4 Multicast Forwarding Information Base (MFIB) table activity, use the debug ip mfib tablecommand in privileged EXEC mode. To disable debugging output, use the no form of this command.
debug ip mfib [ vrf { vrf-name | * } ] table { db | mrib }
no debug ip mfib [ vrf { vrf-name | * } ] table { db | mrib }
Syntax Description
vrf {vrf-name | *}
(Optional) Enables debugging output for IPv4 MFIB signal activity associated with Multicast Virtual Private Network (MVPN) routing and forwarding (MVRF) instances.
After specifying the optional vrf keyword, you must specify either:
- vrf-name --Name of an MVRF. Enables debugging output for IPv4 MFIB signal activity associated with the MVRF specified for the vrf-name argument.
- * --Enables debugging output for IPv4 MFIB fast signal activity associated with all tables (all MVRF tables and the global table).
db
Enables debugging output for IPv4 MFIB database table events and operations.
mrib
Enables debugging output for IPv4 MFIB Multicast Routing Information Base (MRIB) API table events and operations.
debug ip mhbeat
To monitor the action of the heartbeat trap, use the debug ip mhbeatcommand in privileged EXEC mode. To disable debugging output, use the no form of this command.
Examples
The following is sample output from the debug ip mhbeat command.
Router# debug ip mhbeat IP multicast heartbeat debugging is on Router debug snmp packets SNMP packet debugging is on ! Router(config)# ip multicast heartbeat intervals-of 10 Dec 23 13:34:21.132: MHBEAT: ip multicast-heartbeat group 224.0.1.53 port 0 source 0.0.0.0 0.0.0.0 at-least 3 in 5 intervals-of 10 secondsd Router# Dec 23 13:34:23: %SYS-5-CONFIG_I: Configured from console by console Dec 23 13:34:31.136: MHBEAT: timer ticked, t=1,i=1,c=0 Dec 23 13:34:41.136: MHBEAT: timer ticked, t=2,i=2,c=0 Dec 23 13:34:51.136: MHBEAT: timer ticked, t=3,i=3,c=0 Dec 23 13:35:01.136: MHBEAT: timer ticked, t=4,i=4,c=0 Dec 23 13:35:11.136: MHBEAT: timer ticked, t=5,i=0,c=0 Dec 23 13:35:21.135: Send SNMP Trap for missing heartbeat Dec 23 13:35:21.135: SNMP: Queuing packet to 171.69.55.12 Dec 23 13:35:21.135: SNMP: V1 Trap, ent ciscoExperiment.2.3.1, addr 4.4.4.4, gentrap 6, spectrap 1 ciscoIpMRouteHeartBeat.1.0 = 224.0.1.53 ciscoIpMRouteHeartBeat.2.0 = 0.0.0.0 ciscoIpMRouteHeartBeat.3.0 = 10 ciscoIpMRouteHeartBeat.4.0 = 5 ciscoIpMRouteHeartBeat.5.0 = 0 ciscoIpMRouteHeartBeat.6.0 = 3debug ip mobile
Syntax Description
advertise
(Optional) Advertisement information.
host
(Optional) The mobile node host.
access-list-number
(Optional) The number of an IP access list.
local-area
(Optional) The local area.
redundancy
(Optional) Redundancy activities.
udp-tunneling
(Optional) User Datagram Protocol (UDP) tunneling activities.
Command History
Release
Modification
12.0(1)T
This command was introduced.
12.0(2)T
The standby keyword was added.
12.2(8)T
The standby keyword was replaced by the redundancy keyword.
12.2(13)T
This command was enhanced to display information about foreign agent reverse tunnels and the mobile networks attached to the mobile router.
12.3(8)T
The udp-tunneling keyword was added and the command was enhanced to display information about NAT traversal using UDP tunneling.
12.3(7)XJ
This command was enhanced to include the Resource Management capability.
12.2(33)SRA
This command was integrated into Cisco IOS Release 12.2(33)SRA.
12.2SX
This command is supported in the Cisco IOS Release 12.2SX train. Support in a specific 12.2SX release of this train depends on your feature set, platform, and platform hardware.
Usage Guidelines
Use the debug ip mobile redundancy command to troubleshoot redundancy problems.
No per-user debugging output is shown for mobile nodes using the network access identifier (NAI) for the debug ip mobile hostcommand. Debugging of specific mobile nodes using an IP address is possible through the access list.
Examples
The following is sample output from the debug ip mobilecommand when foreign agent reverse tunneling is enabled:
MobileIP:MN 14.0.0.30 deleted from ReverseTunnelTable of Ethernet2/1(Entries 0)The following is sample output from the debug ip mobile advertisecommand:
Router# debug ip mobile advertise
MobileIP: Agent advertisement sent out Ethernet1/2: type=16, len=10, seq=1, lifetime=36000,
flags=0x1400(rbhFmGv-rsv-),
Care-of address: 68.0.0.31
Prefix Length ext: len=1 (8 )
FA Challenge value:769C808D
The table below describes the significant fields shown in the display.
Table 9 debug ip mobile advertise Field Descriptions Field
Description
type
Type of advertisement.
len
Length of extension (in bytes).
seq
Sequence number of this advertisement.
lifetime
Lifetime (in seconds).
flags
Capital letters represent bits that are set; lowercase letters represent unset bits.
Care-of address
IP address.
Prefix Length ext
Number of prefix lengths advertised. This is the bits in the mask of the interface sending this advertisement. Used for roaming detection.
FA Challenge value
Foreign Agent challenge value (randomly generated by the foreign agent.)
The following is sample output from the debug ip mobile hostcommand:
Router# debug ip mobile host
MobileIP: HA received registration for MN 20.0.0.6 on interface Ethernet1 using COA
68.0.0.31 HA 66.0.0.5 lifetime 30000 options sbdmgvT
MobileIP: Authenticated FA 68.0.0.31 using SPI 110 (MN 20.0.0.6)
MobileIP: Authenticated MN 20.0.0.6 using SPI 300
MobileIP: HA accepts registration from MN 20.0.0.6
MobileIP: Mobility binding for MN 20.0.0.6 updated
MobileIP: Roam timer started for MN 20.0.0.6, lifetime 30000
MobileIP: MH auth ext added (SPI 300) in reply to MN 20.0.0.6
MobileIP: HF auth ext added (SPI 220) in reply to MN 20.0.0.6
MobileIP: HA sent reply to MN 20.0.0.6
The following is sample output from the debug ip mobile redundancycommand. In this example, the active home agent receives a registration request from mobile node 20.0.0.2 and sends a binding update to peer home agent 1.0.0.2:
MobileIP:MN 20.0.0.2 - sent BindUpd to HA 1.0.0.2 HAA 20.0.0.1
MobileIP:HA standby maint started - cnt 1
MobileIP:MN 20.0.0.2 - sent BindUpd id 3780410816 cnt 0 elapsed 0
adjust -0 to HA 1.0.0.2 in grp 1.0.0.10 HAA 20.0.0.1
In this example, the standby home agent receives a binding update for mobile node 20.0.0.2 sent by the active home agent:
MobileIP:MN 20.0.0.2 - HA rcv BindUpd from 1.0.0.3 HAA 20.0.0.1The following is sample output from the debug ip mobile udp-tunneling command and displays the registration, authentication, and establishment of UDP tunneling of a mobile node (MN) with a foreign agent (FA):
Dec 31 12:34:25.707: UDP: rcvd src=10.10.10.10(434),dst=10.30.30.1(434), length=54
Dec 31 12:34:25.707: MobileIP: ParseRegExt type MHAE(32) addr 2000FEEC end 2000FF02
Dec 31 12:34:25.707: MobileIP: ParseRegExt skipping 10 to next
Dec 31 12:34:25.707: MobileIP: FA rcv registration for MN 10.10.10.10 on Ethernet2/2 using  COA 10.30.30.1 HA 10.10.10.100 lifetime 65535 options sbdmg-T-identification  C1BC0D4FB01AC0D8
Dec 31 12:34:25.707: MobileIP: Ethernet2/2 glean 10.10.10.10 accepted
Dec 31 12:34:25.707: MobileIP: Registration request byte count = 74
Dec 31 12:34:25.707: MobileIP: FA queued MN 10.10.10.10 in register table
Dec 31 12:34:25.707: MobileIP: Visitor registration timer started for MN 10.10.10.10,  lifetime 120
Dec 31 12:34:25.707: MobileIP:  Adding UDP Tunnel req extension
Dec 31 12:34:25.707: MobileIP: Authentication algorithm MD5 and 16 byte key
Dec 31 12:34:25.707: MobileIP: MN 10.10.10.10 FHAE added to HA 10.10.10.100 using SPI 1000
Dec 31 12:34:25.707: MobileIP: FA forwarded registration for MN 10.10.10.10 to HA  10.10.10.100
Dec 31 12:34:25.715: UDP: rcvd src=10.10.10.100(434), dst=10.30.30.1(434), length=94
Dec 31 12:34:25.715: MobileIP: ParseRegExt type NVSE(134) addr 20010B28 end 20010B6A
Dec 31 12:34:25.715: MobileIP: ParseRegExt type MN-config NVSE(14) subtype 1 (MN prefix  length) prefix length (24)
Dec 31 12:34:25.715: MobileIP: ParseRegExt skipping 12 to next
Dec 31 12:34:25.715: MobileIP: ParseRegExt type MHAE(32) addr 20010B36 end 20010B6A
Dec 31 12:34:25.715: MobileIP: ParseRegExt skipping 10 to next
Dec 31 12:34:25.715: MobileIP: ParseRegExt type UDPTUNREPE(44) addr 20010B4C end 20010B6A
Dec 31 12:34:25.715: Parsing UDP Tunnel Reply Extension - length 6
Dec 31 12:34:25.715: MobileIP: ParseRegExt skipping 6 to next
Dec 31 12:34:25.715: MobileIP: ParseRegExt type FHAE(34) addr 20010B54 end 20010B6A
Dec 31 12:34:25.715: MobileIP: ParseRegExt skipping 20 to next
Dec 31 12:34:25.715: MobileIP: FA rcv accept (0) reply for MN 10.10.10.10 on Ethernet2/3  using HA 10.10.10.100 lifetime 65535
Dec 31 12:34:25.719: MobileIP: Authenticating HA 10.10.10.100 using SPI 1000
Dec 31 12:34:25.719: MobileIP: Authentication algorithm MD5 and 16 byte key
Dec 31 12:34:25.719: MobileIP: Authenticated HA 10.10.10.100 using SPI 1000 and 16 byte  key
Dec 31 12:34:25.719: MobileIP: HA accepts UDP Tunneling
Dec 31 12:34:25.719: MobileIP: Update visitor table for MN 10.10.10.10
Dec 31 12:34:25.719: MobileIP: Enabling UDP Tunneling
Dec 31 12:34:25.719: MobileIP: Tunnel0 (MIPUDP/IP) created with src 10.30.30.1 dst  10.10.10.100
Dec 31 12:34:25.719: MobileIP: Setting up UDP Keep-Alive Timer for tunnel 10.30.30.1:0 -  10.10.10.100:0 with keep-alive 30
Dec 31 12:34:25.719: MobileIP: Starting the tunnel keep-alive timer
Dec 31 12:34:25.719: MobileIP: ARP entry for MN 10.10.10.10 using 10.10.10.10 inserted on  Ethernet2/2
Dec 31 12:34:25.719: MobileIP: FA route add 10.10.10.10 successful. Code = 0
Dec 31 12:34:25.719: MobileIP: MN 10.10.10.10 added to ReverseTunnelTable of Ethernet2/2  (Entries 1)
Dec 31 12:34:25.719: MobileIP: FA dequeued MN 10.10.10.10 from register table
Dec 31 12:34:25.719: MobileIP: MN 10.10.10.10 using 10.10.10.10 visiting on Ethernet2/2 Dec 31 12:34:25.719: MobileIP: Reply in for MN 10.10.10.10 using 10.10.10.10, accepted
Dec 31 12:34:25.719: MobileIP: registration reply byte count = 84
Dec 31 12:34:25.719: MobileIP: FA forwarding reply to MN 10.10.10.10 (10.10.10.10 mac  0060.70ca.f021)
Dec 31 12:34:26.095: MobileIP: agent advertisement byte count = 48
Dec 31 12:34:26.095: MobileIP: Agent advertisement sent out Ethernet2/2: type=16, len=10,  seq=55, lifetime=65535, flags=0x1580(rbhFmG-TU),
Dec 31 12:34:26.095: Care-of address: 10.30.30.1
Dec 31 12:34:26.719: MobileIP: swif coming up Tunnel0
!
Dec 31 12:34:35.719: UDP: sent src=10.30.30.1(434), dst=10.10.10.100(434)
Dec 31 12:34:35.719: UDP: rcvd src=10.10.10.100(434), dst=10.30.30.1(434), length=32d0
The following is sample output from the debug ip mobile udp-tunneling command and displays the registration, authentication, and establishment of UDP tunneling of a MN with a home agent (HA):
Dec 31 12:34:26.167: MobileIP: ParseRegExt skipping 20 to next
Dec 31 12:34:26.167: MobileIP: ParseRegExt type UDPTUNREQE(144) addr 2001E762 end 2001E780
Dec 31 12:34:26.167: MobileIP: Parsing UDP Tunnel Request Extension - length 6
Dec 31 12:34:26.167: MobileIP: ParseRegExt skipping 6 to next
Dec 31 12:34:26.167: MobileIP: ParseRegExt type FHAE(34) addr 2001E76A end 2001E780
Dec 31 12:34:26.167: MobileIP: ParseRegExt skipping 20 to next
Dec 31 12:34:26.167: MobileIP: HA 167 rcv registration for MN 10.10.10.10 on Ethernet2/1  using HomeAddr 10.10.10.10 COA 10.30.30.1 HA 10.10.10.100 lifetime 65535 options  sbdmg-T-identification C1BC0D4FB01AC0D8
Dec 31 12:34:26.167: MobileIP: NAT detected SRC:10.10.10.50 COA: 10.30.30.1
Dec 31 12:34:26.167: MobileIP: UDP Tunnel Request accepted 10.10.10.50:434
Dec 31 12:34:26.167: MobileIP: Authenticating FA 10.30.30.1 using SPI 1000
Dec 31 12:34:26.167: MobileIP: Authentication algorithm MD5 and 16 byte key
Dec 31 12:34:26.167: MobileIP: Authentication algorithm MD5 and truncated key
Dec 31 12:34:26.167: MobileIP: Authentication algorithm MD5 and 16 byte key
Dec 31 12:34:26.167: MobileIP: Authenticated FA 10.30.30.1 using SPI 1000 and 16 byte key
Dec 31 12:34:26.167: MobileIP: Authenticating MN 10.10.10.10 using SPI 1000
Dec 31 12:34:26.167: MobileIP: Authentication algorithm MD5 and 16 byte key
Dec 31 12:34:26.167: MobileIP: Authentication algorithm MD5 and truncated key
Dec 31 12:34:26.167: MobileIP: Authentication algorithm MD5 and 16 byte key
Dec 31 12:34:26.167: MobileIP: Authenticated MN 10.10.10.10 using SPI 1000 and 16 byte key
Dec 31 12:34:26.167: MobileIP: Mobility binding for MN 10.10.10.10 created
Dec 31 12:34:26.167: MobileIP: NAT detected for MN 10.10.10.10. Terminating tunnel on  10.10.10.50
Dec 31 12:34:26.167: MobileIP: Tunnel0 (MIPUDP/IP) created with src 10.10.10.100 dst  10.10.10.50
Dec 31 12:34:26.167: MobileIP: Setting up UDP Keep-Alive Timer for tunnel 10.10.10.100:0 -  10.10.10.50:0 with keep-alive 30
Dec 31 12:34:26.167: MobileIP: Starting the tunnel keep-alive timer
Dec 31 12:34:26.167: MobileIP: MN 10.10.10.10 Insert route for 10.10.10.10/255.255.255.255  via gateway 10.10.10.50 on Tunnel0
Dec 31 12:34:26.167: MobileIP: MN 10.10.10.10 is now roaming
Dec 31 12:34:26.171: MobileIP: Gratuitous ARPs sent for MN 10.10.10.10 MAC 0002.fca5.bc39
Dec 31 12:34:26.171: MobileIP: Mask for address is 24
Dec 31 12:34:26.171: MobileIP: HA accepts registration from MN 10.10.10.10
Dec 31 12:34:26.171: MobileIP: Dynamic and Static Network Extension Length 0 - 0
Dec 31 12:34:26.171: MobileIP: Composed mobile network extension length:0
Dec 31 12:34:26.171: MobileIP: Added prefix length vse in reply
Dec 31 12:34:26.171: MobileIP: Authentication algorithm MD5 and 16 byte key
Dec 31 12:34:26.171: MobileIP: MN 10.10.10.10 MHAE added to MN 10.10.10.10 using SPI 1000
Dec 31 12:34:26.171: MobileIP: Authentication algorithm MD5 and 16 byte key
Dec 31 12:34:26.171: MobileIP: MN 10.10.10.10 FHAE added to FA 10.10.10.50 using SPI 1000
Dec 31 12:34:26.171: MobileIP: MN 10.10.10.10 - HA sent reply to 10.10.10.50
Dec 31 12:34:26.171: MobileIP: Authentication algorithm MD5 and 16 byte key
Dec 31 12:34:26.171: MobileIP: MN 10.10.10.10 HHAE added to HA 10.10.10.3 using SPI 1000
Dec 31 12:34:26.175: MobileIP: ParseRegExt type CVSE(38) addr 2000128C end 200012AE
Dec 31 12:34:26.175: MobileIP: ParseRegExt type HA red. version CVSE(6)
Dec 31 12:34:26.175: MobileIP: ParseRegExt skipping 8 to next
Dec 31 12:34:26.175: MobileIP: ParseRegExt type HHAE(35) addr 20001298 end 200012AE
Dec 31 12:34:26.175: MobileIP: ParseRegExt skipping 20 to next
Dec 31 12:34:26.175: MobileIP: Authenticating HA 10.10.10.3 using SPI 1000
Dec 31 12:34:26.175: MobileIP: Authentication algorithm MD5 and 16 byte key
Dec 31 12:34:26.175: MobileIP: Authentication algorithm MD5 and truncated key
Dec 31 12:34:26.175: MobileIP: Authentication algorithm MD5 and 16 byte key
Dec 31 12:34:26.175: MobileIP: Authenticated HA 10.10.10.3 using SPI 1000 and 16 byte key
Dec 31 12:34:27.167: MobileIP: swif coming up Tunnel0d0
debug ip mobile advertise
The debug ip mobile advertise command was consolidated with the debug ip mobile command. See the description of the debug ip mobile command in the “Debug Commands” chapter for more information.
To display advertisement information, use the debug ip mobile advertise EXEC command .
Examples
The following is sample output from the debug ip mobile advertisecommand. The table below describes significant fields shown in the display.
Router# debug ip mobile advertise
MobileIP: Agent advertisement sent out Ethernet1/2: type=16, len=10, seq=1,
lifetime=36000,
flags=0x1400(rbhFmGv-rsv-),
Care-of address: 14.0.0.31
Prefix Length ext: len=1 (8 )
Table 10 Debug IP Mobile Advertise Field Descriptions Field
Description
type
Type of advertisement.
len
Length of extension in bytes.
seq
Sequence number of this advertisement.
lifetime
Lifetime in seconds.
flags
Capital letters represent bits that are set, lower case letters represent unset bits.
Care-of address
IP address.
Prefix Length ext
Number of prefix lengths advertised. This is the bits in the mask of the interface sending this advertisement. Used for roaming detection.
debug ip mobile dyn-pbr
To display debugging messages for the mobile IP (MIP) dynamic policy based routing (PBR) mobile router, use the debug ip mobile dyn-pbr command in privileged EXEC mode. To disable debugging output, use the no form of this command.
Examples
The following sample output from the debug ip mobile dyn-pbrcommand:
Router# debug ip mobile dyn-pbr
*Jan 12 19:50:16.271: %LINEPROTO-5-UPDOWN: Line protocol on Interface Tunnel2, changed state to up *Jan 12 19:50:16.271:        Looking for path WIFI in rmap MPATH_2 10 *Jan 12 19:50:16.271:        Found link_type WIFI, ACL template is VIDEO *Jan 12 19:50:16.271:        Set int for link_type WIFI to Tunnel2 *Jan 12 19:50:16.271:        MIP-PBR: ACL handle VIDEO-to-192.0.2.0/24 created *Jan 12 19:50:16.271:        MIP-PBR: Retrieving ACL for
VIDEO-to-192.0.2.0/24
*Jan 12 19:50:16.271:        template->tos_value = 16 *Jan 12 19:50:16.271:        Creating new rmap entry_hdl 104835472 *Jan 12 19:50:16.271:        new dyn rmap info added to map_entry->dyn_rmaps
*Jan 12 19:50:16.271:          map_entry->dyn_rmaps =
*Jan 12 19:50:16.271:               104835472, VIDEO-to-192.0.2.0/24
*Jan 12 19:50:16.271:        MIP-PBR: added route-map entry for
VIDEO-to-192.0.2.0/24 via Tunnel2
*Jan 12 19:50:16.271:        MIP-PBR: Dyn route-map entry added OK on HA *Jan 12 19:50:16.271:        MIP-PBR: ACL handle VIDEO-to-192.0.2.32/20 created *Jan 12 19:50:16.271:        MIP-PBR: Retrieving ACL for
VIDEO-to-192.0.2.32/20
*Jan 12 19:50:16.271:        template->tos_value = 16 *Jan 12 19:50:16.271:        Creating new rmap entry_hdl 84396264 *Jan 12 19:50:16.271:        new dyn rmap info added to map_entry->dyn_rmaps
*Jan 12 19:50:16.271:          map_entry->dyn_rmaps =
*Jan 12 19:50:16.271:               104835472, VIDEO-to-192.0.2.0/24
*Jan 12 19:50:16.271:               84396264, VIDEO-to-192.0.2.32/20
*Jan 12 19:50:16.271:        MIP-PBR: added route-map entry for
VIDEO-to-192.0.2.32/20 via Tunnel2
*Jan 12 19:50:16.271:        MIP-PBR: Dyn route-map entry added for home address 192.0.2.32 on HA *Jan 12 19:50:16.271:        Looking for path WIFI in rmap MPATH_2 20 *Jan 12 19:50:16.271:        Looking for path WIFI in rmap MPATH_2 30 *Jan 12 19:50:16.271:        MIP-PBR: MIP-01/12/09-19:46:39.495-1-MP-HA assoc with Ethernet2/0 *Jan 12 19:50:16.271:        *Jan 12 19:50:16.271:        *Jan 12 19:50:16.271:        Looking for path WIFI in rmap MPATH_1 10 *Jan 12 19:50:16.271:        Found link_type WIFI, ACL template is VIDEO *Jan 12 19:50:16.271:        Set int for link_type WIFI to Tunnel2 *Jan 12 19:50:16.271:        MIP-PBR: Using existing dyn acl hdl
VIDEO-to-192.0.2.0/24
*Jan 12 19:50:16.271:        MIP-PBR:   After api bind, ACL
VIDEO-to-192.0.2.0/24, user_count 3
*Jan 12 19:50:16.271:        MIP-PBR:   current map_entry->dyn_rmaps = 0
*Jan 12 19:50:16.271:        MIP-PBR:   found rmap_info =
VIDEO-to-192.0.2.0/24
*Jan 12 19:50:16.271:        MIP-PBR: Using existing dyn rmap entry
104835472
*Jan 12 19:50:16.271:        MIP-PBR: added route-map entry for
VIDEO-to-192.0.2.0/24 via Tunnel2
*Jan 12 19:50:16.271:        MIP-PBR: Dyn route-map entry added OK on HA *Jan 12 19:50:16.271:        MIP-PBR: Using existing dyn acl hdl
VIDEO-to-192.0.2.32/20
*Jan 12 19:50:16.271:        MIP-PBR:   After api bind, ACL
VIDEO-to-192.0.2.32/20, user_count 3
*Jan 12 19:50:16.271:        MIP-PBR:   current map_entry->dyn_rmaps =
63A5320
*Jan 12 19:50:16.271:        MIP-PBR:   found rmap_info =
VIDEO-to-192.0.2.32/20
*Jan 12 19:50:16.271:        MIP-PBR: Using existing dyn rmap entry
84396264
*Jan 12 19:50:16.271:        MIP-PBR: added route-map entry for
VIDEO-to-192.0.2.32/20 via Tunnel2
*Jan 12 19:50:16.271:        MIP-PBR: Dyn route-map entry added for home address 192.0.2.32 on HA *Jan 12 19:50:16.271:        Looking for path WIFI in rmap MPATH_1 20 *Jan 12 19:50:16.271:        Looking for path WIFI in rmap MPATH_1 30 *Jan 12 19:50:16.271:        MIP-PBR: MIP-01/12/09-19:46:39.495-1-MP-HA assoc with Ethernet2/0 *Jan 12 19:50:16.271:        *Jan 12 19:50:16.271:        *Jan 12 19:50:16.271: %LINEPROTO-5-UPDOWN: Line protocol on Interface Tunnel3, changed state to up *Jan 12 19:50:16.271: %LINEPROTO-5-UPDOWN: Line protocol on Interface Tunnel4, changed state to up *Jan 12 19:50:16.271:        Looking for path UMTS in rmap MPATH_2 10 *Jan 12 19:50:16.271:        Looking for path UMTS in rmap MPATH_2 20 *Jan 12 19:50:16.271:        Found link_type UMTS, ACL template is VOICE *Jan 12 19:50:16.271:        Set int for link_type UMTS to Tunnel4 *Jan 12 19:50:16.271:        MIP-PBR: ACL handle VOICE-to-192.0.2.0/24 created *Jan 12 19:50:16.271:        MIP-PBR: Using existing dyn acl hdl
VOICE-to-192.0.2.0/24
*Jan 12 19:50:16.271:        MIP-PBR:   After api bind, ACL
VOICE-to-192.0.2.0/24, user_count 3
*Jan 12 19:50:16.271:        MIP-PBR:   current map_entry->dyn_rmaps = 0
*Jan 12 19:50:16.271:        MIP-PBR:   found rmap_info =
VOICE-to-192.0.2.0/24
*Jan 12 19:50:16.271:        MIP-PBR: Using existing dyn rmap entry 84365440 *Jan 12 19:50:16.271:        MIP-PBR: added route-map entry for
VOICE-to-192.0.2.0/24 via Tunnel4
*Jan 12 19:50:16.271:        MIP-PBR: Dyn route-map entry added OK on HA *Jan 12 19:50:16.271:        MIP-PBR: Using existing dyn acl hdl
VOICE-to-192.0.2.32/20
*Jan 12 19:50:16.271:        MIP-PBR:   After api bind, ACL
VOICE-to-192.0.2.32/20, user_count 3
*Jan 12 19:50:16.271:        MIP-PBR:   current map_entry->dyn_rmaps =
63A4390
*Jan 12 19:50:16.271:        MIP-PBR:   found rmap_info =
VOICE-to-192.0.2.32/20
*Jan 12 19:50:16.271:        MIP-PBR: Using existing dyn rmap entry
99337152
*Jan 12 19:50:16.271:        MIP-PBR: added route-map entry for
VOICE-to-192.0.2.32/20 via Tunnel4
*Jan 12 19:50:16.271:        MIP-PBR: Dyn route-map entry added for home address 192.0.2.32 on HA *Jan 12 19:50:16.271:        Looking for path UMTS in rmap MPATH_1 30 *Jan 12 19:50:16.271:        MIP-PBR: MIP-01/12/09-19:46:39.495-1-MP-HA assoc with Ethernet2/0 *Jan 12 19:50:16.271:        *Jan 12 19:50:16.271:
*Jan 12 19:50:16.291:            DELETING dyn_rmaps for reg_ptr 6436320:
*Jan 12 19:50:16.291:            Looking at reg_info: Tunnel2 MPATH_1 10
*Jan 12 19:50:16.291:            Looking at reg_info: Tunnel2 MPATH_2 10
*Jan 12 19:50:16.291:            Looking at reg_info: Tunnel2 MPATH_1 10
*Jan 12 19:50:16.291:            Looking at reg_info: Tunnel2 MPATH_2 10
*Jan 12 19:50:16.291:            Looking at reg_info: Tunnel4 MPATH_1 20
*Jan 12 19:50:16.291:            Looking at reg_info: Tunnel4 MPATH_2 20
*Jan 12 19:50:16.291:            Looking at reg_info: Tunnel4 MPATH_1 20
*Jan 12 19:50:16.291:            Looking at reg_info: Tunnel4 MPATH_2 20
*Jan 12 19:50:16.291:            Looking at reg_info: Tunnel2 MPATH_1 10
*Jan 12 19:50:16.291:            Looking at reg_info: Tunnel2 MPATH_2 10
*Jan 12 19:50:16.291:            Looking at reg_info: Tunnel2 MPATH_1 10
*Jan 12 19:50:16.291:            Looking at reg_info: Tunnel2 MPATH_2 10
debug ip mobile host
The debug ip mobile host command was consolidated with the debug ip mobilecommand. See the description of the debug ip mobile command in the “Debug Commands” chapter for more information.
Use the debug ip mobile host EXEC command to display IP mobility events.
debug ip mobile host [access-list-number] | [ nai { NAI username | username@realm } ]
no debug ip mobile host [access-list-number] | [ nai { NAI username | username@realm } ]
Examples
The following is sample output from the debug ip mobile host command:
Router# debug ip mobile host
MobileIP: HA received registration for MN 10.0.0.6 on interface Ethernet1 using COA
14.0.0.31 HA 15.0.0.5 lifetime 30000 options sbdmgvT
MobileIP: Authenticated FA 15.0.0.31 using SPI 110 (MN 20.0.0.6)
MobileIP: Authenticated MN 11.0.0.6 using SPI 300

MobileIP: HA accepts registration from MN 11.0.0.6
MobileIP: Mobility binding for MN 11.0.0.6 updated
MobileIP: Roam timer started for MN 11.0.0.6, lifetime 30000
MobileIP: MH auth ext added (SPI 300) in reply to MN 11.0.0.6
MobileIP: HF auth ext added (SPI 220) in reply to MN 11.0.0.6

MobileIP: HA sent reply to MN 11.0.0.6
debug ip mobile mib
To display deb ugging messages for mobile networks, use the debug ip mobile mibcommand in privileged EXEC mode. To disable, use the no form of this command.
Usage Guidelines
This command is useful for customers deploying mobile networks functionality that need to monitor and debug mobile router information via the Simple Network Management Protocol (SNMP).
Set operations (performed from a Network Management System) are supported for mobile network services. While setting the values for MIBs, a set operation may fail. The debug ip mobile mib command allows error messages explaining the failure to be displayed on the console of the home agent .
Examples
The following mobile networks deployment MIB debug messages are displayed only on certain conditions or when a certain condition fails.
Router# debug ip mobile mib
! Mobile router is not enabled
MIPMIB: Mobile Router is not enabled
! Care-of-interface can be set as transmit-only only if its a Serial interface
MIPMIB: Serial interfaces can only be set as transmit-only
! The Care of address can be configured only if foreign agent is running
MIPMIB: FA cannot be started
! Check if home agent is active
MIPMIB: HA is not enabled
! For mobile router configuration, host configuration must have been done already
MIPMIB: MN <address> is not configured
! Mobile Network does not match the existing mobile network
MIPMIB: Conflict with existing mobile networks <name>
! Mobile router present
MIPMIB: MR <address> is not configured

! Static mobile networks can be configured only for single member mobilenetgroups
MIPMIB: MR is part of group <name>, network cannot be configured
! If a binding exists for this mobile router, then delete the route for this unconfigured ! mobile network
MIBMIB: Delete static mobile net for MR
! Check if its a dynamically registered mobile network
nMIPMIB: Mobile network <address mask> is dynamically registered, cannot be removed
! Check if the mobile network has already been configured for another group
nMIPMIB: Mobile network already configured for MR
! Check if the network has been dynamically registered
nMIPMIB: Deleted dynamic mobnet <address mask> for MR <name>
! Check if the redundancy group exists
MIPMIB: Redundancy group <name> does not exist
! CCOA configuration, use primary interface address as the CCoA
MIPMIB: No IP address on this interface
! CCOA configuration, CCoA address shouldn't be the same as the Home Address
nMIPMIB: Collocated CoA is the same as the Home Address, registrations will fail
debug ip mobile redundancy
The debug ip mobile redundancy command was consolidated with the debug ip mobile command. See the description of the debug ip mobile command in the “Debug Commands” chapter for more information.
Use the debug ip mobile redundancy EXEC command to display IP mobility events.
Examples
The following is sample output from the debug ip mobile redundancy command:
Router# debug ip mobile redundancy
00:19:21: MobileIP: Adding MN service flags to bindupdate
00:19:21: MobileIP:  Adding MN service flags 0 init registration flags 1
00:19:21: MobileIP: Adding a hared version cvse - bindupdate
00:19:21: MobileIP: HARelayBindUpdate version number 2MobileIP: MN 14.0.0.20 - sent BindUpd to HA 11.0.0.3 HAA 11.0.0.4
00:19:21: MobileIP: HA standby maint started - cnt 1
00:19:21: MobileIP: MN 14.0.0.20 - HA rcv BindUpdAck accept from 11.0.0.3 HAA 11.0.0.4
00:19:22: MobileIP: HA standby maint started - cnt 1
debug ip mobile router
To display debugging messages for the mobile router, use the debug ip mobile routercommand in privileged EXEC mode. To disable debugging output, use the no form of this command.
Usage Guidelines
The mobile router operations can be debugged. The following conditions trigger debugging messages:
- Agent discovery
- Registration
- Mobile router state change
- Routes and tunnels created or deleted
- Roaming information
Debugging messages are prefixed with “MobRtr” and detail messages are prefixed with “MobRtrX”.
Examples
The following is sample output from the debug ip mobile router command:
Router# debug ip mobile router
MobileRouter: New FA 27.0.0.12 coa 27.0.0.12 int Ethernet0/1 MAC 0050.50c1.c855
2w2d: MobileRouter: Register reason: isolated
2w2d: MobileRouter: Snd reg request agent 27.0.0.12 coa 27.0.0.12 home 9.0.0.1 ha 29.0.0.4 lifetime 36000 int Ethernet0/1 flag sbdmgvt cnt 0 id B496B69C.55E77974
2w2d: MobileRouter: Status Isolated -> Pending
The following is sample output from the debug ip mobile router detail command:
Router# debug ip mobile router detail 1d09h: MobRtr: New agent 20.0.0.2 coa 30.0.0.2 int Ethernet3/1 MAC 00b0.8e35.a055 1d09h: MobRtr: Register reason: left home 1d09h: MobRtrX: Extsize 18 add 1 delete 0 1d09h: MobRtrX: Add network 20.0.0.0/8 MobileIP: MH auth ext added (SPI 100) to HA 100.0.0.3 1d09h: MobRtr: Register to fa 20.0.0.2 coa 30.0.0.2 home 100.0.0.1 ha 100.0.0.3 life 120 int Ethernet3/1 flag sbdmgvt cnt 0 id BE804340.447F50A4 1d09h: MobRtr: Status Isolated -> Pending 1d09h: MobRtr: MN rcv accept (0) reply on Ethernet3/1 from 20.0.0.2 lifetime 120 MobileIP: MN 100.0.0.3 - authenticating HA 100.0.0.3 using SPI 100 MobileIP: MN 100.0.0.3 - authenticated HA 100.0.0.3 using SPI 100 1d09h: MobRtr: Status Pending -> Registered 1d09h: MobRtr: Add default gateway 20.0.0.2 (Ethernet3/1) 1d09h: MobRtr: Add default route via 20.0.0.2 (Ethernet3/1)debug ip mpacket
NoteEffective with Cisco IOS Release 15.0(1)M and Cisco IOS Release 12.2(33)SRE, the debug ip mpacketcommand is replaced by the debug ip mfib pscommand and the debug ip mcachecommand with the fastswitch keyword is replaced by the debug ip mfib pak command. See the debug ip mfib psand debug ip mfib pak commands for more information.
To display IP multicast packets received and sent, use the debug ip mpacket command in privileged EXEC mode. To disable debugging output, use the no form of this command.
debug ip mpacket [ vrf vrf-name ] [ detail | fastswitch ] [access-list] [group]
no debug ip mpacket [ vrf vrf-name ] [ detail | fastswitch ] [access-list] [group]
Syntax Description
vrf
(Optional) Supports the Multicast Virtual Private Network (VPN) routing and forwarding (VRF) instance.
vrf-name
(Optional) Name assigned to the VRF.
detail
(Optional) Displays IP header information and MAC address information.
fastswitch
(Optional) Displays IP packet information in the fast path.
access-list
(Optional) The access list number.
group
(Optional) The group name or address.
Command Default
The debug ip mpacket command displays all IP multicast packets switched at the process level.
Command History
Release
Modification
10.2
This command was introduced.
12.1(2)T
This command was modified. The fastswitch keyword was added.
12.0(23)S
This command was modified. The vrf keyword and vrf-name argument were added.
12.2(13)T
This command was integrated into Cisco IOS Release 12.2(13)T.
12.2(14)S
This command was integrated into Cisco IOS Release 12.2(14)S.
12.2(27)SBC
This command was integrated into Cisco IOS Release 12.2(27)SBC.
12.2(33)SRA
This command was integrated into Cisco IOS Release 12.2(33)SRA.
15.0(1)M
This command was replaced.
12.2(33)SRE
This command was replaced.
Usage Guidelines
This command displays information for multicast IP packets that are forwarded from this router. Use the access-list or group argument to limit the display to multicast packets from sources described by the access list or a specific multicast group.
Use this command with the debug ip packet command to display additional packet information.
NoteThe debug ip mpacket command generates many messages. Use this command with care so that performance on the network is not affected by the debug message traffic.
Examples
The following is sample output from the debug ip mpacket command:
Router# debug ip mpacket 224.2.0.1

IP: s=10.188.34.54 (Ethernet1), d=224.2.0.1 (Tunnel0), len 88, mforward
IP: s=10.188.34.54 (Ethernet1), d=224.2.0.1 (Tunnel0), len 88, mforward
IP: s=10.188.34.54 (Ethernet1), d=224.2.0.1 (Tunnel0), len 88, mforward
IP: s=10.162.3.27 (Ethernet1), d=224.2.0.1 (Tunnel0), len 68, mforward
The table below describes the significant fields shown in the display.
Table 11 debug ip mpacket Field Descriptions Field
Description
IP
IP packet.
s=10.188.34.54
Source address of the packet.
(Ethernet1)
Name of the interface that received the packet.
d=224.2.0.1
Multicast group address that is the destination for this packet.
(Tunnel0)
Outgoing interface for the packet.
len 88
Number of bytes in the packet. This value will vary depending on the application and the media.
mforward
Packet has been forwarded.
Related Commands
Command
Description
debug ip dvmrp
Displays information on DVMRP packets received and sent.
debug ip igmp
Displays IGMP packets received and sent, and IGMP host-related events.
debug ip mrm
Displays MRM control packet activity.
debug ip packet
Displays general IP debugging information and IPSO security transactions.
debug ip sd
Displays all SD announcements received.
debug ip mrib
To enable debugging output for IPv4 Multicast Routing Information Base (MRIB) activity, use the debug ip mribcommand in privileged EXEC mode. To disable debugging output, use the no form of this command.
debug ip mrib [ vrf vrf-name ] { client | io | issu | proxy | route | table | trans }
no debug ip mrib [ vrf vrf-name ] { client | io | issu | proxy | route | table | trans }
Syntax Description
vrf vrf-name
(Optional) Enables debugging output for IPv4 MRIB activity associated with the Multicast Virtual Private Network (MVPN) routing and forwarding (MVRF) instance specified for the vrf-name argument.
client
Enables debugging output for IPv4 MRIB client management activity.
io
Enables debugging output for IPv4 MRIB input/output (I/O) events.
issu
Enables debugging output for IPv4 MRIB events associated with In-Service Software Upgrades (ISSUs).
proxy
Enables debugging output related to IPv4 MRIB proxy activity between the Route Processor (RP) and line cards.
route
Enables debugging output for IPv4 MRIB activity pertaining to routing entries.
table
Enables debugging output for IPv4 MRIB table management activity.
trans
Enables debugging output for activity related to IPv4 Protocol Independent Multicast (PIM) to MRIB translation.
debug ip mrm
To display Multicast Routing Monitor (MRM) control packet activity, use the debug ip mrm command in privileged EXEC mode. To disable debugging output, use the no form of this command.
Examples
*Feb 28 16:25:44.009: MRM: Send Beacon for group 239.1.1.1, holdtime 86100 seconds *Feb 28 16:26:01.095: MRM: Receive Status Report from 10.1.4.2 on Ethernet0 *Feb 28 16:26:01.099: MRM: Send Status Report Ack to 10.1.4.2 for group 239.1.1.1debug ip mrouting
To display information about activity in the multicast route (mroute) table, use the debug ip mrouting command in privileged EXEC mode. To disable debugging output, use the no form of this command.
debug ip mrouting [ vrf vrf-name ] [ rpf-events | timers ] [group-address]
no debug ip mrouting [ vrf vrf-name ] [ rpf-events | timers ] [group-address]
Command Syntax in Cisco IOS 12.2(33)SXH and Subsequent 12.2SX Releases
debug ip mrouting [ vrf vrf-name ] [ high-availability | rpf-events [group-address] | timers group-address ]
no debug ip mrouting [ vrf vrf-name ] [ high-availability | rpf-events [group-address] | timers group-address ]
Syntax Description
vrf vrf-name
(Optional) Displays debugging information related to mroute activity associated with the Multicast Virtual Private Network (MVPN) routing and forwarding (MVRF) instance specified for the vrf-name argument.
high-availability
(Optional) Displays high availability (HA) events associated with supervisor engine switchovers on Catalyst 6500 series switches, in Cisco IOS Release 12.2(33)SXH and subsequent 12.2SX releases.
rpf-events
(Optional) Displays Reverse Path Forwarding (RPF) events associated with mroutes in the mroute table.
timers
(Optional) Displays timer-related events associated with mroutes in the mroute table.
group-address
(Optional) IP address or Domain Name System (DNS) name of a multicast group. Entering a multicast group address restricts the output to only display mroute activity associated with the multicast group address specified for the optional group-address argument.
Command History
Release
Modification
10.2
This command was introduced.
12.0(22)S
The rpf-events keyword was added.
12.2(13)T
The timers keyword, vrf keyword, and vrf-name argument were added.
12.2(14)S
The timers keyword, vrf keyword, and vrf-name argument were added.
12.2(28)SB
This command was integrated into Cisco IOS Release 12.2(28)SB.
12.2(33)SRA
This command was integrated into Cisco IOS Release 12.2(33)SRA.
12.2(33)SXH
This command was integrated into Cisco IOS Release 12.2(33)SXH. The high-availability keyword was added in support of the PIM Triggered Joins feature.
Usage Guidelines
This command indicates when the router has made changes to the mroute table. Use the debug ip pim and debug ip mrouting commands consecutively to obtain additional multicast routing information. In addition, use the debug ip igmp command to learn why an mroute message is being displayed.
This command generates a substantial amount of output. Use the optional group-address argument to limit the output to a single multicast group.
In Cisco IOS 12.2(33)SXH and subsequent 12.2SX releases, the high-availability keyword was added in support of the PIM Triggered Joins feature to monitor HA events in the event of a supervisor engine switchover on a Catalyst 6500 series switch. The PIM Triggered Joins feature is an HA multicast enhancement that improves the reconvergence of mroutes after a supervisor engine switchover on a Catalyst 6500 series switch. After a service engine switchover, all instances of PIM running on the newly active supervisor engine will modify the value of the Generation ID (GenID) that is included in PIM hello messages sent to adjacent PIM neighbors. When an adjacent PIM neighbor receives a PIM hello message on an interface with a new GenID, the PIM neighbor will interpret the modified GenID as an indication that all mroutes states on that interface have been lost. A modified GenID, thus, is utilized as a mechanism to alert all adjacent PIM neighbors that PIM forwarding on that interface has been lost, which then triggers adjacent PIM neighbors to send PIM joins for all (*, G) and (S, G) mroute states that use that interface as an RPF interface.
Examples
The following is sample output from the debug ip mrouting command:
Router# debug ip mrouting 224.2.0.1

MRT: Delete (10.0.0.0/8, 224.2.0.1)
MRT: Delete (10.4.0.0/16, 224.2.0.1)
MRT: Delete (10.6.0.0/16, 224.2.0.1)
MRT: Delete (10.9.0.0/16, 224.2.0.1)
MRT: Delete (10.16.0.0/16, 224.2.0.1)
MRT: Create (*, 224.2.0.1), if_input NULL
MRT: Create (224.69.15.0/24, 225.2.2.4), if_input Ethernet0, RPF nbr 224.69.61.15
MRT: Create (224.69.39.0/24, 225.2.2.4), if_input Ethernet1, RPF nbr 0.0.0.0
MRT: Create (10.0.0.0/8, 224.2.0.1), if_input Ethernet1, RPF nbr 224.0.0.0
MRT: Create (10.4.0.0/16, 224.2.0.1), if_input Ethernet1, RPF nbr 224.0.0.0
MRT: Create (10.6.0.0/16, 224.2.0.1), if_input Ethernet1, RPF nbr 224.0.0.0
MRT: Create (10.9.0.0/16, 224.2.0.1), if_input Ethernet1, RPF nbr 224.0.0.0
MRT: Create (10.16.0.0/16, 224.2.0.1), if_input Ethernet1, RPF nbr 224.0.0.0
The following lines show that multicast IP routes were deleted from the routing table:
MRT: Delete (10.0.0.0/8, 224.2.0.1)
MRT: Delete (10.4.0.0/16, 224.2.0.1)
MRT: Delete (10.6.0.0/16, 224.2.0.1)
The (*, G) entries are generally created by receipt of an Internet Group Management Protocol (IGMP) host report from a group member on the directly connected LAN or by a Protocol Independent Multicast (PIM) join message (in sparse mode) that this router receives from a router that is sending joins toward the Route Processor (RP). This router will in turn send a join toward the RP that creates the shared tree (or RP tree).
MRT: Create (*, 224.2.0.1), if_input NULLThe following lines are an example of creating an (S, G) entry that shows that an IP multicast packet (mpacket) was received on Ethernet interface 0. The second line shows a route being created for a source that is on a directly connected LAN. The RPF means “Reverse Path Forwarding,” whereby the router looks up the source address of the multicast packet in the unicast routing table and determines which interface will be used to send a packet to that source.
MRT: Create (224.69.15.0/24, 225.2.2.4), if_input Ethernet0, RPF nbr 224.69.61.15
MRT: Create (224.69.39.0/24, 225.2.2.4), if_input Ethernet1, RPF nbr 0.0.0.0
The following lines show that multicast IP routes were added to the routing table. Note the 224.0.0.0 as the RPF, which means the route was created by a source that is directly connected to this router.
MRT: Create (10.9.0.0/16, 224.2.0.1), if_input Ethernet1, RPF nbr 224.0.0.0
MRT: Create (10.16.0.0/16, 224.2.0.1), if_input Ethernet1, RPF nbr 224.0.0.0
If the source is not directly connected, the neighbor address shown in these lines will be the address of the router that forwarded the packet to this router.
The shortest path tree state maintained in routers consists of source (S), multicast address (G), outgoing interface (OIF), and incoming interface (IIF). The forwarding information is referred to as the multicast forwarding entry for (S, G).
An entry for a shared tree can match packets from any source for its associated group if the packets come through the proper incoming interface as determined by the RPF lookup. Such an entry is denoted as (*, G). A (*, G) entry keeps the same information a (S, G) entry keeps, except that it saves the rendezvous point address in place of the source address in sparse mode or as 24.0.0.0 in dense mode.
The table below describes the significant fields shown in the display.
Related Commands
Command
Description
debug ip dvmrp
Displays information on DVMRP packets received and sent.
debug ip igmp
Displays IGMP packets received and sent, and IGMP host-related events.
debug ip packet
Displays general IP debugging information and IPSO security transactions.
debug ip pim
Displays all PIM announcements received.
debug ip sd
Displays all SD announcements received.
debug ip mrouting limits
To display debugging information about configured per interface mroute state limiters and bandwidth-based multicast Call Admission Control (CAC) policies, use the debug ip mrouting limitscommand in privileged EXEC mode. To disable debugging output, use the no form of this command.
debug ip mrouting [ vrf vrf-name ] limits [group-address]
no debug ip mrouting [ vrf vrf-name ] limits [group-address]
Syntax Description
vrf vrf-name
(Optional) Logs per interface mroute state limiter and bandwidth-based multicast CAC policy events related to multicast groups associated with the Multicast Virtual Private Network (VPN) routing and forwarding (MVRF) instance specified for the vrf-name argument.
group-address
(Optional) Multicast group address or group name for which to log per interface mroute state limiter and bandwidth-based multicast CAC policy events.
Usage Guidelines
This command may generate a substantial amount of output. Use the optional group-address argument to restrict the output to display only per interface mroute state limiter and bandwidth-based multicast CAC policy events related to a particular multicast group.
Examples
The following output is from the debug ip mrouting limits command. The output displays the following events:
- An mroute state being created and the corresponding per interface mroute state limiter counter being increased by the default cost of 1 on incoming Ethernet interface 1/0.
- An mroute olist member being removed from the olist and the corresponding per interface mroute limiter being decreased by the default cost of 1 on outgoing Ethernet interface 1/0.
- An mroute being denied by the per interface mroute state limiter because the maximum number of mroute states has been reached.
- An mroute state being created and the corresponding per interface mroute state limiter counter being increased by the cost of 2 on incoming Ethernet interface 1/0.
- An mroute olist member being removed from the olist and the corresponding per interface mroute limiter being decreased by a cost of 2 on outgoing Ethernet interface 1/0.
Router# debug ip mrouting limits

MRL(0): incr-ed acl ‘rpf-list’ to (13 < max 32), [n:0,p:0], (main) GigabitEthernet0/0, (10.41.0.41, 225.30.200.60)
MRL(0): decr-ed acl ‘out-list’ to (10 < max 32), [n:0,p:0], (main) GigabitEthernet0/0, (*, 225.40.202.60)
MRL(0): Add mroute (10.43.0.43, 225.30.200.60) denied for GigabitEthernet0/2, acl std-list, (16 = max 16)
MRL(0): incr-ed limit-acl `rpf-list' to (12 < max 32), cost-acl 'cost-list' cost 2, [n:0,p:0], (main) GigabitEthernet0/0, (10.41.0.41, 225.30.200.60)
MRL(0): decr-ed limit-acl `out-list' to (8 < max 32), cost-acl 'cost-list'' cost 2, [n:0,p:0], (main) GigabitEthernet0/0, (*, 225.40.202.60)
Related Commands
Command
Description
clear ip multicast limit
Resets the exceeded counter for per interface mroute state limiters.
ip multicast limit
Configures per interface mroute state limiters.
ip multicast limit cost
Applies costs to per interface mroutes state limiters.
show ip multicast limit
Displays statistics about configured per interface mroute state limiters.
debug ip msdp
To debug Multicast Source Discovery Protocol (MSDP) activity, use the debug ip msdpcommand in privileged EXEC mode. To disable debugging output, use the no form of this command.
debug ip msdp [ vrf vrf-name ] [ peer-address | name ] [detail] [routes]
no debug ip msdp [ vrf vrf-name ] [ peer-address | name ] [detail] [routes]
Syntax Description
vrf
(Optional) Supports the Multicast Virtual Private Network (VPN) routing and forwarding (VRF) instance.
vrf-name
(Optional) Name assigned to the VRF.
peer-address | name
(Optional) The peer for which debug events are logged.
detail
(Optional) Provides more detailed debugging information.
routes
(Optional) Displays the contents of Source-Active messages.
Command History
Release
Modification
12.0(7)T
This command was introduced.
12.0(23)S
The vrf keyword and vrf-name argument were added.
12.2(13)T
This command was integrated into Cisco IOS Release 12.2(13)T.
12.2(14)S
This command was integrated into Cisco IOS Release 12.2(14)S.
12.2(27)SBC
This command was integrated into Cisco IOS Release 12.2(27)SBC.
12.2(33)SRA
This command was integrated into Cisco IOS Release 12.2(33)SRA.
Examples
The following is sample output from the debug ip msdp command:
Router# debug ip msdp
MSDP debugging is on
Router#
MSDP: 224.150.44.254: Received 1388-byte message from peer
MSDP: 224.150.44.254: SA TLV, len: 1388, ec: 115, RP: 172.31.3.92
MSDP: 224.150.44.254: Peer RPF check passed for 172.31.3.92, used EMBGP peer
MSDP: 224.150.44.250: Forward 1388-byte SA to peer
MSDP: 224.150.44.254: Received 1028-byte message from peer
MSDP: 224.150.44.254: SA TLV, len: 1028, ec: 85, RP: 172.31.3.92
MSDP: 224.150.44.254: Peer RPF check passed for 172.31.3.92, used EMBGP peer
MSDP: 224.150.44.250: Forward 1028-byte SA to peer
MSDP: 224.150.44.254: Received 1388-byte message from peer
MSDP: 224.150.44.254: SA TLV, len: 1388, ec: 115, RP: 172.31.3.111
MSDP: 224.150.44.254: Peer RPF check passed for 172.31.3.111, used EMBGP peer
MSDP: 224.150.44.250: Forward 1388-byte SA to peer
MSDP: 224.150.44.250: Received 56-byte message from peer
MSDP: 224.150.44.250: SA TLV, len: 56, ec: 4, RP: 205.167.76.241
MSDP: 224.150.44.250: Peer RPF check passed for 205.167.76.241, used EMBGP peer
MSDP: 224.150.44.254: Forward 56-byte SA to peer
MSDP: 224.150.44.254: Received 116-byte message from peer
MSDP: 224.150.44.254: SA TLV, len: 116, ec: 9, RP: 172.31.3.111
MSDP: 224.150.44.254: Peer RPF check passed for 172.31.3.111, used EMBGP peer
MSDP: 224.150.44.250: Forward 116-byte SA to peer
MSDP: 224.150.44.254: Received 32-byte message from peer
MSDP: 224.150.44.254: SA TLV, len: 32, ec: 2, RP: 172.31.3.78
MSDP: 224.150.44.254: Peer RPF check passed for 172.31.3.78, used EMBGP peer
MSDP: 224.150.44.250: Forward 32-byte SA to peer
The table below describes the significant fields shown in the display.
debug ip msdp resets
To debug Multicast Source Discovery Protocol (MSDP) peer reset reasons, use the debug ip msdp resets command in privileged EXEC mode.
Command History
Release
Modification
12.0(7)T
This command was introduced.
12.0(23)S
The vrf keyword and vrf-name argument were added.
12.2(13)T
This command was integrated into Cisco IOS Release 12.2(13)T.
12.2(14)S
This command was integrated into Cisco IOS Release 12.2(14)S.
12.2(27)SBC
This command was integrated into Cisco IOS Release 12.2(27)SBC.
12.2(33)SRA
This command was integrated into Cisco IOS Release 12.2(33)SRA.
debug ip multicast hardware-switching
To display information about multicast hardware switching, use the debug ip multicast hardware-switchingcommand in privileged EXEC mode. To disable debugging output, use the no form of this command.
debug ip multicast hardware-switching { control group-name | error A .B .C .D | event A .B .C .D | ha-error A .B .C .D | ha-event A .B .C .D }
no debug ip multicast hardware-switching { control group-name | error A .B .C .D | event A .B .C .D | ha-error A .B .C .D | ha-event A .B .C .D }
Syntax Description
control
Displays all multicast hardware switching debugging information, including errors, events, and packets for the specified group.
group-name
Specifies the selected group.
A.B.C.D
Specifies the source or group I.D. address.
error
Displays error messages related to multicast hardware switching.
event
Displays the run-time sequence of events for multicast hardware switching.
ha-error
Displays the run-time sequence of ha-errors for multicast hardware switching.
ha-event
Displays the run-time sequence of ha-events for multicast hardware switching.
Examples
The following example shows output from the debug ip multicast hardware-switchingcommand using the error keyword:
Router# debug ip multicast hardware-switching error 232.0.1.4
PE1-7600#debug ip multicast hardware-switching error 232.0.1.4
CMFIB-RP IPv4  error debugging enabled for group 232.0.1.4
PE1-7600#
The following example shows output from the debug ip multicast hardware-switchingcommand using the event keyword:
Router# debug ip multicast hardware-switching event 232.0.1.4
CMFIB-RP IPv4  event debugging enabled for group 232.0.1.4
Router#
The following example shows output from the debug ip multicast hardware-switching command using the ha-event keyword:
Router# debug ip multicast hardware-switching ha-event 232.0.1.4 CMFIB-RP IPv4 ha event debugging enabled for group 232.0.1.4 PE1-7600# Router# Router# The following example shows output from the debug ip multicast hardware-switching command using the ha-error keyword: Router# debug ip multicast hardware-switching ha-error 232.0.1.4 CMFIB-RP IPv4 ha error debugging enabled for group 232.0.1.4 Router#debug ip multicast redundancy
To display information about IP multicast redundancy events, use the debug ip multicast redundancycommand in privileged EXEC mode. To disable debugging output for IP multicast redundancy events, use the no form of this command.
debug ip multicast [ default-vrf | vrf vrf-name ] [ group group-address ] redundancy [verbose]
no debug ip multicast [ default-vrf | vrf vrf-name ] [ group group-address ] redundancy [verbose]
Syntax Description
default-vrf
(Optional) Restricts the logging of IP multicast events associated with Multicast Virtual Private Network routing and forwarding (MVRF) instances to events associated with the default MVRF.
vrf vrf-name
(Optional) Restricts the logging of IP multicast events associated with MVRFs to events associated with the MVRF specified for the vrf-name argument.
group group-address
(Optional) Restricts the output for multicast groups to events associated with the multicast group specified for the group-addressargument.
verbose
(Optional) Logs events that may occur frequently during normal operation, but that may be useful for tracking in short intervals.
Command Default
IP multicast events related to all multicast groups and all MVRFs are displayed. Logging events enabled with the verbose keyword are not displayed.
Usage Guidelines
Use this command to display IP multicast redundancy events.
This command logs events that are important in verifying nonstop forwarding (NSF) with stateful switchover (SSO) for IP multicast. The classes of events logged by the debug ip multicast redundancy command include stateful switchover events during a Route Processor (RP) switchover and dynamic synchronization events that occur during steady state operation.
Use the optional verbose keyword to log events that may occur frequently during normal operation, but that may be useful for tracking in short intervals.
Examples
The following sample output from the debug ip multicast redundancy command shows the initial logging messages that display when the system detects an RP switchover:
00:10:33: %REDUNDANCY-3-SWITCHOVER: RP switchover (PEER_DOWN_INTERRUPT)
00:10:33: %REDUNDANCY-5-PEER_MONITOR_EVENT: Standby received a switchover (raw-event=PEER_DOWN_INTERRUPT(11))
*Aug  7 02:31:28.051: MCAST-HA: Received cf status CHKPT_STATUS_PEER_NOT_READY
*Aug  7 02:31:28.063: MCAST-HA: Received cf status CHKPT_STATUS_PEER_NOT_READY
*Aug  7 02:31:28.063: MCAST-HA-RF: Status event: status=RF_STATUS_PEER_COMM  Op=0  RFState=STANDBY HOT
*Aug  7 02:31:28.063: MCAST-HA-RF: Status event: status=RF_STATUS_OPER_REDUNDANCY_MODE_CHANGE  Op=0  RFState=STANDBY HOT
*Aug  7 02:31:28.063: MCAST-HA-RF: Status event: status=RF_STATUS_REDUNDANCY_MODE_CHANGE  Op=0  RFState=STANDBY HOT
*Aug  7 02:31:28.063: MCAST-HA-RF: Status event: status=RF_STATUS_PEER_PRESENCE  Op=0  RFState=STANDBY HOT
*Aug  7 02:31:28.063: MCAST-HA-RF: Status event: status=RF_STATUS_MAINTENANCE_ENABLE  Op=0  RFState=ACTIVE-FAST
*Aug  7 02:31:28.063: MCAST-HA-RF: Progression event: RF_Event=RF_PROG_ACTIVE_FAST RFState=ACTIVE-FAST
*Aug  7 02:31:28.091: MCAST-HA-RF: Progression event: RF_Event=RF_PROG_ACTIVE_DRAIN RFState=ACTIVE-DRAIN
*Aug  7 02:31:28.091: MCAST-HA-RF: Progression event: RF_Event=RF_PROG_ACTIVE_PRECONFIG RFState=ACTIVE_PRECONFIG
*Aug  7 02:31:28.091: MCAST-HA-RF: Progression event: RF_Event=RF_PROG_ACTIVE_POSTCONFIG RFState=ACTIVE_POSTCONFIG
*Aug  7 02:31:28.103: MCAST-HA: Received cf status CHKPT_STATUS_IPC_FLOW_ON
*Aug  7 02:31:28.103: MCAST-HA-RF: Progression event: RF_Event=RF_PROG_ACTIVE RFState=ACTIVE
The following is sample output from the debug ip multicast redundancy command. As interfaces come up on the new active RP, unicast convergence occurs in parallel with a multicast route refresh from Protocol Independent Multicast (PIM) neighbors. Unicast convergence is followed by Reverse Path Forwarding (RPF) adjustments to the refreshed mroute information.
*Aug  7 02:31:28.107: MCAST-HA: Triggering unicast convergence notification process handling for MVRF IPv4 default
*Aug  7 02:31:28.107: MCAST-HA: Triggering unicast convergence notification process handling for MVRF blue
*Aug  7 02:31:28.107: MCAST-HA: Triggering unicast convergence notification process handling for MVRF green
*Aug  7 02:31:28.107: MCAST-HA: Triggering unicast convergence notification process handling for MVRF red
*Aug  7 02:31:28.107: MCAST-HA: Triggering unicast convergence notification process handling for all MVRFs
*Aug  7 02:31:28.111: MCAST-HA: Beginning unicast convergence notification process handling.
*Aug  7 02:31:28.111: MCAST-HA: Unicast convergence completed for MVRF IPv4 default:  Triggering RPF updates
*Aug  7 02:31:28.111: MCAST-HA: Beginning unicast convergence notification process handling.
*Aug  7 02:31:28.111: MCAST-HA: Unicast convergence completed for MVRF blue:  Triggering RPF updates
*Aug  7 02:31:28.111: MCAST-HA: Beginning unicast convergence notification process handling.
*Aug  7 02:31:28.111: MCAST-HA: Unicast convergence completed for MVRF green:  Triggering RPF updates
*Aug  7 02:31:28.111: MCAST-HA: Beginning unicast convergence notification process handling.
*Aug  7 02:31:28.111: MCAST-HA: Unicast convergence completed for MVRF red:  Triggering RPF updates
*Aug  7 02:31:28.111: MCAST-HA: Unicast convergence notification has been received for the only unconverged VRF.
Stopping the unicast routing convergence failsafe timer.
*Aug  7 02:31:28.111: MCAST-HA: Beginning unicast convergence notification process handling.
*Aug  7 02:31:28.111: MCAST-HA: Unicast convergence notification received for the wildcard tableid (all VRFs).
Triggering RPF updates for all MVRFs and stopping the unicast IGP convergence failsafe timer.
00:10:34: %PIM-5-DRCHG: DR change from neighbor 0.0.0.0 to 172.16.1.1 on interface Loopback0
00:10:34: %PIM-5-DRCHG: DR change from neighbor 0.0.0.0 to 172.31.10.1 on interface Loopback1
00:10:35: %PIM-5-DRCHG: VRF green: DR change from neighbor 0.0.0.0 to 172.16.1.1 on interface Tunnel1
00:10:35: %PIM-5-DRCHG: VRF red: DR change from neighbor 0.0.0.0 to 172.16.1.1 on interface Tunnel2
00:10:35: %LINK-3-UPDOWN: Interface Null0, changed state to up
00:10:35: %LINK-3-UPDOWN: Interface Loopback0, changed state to up
00:10:35: %LINK-3-UPDOWN: Interface Loopback1, changed state to up
00:10:35: %LINK-3-UPDOWN: Interface Tunnel0, changed state to up
00:10:35: %LINK-3-UPDOWN: Interface Tunnel1, changed state to up
00:10:35: %LINK-3-UPDOWN: Interface Tunnel2, changed state to up
00:10:35: %LINK-5-CHANGED: Interface Ethernet0/0, changed state to administratively down
00:10:35: %LINK-5-CHANGED: Interface Ethernet0/1, changed state to administratively down
00:10:35: %LINK-5-CHANGED: Interface Ethernet0/2, changed state to administratively down
00:10:35: %LINK-5-CHANGED: Interface Ethernet0/3, changed state to administratively down
00:10:35: %LINK-5-CHANGED: Interface Ethernet1/0, changed state to administratively down
00:10:35: %LINK-5-CHANGED: Interface Ethernet1/1, changed state to administratively down
00:10:35: %LINK-5-CHANGED: Interface Ethernet1/2, changed state to administratively down
00:10:35: %LINK-5-CHANGED: Interface Ethernet1/3, changed state to administratively down
00:10:36: %LINEPROTO-5-UPDOWN: Line protocol on Interface Null0, changed state to up
00:10:36: %LINEPROTO-5-UPDOWN: Line protocol on Interface Loopback0, changed state to up
00:10:36: %LINEPROTO-5-UPDOWN: Line protocol on Interface Loopback1, changed state to up
00:10:36: %LINEPROTO-5-UPDOWN: Line protocol on Interface Tunnel0, changed state to up
00:10:36: %LINEPROTO-5-UPDOWN: Line protocol on Interface Tunnel1, changed state to up
00:10:36: %LINEPROTO-5-UPDOWN: Line protocol on Interface Tunnel2, changed state to up
00:10:38: %PIM-5-DRCHG: VRF blue: DR change from neighbor 0.0.0.0 to 172.16.1.1 on interface Tunnel0
The following is sample output from the debug ip multicast redundancy command. After the processing of unicast and multicast route convergence, time is allowed for Internet Group Management Protocol (IGMP) reporting. Following IGMP reporting, the control plane then sends out requests for the Multicast Forwarding Information Base (MFIB) replay of data driven events (DDEs) to retrigger multicast route information that cannot be obtained from PIM neighbors or directly connected hosts. After this processing completes, the control plane waits for the NSF hold-off time period to terminate. The refreshed multicast control plane information is then downloaded to the forwarding plane; once the download is completed, the stale multicast forwarding plane information is subsequently flushed.
*Aug  7 02:31:43.651: MCAST-HA: IGMP response timer expired. Ready for DDE replay for MVRF red
*Aug  7 02:31:43.651: MCAST-HA: Sending DDE replay request for MVRF red.
*Aug  7 02:31:43.651: MCAST-HA: MFIB DDE replay completed for mvrf red
*Aug  7 02:31:43.651: MCAST-HA: No NSF Holdoff extension requested for mvrf red at completion of DDE replay.
*Aug  7 02:31:43.651: MCAST-HA: Terminating multicast NSF holdoff for MVRF red
*Aug  7 02:31:43.651: MCAST-HA: Still awaiting MFIB DDE replay for mvrf green
 DDE replay: NOT COMPLETED, MRIB update: NOT PENDING
*Aug  7 02:31:43.651: MCAST-HA: IGMP response timer expired. Ready for DDE replay for MVRF green
*Aug  7 02:31:43.651: MCAST-HA: Sending DDE replay request for MVRF green.
*Aug  7 02:31:43.651: MCAST-HA: MFIB DDE replay completed for mvrf green
*Aug  7 02:31:43.651: MCAST-HA: No NSF Holdoff extension requested for mvrf green at completion of DDE replay.
*Aug  7 02:31:43.651: MCAST-HA: Terminating multicast NSF holdoff for MVRF green
*Aug  7 02:31:43.651: MCAST-HA: Still awaiting MFIB DDE replay for mvrf blue
 DDE replay: NOT COMPLETED, MRIB update: NOT PENDING
*Aug  7 02:31:43.651: MCAST-HA: IGMP response timer expired. Ready for DDE replay for MVRF blue
*Aug  7 02:31:43.651: MCAST-HA: Sending DDE replay request for MVRF blue.
*Aug  7 02:31:43.651: MCAST-HA: MFIB DDE replay completed for mvrf blue
*Aug  7 02:31:43.651: MCAST-HA: No NSF Holdoff extension requested for mvrf blue at completion of DDE replay.
*Aug  7 02:31:43.651: MCAST-HA: Terminating multicast NSF holdoff for MVRF blue
*Aug  7 02:31:43.651: MCAST-HA: Still awaiting MFIB DDE replay for mvrf IPv4 default
 DDE replay: NOT COMPLETED, MRIB update: NOT PENDING
*Aug  7 02:31:43.651: MCAST-HA: IGMP response timer expired. Ready for DDE replay for MVRF IPv4 default
*Aug  7 02:31:43.651: MCAST-HA: Sending DDE replay request for MVRF IPv4 default.
*Aug  7 02:31:43.651: MCAST-HA: MFIB DDE replay completed for mvrf IPv4 default
*Aug  7 02:31:43.651: MCAST-HA: No NSF Holdoff extension requested for mvrf IPv4 default at completion of DDE replay.
*Aug  7 02:31:43.651: MCAST-HA: Terminating multicast NSF holdoff for MVRF IPv4 default
*Aug  7 02:31:43.651: MCAST-HA: MFIB DDE replay completed for all MVRFs.
*Aug  7 02:31:43.651: MCAST-HA: Stopping the MFIB DDE replay failsafe timer.
*Aug  7 02:32:13.651: MCAST-HA: Flush timer expired. Starting final RPF check for MVRF IPv4 default
*Aug  7 02:32:13.651: MCAST-HA: Flush timer expired. Starting final RPF check for MVRF blue
*Aug  7 02:32:13.651: MCAST-HA: Flush timer expired. Starting final RPF check for MVRF green
*Aug  7 02:32:13.651: MCAST-HA: Flush timer expired. Starting final RPF check for MVRF red
*Aug  7 02:32:14.151: MCAST-HA: Flushing stale mcast state. RP failover processing complete for MVRF IPv4 default.
*Aug  7 02:32:14.151: MCAST-HA: Flushing stale mcast state. RP failover processing complete for MVRF blue.
*Aug  7 02:32:14.151: MCAST-HA: Flushing stale mcast state. RP failover processing complete for MVRF green.
*Aug  7 02:32:14.151: MCAST-HA: Flushing stale mcast state. RP failover processing complete for MVRF red.
*Aug  7 02:32:14.151: MCAST-HA: RP failover processing complete for all MVRFs.
The following is sample output from the debug ip multicast redundancy command. This output shows the events related to the reloading of the standby RP, in particular, ISSU negotiation between the active and standby RP and synchronization of dynamic multicast forwarding information from the active RP to the standby RP. Synchronization events are also logged in steady state for events that occur that affect dynamic group-to-RP mapping information or dynamic tunnel state.
00:11:50: %HA-6-MODE: Operating RP redundancy mode is SSO
*Aug  7 02:32:45.435: MCAST-HA-RF: Status event: status=RF_STATUS_OPER_REDUNDANCY_MODE_CHANGE  Op=7  RFState=ACTIVE
*Aug  7 02:32:45.435: MCAST-HA-RF: Status event: status=RF_STATUS_REDUNDANCY_MODE_CHANGE  Op=7  RFState=ACTIVE
*Aug  7 02:32:45.435: MCAST-HA-RF: Status event: status=RF_STATUS_PEER_PRESENCE  Op=1  RFState=ACTIVE
*Aug  7 02:32:45.463: MCAST-HA-RF: Status event: status=RF_STATUS_PEER_COMM  Op=1  RFState=ACTIVE
*Aug  7 02:32:45.563: MCAST-HA-RF: Progression event: RF_Event=RF_PROG_ISSU_NEGOTIATION RFState=ACTIVE
*Aug  7 02:32:46.039: MCAST-HA-RF: Progression event: RF_Event=RF_PROG_PLATFORM_SYNC RFState=ACTIVE
*Aug  7 02:32:46.979: MCAST-HA: Received cf status CHKPT_STATUS_PEER_READY
*Aug  7 02:32:46.979: MCAST-ISSU Handling communication up transition for PIM HA transport type 0, RF comm = TRUE, renegotiation NOT PENDING
*Aug  7 02:32:46.979: MCAST-HA: Received cf status CHKPT_STATUS_IPC_FLOW_ON
*Aug  7 02:32:47.043: MCAST-HA-RF: Progression event: RF_Event=RF_PROG_STANDBY_ISSU_NEGOTIATION_LATE RFState=ACTIVE
*Aug  7 02:32:50.943: MCAST-HA-RF: Progression event: RF_Event=RF_PROG_STANDBY_CONFIG RFState=ACTIVE
*Aug  7 02:32:50.947: MCAST-ISSU Negotiation message sent from primary, rc = 0
*Aug  7 02:32:50.947: MCAST-HA-RF: Started PIM ISSU negotiation on the primary RP.
*Aug  7 02:32:50.947: MCAST-ISSU Negotiation message sent from primary, rc = 0
*Aug  7 02:32:50.947: MCAST-ISSU Negotiation message sent from primary, rc = 0
*Aug  7 02:32:50.951: MCAST-ISSU Negotiation message sent from primary, rc = 0
*Aug  7 02:32:50.951: MCAST-ISSU Negotiation message sent from primary, rc = 0
*Aug  7 02:32:50.951: MCAST-ISSU Negotiation message sent from primary, rc = 0
*Aug  7 02:32:50.951: MCAST-ISSU Negotiation message sent from primary, rc = 0
*Aug  7 02:32:50.955: MCAST-ISSU Negotiation message sent from primary, rc = 0
*Aug  7 02:32:50.955: MCAST-ISSU Negotiation message sent from primary, rc = 0
*Aug  7 02:32:50.955: MCAST-ISSU Negotiation message sent from primary, rc = 0
*Aug  7 02:32:50.955: MCAST-ISSU Negotiation message sent from primary, rc = 0
*Aug  7 02:32:50.959: MCAST-ISSU Negotiation message sent from primary, rc = 0
*Aug  7 02:32:50.959: MCAST-ISSU Negotiation message sent from primary, rc = 0
*Aug  7 02:32:50.959: MCAST-ISSU Negotiation message sent from primary, rc = 0
*Aug  7 02:32:50.959: MCAST-ISSU Negotiation message sent from primary, rc = 0
*Aug  7 02:32:50.959: MCAST-ISSU Negotiation message sent from primary, rc = 0
*Aug  7 02:32:50.963: MCAST-ISSU Negotiation message sent from primary, rc = 0
*Aug  7 02:32:50.963: MCAST-ISSU Negotiation message sent from primary, rc = 0
*Aug  7 02:32:50.963: MCAST-ISSU Negotiation message sent from primary, rc = 0
*Aug  7 02:32:50.963: MCAST-ISSU Negotiation message sent from primary, rc = 0
*Aug  7 02:32:50.967: MCAST-ISSU Negotiation message sent from primary, rc = 0
*Aug  7 02:32:50.967: MCAST-ISSU Negotiation message sent from primary, rc = 0
*Aug  7 02:32:50.967: MCAST-ISSU Negotiation message sent from primary, rc = 0
*Aug  7 02:32:50.967: MCAST-ISSU Negotiation message sent from primary, rc = 0
*Aug  7 02:32:50.967: MCAST-ISSU Negotiation message sent from primary, rc = 0
*Aug  7 02:32:50.971: MCAST-ISSU Negotiation message sent from primary, rc = 0
*Aug  7 02:32:50.971: MCAST-ISSU Negotiation message sent from primary, rc = 0
*Aug  7 02:32:50.971: MCAST-ISSU Negotiation completed for PIM Checkpoint Facility client, negotiation rc = 4, negotiation result = COMPATIBLE
*Aug  7 02:32:59.927: MCAST-HA-RF: Progression event: RF_Event=RF_PROG_STANDBY_FILESYS RFState=ACTIVE
*Aug  7 02:32:59.963: MCAST-HA-RF: Progression event: RF_Event=RF_PROG_STANDBY_BULK RFState=ACTIVE
*Aug  7 02:32:59.963: MCAST-HA-RF: Starting Bulk Sync.
*Aug  7 02:32:59.963: MCAST-HA: Successfully created the bulk sync process
*Aug  7 02:32:59.963: MCAST-HA: Starting Bulk sync
*Aug  7 02:32:59.963: MCAST HA Executing RP mapping bulk sync.
*Aug  7 02:32:59.963: MCAST HA Executing Bidir RP route bulk sync.
*Aug  7 02:32:59.963: MCAST HA Executing BSR cache bulk sync.
*Aug  7 02:32:59.963: MCAST-HA BSR cache sync request received for mvrf IPv4 default
*Aug  7 02:32:59.963: MCAST-HA: Creating Bootstrap cache sync request chunk size=112 max=585 align=8
*Aug  7 02:32:59.963: MCAST-HA: Allocating Bootstrap cache sync request sync request
*Aug  7 02:32:59.963: MCAST-HA Formatting BSR cache sync message:
search for mvrf IPv4 default result is 0 mvrf at 0x4A21680
*Aug  7 02:32:59.971: MCAST-HA BSR cache sync request received for mvrf blue
*Aug  7 02:32:59.971: MCAST-HA: Allocating Bootstrap cache sync request sync request
*Aug  7 02:32:59.971: MCAST-HA Formatting BSR cache sync message:
search for mvrf blue result is 0 mvrf at 0x50EE660
*Aug  7 02:32:59.983: MCAST-HA BSR cache sync request received for mvrf green
*Aug  7 02:32:59.983: MCAST-HA: Allocating Bootstrap cache sync request sync request
*Aug  7 02:32:59.983: MCAST-HA Formatting BSR cache sync message:
search for mvrf green result is 0 mvrf at 0x5103300
*Aug  7 02:32:59.991: MCAST-HA BSR cache sync request received for mvrf red
*Aug  7 02:32:59.991: MCAST-HA: Allocating Bootstrap cache sync request sync request
*Aug  7 02:32:59.991: MCAST-HA Formatting BSR cache sync message:
search for mvrf red result is 0 mvrf at 0x5135FE0
*Aug  7 02:33:00.003: MCAST HA Executing AutoRP discovery IDB bulk sync.
*Aug  7 02:33:00.003: MCAST-HA AutoRP discovery IDB sync request received for
mvrf IPv4 default
*Aug  7 02:33:00.003: MCAST-HA: Creating Autorp discovery IDB sync request chunk size=112 max=585 align=8
*Aug  7 02:33:00.003: MCAST-HA: Allocating Autorp discovery IDB sync request sync request
*Aug  7 02:33:00.003: MCAST-HA Formatting AutoRP discovery IDB sync message:
search for mvrf IPv4 default result is 0 mvrf at 0x4A21680
*Aug  7 02:33:00.011: MCAST-HA AutoRP discovery IDB sync request received for
mvrf blue
*Aug  7 02:33:00.011: MCAST-HA: Allocating Autorp discovery IDB sync request sync request
*Aug  7 02:33:00.011: MCAST-HA Formatting AutoRP discovery IDB sync message:
search for mvrf blue result is 0 mvrf at 0x50EE660
*Aug  7 02:33:00.023: MCAST-HA AutoRP discovery IDB sync request received for
mvrf green
*Aug  7 02:33:00.023: MCAST-HA: Allocating Autorp discovery IDB sync request sync request
*Aug  7 02:33:00.023: MCAST-HA Formatting AutoRP discovery IDB sync message:
search for mvrf green result is 0 mvrf at 0x5103300
*Aug  7 02:33:00.031: MCAST-HA AutoRP discovery IDB sync request received for
mvrf red
*Aug  7 02:33:00.031: MCAST-HA: Allocating Autorp discovery IDB sync request sync request
*Aug  7 02:33:00.031: MCAST-HA Formatting AutoRP discovery IDB sync message:
search for mvrf red result is 0 mvrf at 0x5135FE0
*Aug  7 02:33:00.043: MCAST HA Executing dummy bulk sync function.
*Aug  7 02:33:00.043: MCAST HA Executing dummy bulk sync function.
*Aug  7 02:33:00.043: MCAST HA Executing dummy bulk sync function.
*Aug  7 02:33:00.043: MCAST HA Executing MDT tunnel bulk sync.
*Aug  7 02:33:00.043: MCAST-HA MDT tunnel sync request received for mvrf blue
*Aug  7 02:33:00.043: MCAST-HA: Creating MDT tunnel sync request chunk size=112 max=585 align=8
*Aug  7 02:33:00.043: MCAST-HA: Allocating MDT tunnel sync request sync request
*Aug  7 02:33:00.043: MCAST-HA Formatting MDT tunnel sync message:
search for mvrf blue result is 0 mvrf at 0x50EE660
*Aug  7 02:33:00.051: MCAST-HA MDT tunnel sync request received for mvrf green
*Aug  7 02:33:00.051: MCAST-HA: Allocating MDT tunnel sync request sync request
*Aug  7 02:33:00.051: MCAST-HA Formatting MDT tunnel sync message:
search for mvrf green result is 0 mvrf at 0x5103300
*Aug  7 02:33:00.063: MCAST-HA MDT tunnel sync request received for mvrf red
*Aug  7 02:33:00.063: MCAST-HA: Allocating MDT tunnel sync request sync request
*Aug  7 02:33:00.063: MCAST-HA Formatting MDT tunnel sync message:
search for mvrf red result is 0 mvrf at 0x5135FE0
*Aug  7 02:33:00.071: MCAST HA Executing Bidir RP DF bulk sync.
*Aug  7 02:33:00.071: MCAST HA Executing register tunnel bulk sync.
*Aug  7 02:33:00.071: MCAST-HA: Completed enqueuing of bulk sync messages.
*Aug  7 02:33:00.071: MCAST-HA: Bulk sync message queue has drained.
*Aug  7 02:33:00.071: MCAST-HA: Received acknowledgement from standby for all bulk sync messages.
*Aug  7 02:33:00.071: MCAST-HA Creating bulk sync completion message for peer.
*Aug  7 02:33:00.071: MCAST-HA: Primary has notified standby of bulk sync completion. Waiting for final bulk sync ACK from stby.
*Aug  7 02:33:00.075: MCAST-HA: Received cf status CHKPT_STATUS_SEND_OK
*Aug  7 02:33:00.075: MCAST-HA: Sent message type is 2
*Aug  7 02:33:00.075: MCAST-HA Searching for sync request corresponding to the successfully received message.
*Aug  7 02:33:00.075: MCAST-HA Transmission from primary and reception by standby confirmed for sync type 2. Cleanup is complete.
*Aug  7 02:33:00.087: MCAST-HA: Received cf status CHKPT_STATUS_SEND_OK
*Aug  7 02:33:00.087: MCAST-HA: Sent message type is 2
*Aug  7 02:33:00.087: MCAST-HA Searching for sync request corresponding to the successfully received message.
*Aug  7 02:33:00.087: MCAST-HA Transmission from primary and reception by standby confirmed for sync type 2. Cleanup is complete.
*Aug  7 02:33:00.087: MCAST-HA: Received cf status CHKPT_STATUS_SEND_OK
*Aug  7 02:33:00.087: MCAST-HA: Sent message type is 3
*Aug  7 02:33:00.087: MCAST-HA Searching for sync request corresponding to the successfully received message.
*Aug  7 02:33:00.087: MCAST-HA Transmission from primary and reception by standby confirmed for sync type 3. Cleanup is complete.
*Aug  7 02:33:00.087: MCAST-HA: Received cf status CHKPT_STATUS_SEND_OK
*Aug  7 02:33:00.087: MCAST-HA: Sent message type is 8
*Aug  7 02:33:00.087: MCAST-HA Searching for sync request corresponding to the successfully received message.
*Aug  7 02:33:00.087: MCAST-HA Transmission from primary and reception by standby confirmed for sync type 8. Cleanup is complete.
*Aug  7 02:33:00.087: MCAST-HA: Received cf status CHKPT_STATUS_SEND_OK
*Aug  7 02:33:00.087: MCAST-HA: Sent message type is 11
*Aug  7 02:33:00.087: MCAST-HA Process: Primary RP received standby ACK for reception of bulk sync completion message.
*Aug  7 02:33:00.087: MCAST-HA Notifying RF to continue progression.
*Aug  7 02:33:00.087: MCAST-HA: Wakeup received for bulk sync completion.
major = 4, minor = 2.
*Aug  7 02:33:00.091: MCAST-HA Process: Primary RP received bulk sync completion confirmation from standby.
*Aug  7 02:33:00.091: MCAST-HA RF notification previously sent.
*Aug  7 02:33:00.455: MCAST-HA-RF: Progression event: RF_Event=RF_PROG_STANDBY_HOT RFState=ACTIVE
00:12:05: %HA_CONFIG_SYNC-6-BULK_CFGSYNC_SUCCEED: Bulk Sync succeeded
00:12:05: %HA-6-STANDBY_READY: Standby RP in slot 7 is operational in SSO  mode
00:12:05: %RF-5-RF_TERMINAL_STATE: Terminal state reached for (SSO)
debug ip multicast rpf tracked
To enable debugging output for IP multicast Return Path Forwarding (RPF) tracked events, use the debug ip multicast rpf trackedcommand in privileged EXEC mode. To disable debugging output, use the no form of this command.
debug ip multicast topology
To enable debugging output for IP multicast stream topology creation events, deletion events, and IP multicast stream access control list (ACL) matching events, use the debug ip multicast topology command in privileged EXEC mode. To disable debugging output, use the no form of this command.
Usage Guidelines
Use this command when IP multicast stream topology creation, IP multicast stream topology deletion, or IP multicast stream ACL matching appears not to be functioning.
Examples
The following example shows how to enable debugging output for IP multicast stream topology creation events, IP multicast stream topology deletion events, and IP multicast stream ACL matching events:
Router# debug ip multicast topologydebug ip nat
To display information about IP packets translated by the IP Network Address Translation (NAT) feature, use the debug ip natcommand in privileged EXEC mode. To disable debugging output, use the noform of this command.
debug ip nat [ access-list | cce | detailed | h323 | error | fragment | generic | ipsec | multipart | nvi | piggy-back | port | pptp | route | sbc | sip | skinny | tcp-alg | vrf | wlan-nat ]
no debug ip nat [ access-list | cce | detailed | h323 | error | fragment | generic | ipsec | multipart | nvi | piggy-back | port | pptp | route | sbc | sip | skinny | tcp-alg | vrf | wlan-nat ]
Syntax Description
access-list
(Optional) Standard IP access list number. If the datagram is not permitted by the specified access list, the related debugging output is suppressed.
cce
(Optional) Displays debug information for all Common Classification Engine (CCE) events.
detailed
(Optional) Displays debugging information in a detailed format.
h323
(Optional) Displays H.225, H.245, and H.323 protocol information.
error
(Optional) Displays debug information for error conditions in NAT-Application Layer Gateway (ALG) segmentation with Layer 4 forwarding.
fragment
(Optional) Displays fragment events.
generic
(Optional) Displays generic ALG handler events.
ipsec
(Optional) Displays IPsec packet information.
multipart
(Optional) Displays multipart processing information.
nvi
(Optional) Displays NAT Virtual Interface (NVI) events.
piggy-back
(Optional) Displays piggyback support events.
port
(Optional) Displays port information.
pptp
(Optional) Displays Point-to-Point Tunneling Protocol (PPTP) information.
route
(Optional) Displays route information.
sbc
(Optional) Displays NAT Session Initiation Protocol (SIP) Session Border Controller (SBC) events.
sip
(Optional) Displays SIP information.
skinny
(Optional) Displays skinny protocol debug information.
tcp-alg
(Optional) Displays debug information for NAT-ALG segmentation with Layer 4 forwarding.
vrf
(Optional) Displays VPN routing and forwarding (VRF) traffic-related information.
wlan-nat
(Optional) Displays Wireless LAN (WLAN) information.
Command History
Release
Modification
11.2
This command was introduced.
12.1(5)T
This command was modified. The h323 keyword was added.
12.2(8)T
This command was modified. The sipkeyword was added.
12.2(13)T
This command was modified. The ipsec and vrf keywords were added.
12.3(2)XE
This command was modified. The wlan-nat keyword was added.
12.3(7)T
This command was modified. The wlan-nat keyword was implemented in Cisco IOS Release 12.3(7)T.
12.3(11)T
This command was modified. The output of the h323 keyword was expanded to include H.245 tunneling.
12.2(33)SRA
This command was integrated into Cisco IOS Release 12.2(33)SRA.
15.0(1)M
This command was modified. The multipart keyword was added.
15.1(3)T
This command was modified. The cce keyword was removed and the tcp-alg keyword was added.
Usage Guidelines
The NAT feature reduces the need for unique, registered IP addresses. It can also save private network administrators from needing to renumber the hosts and routers that do not conform to global IP addressing.
Use the debug ip natcommand to verify the operation of the NAT feature by displaying information about each packet that the router translates. The debug ip nat detailed command generates a description of each packet considered for translation. This command also displays information about certain errors or exception conditions, such as the failure to allocate a global address. To display messages related to the processing of H.225 signaling and H.245 messages, use the debug ip nat h323 command. To display messages related to the processing of SIP messages, use the debug ip nat sip command. To display messages related to the processing of VRF messages, use the debug ip nat vrf command. To display messages related to the processing of SIP multipart messages, use the debug ip nat sip command.
Caution
Because the debug ip nat command generates a substantial amount of output, use it only when traffic on the IP network is low, so that the other activity on the system is not adversely affected.
Examples
The following is sample output from the debug ip natcommand. In this example, the first two lines show the Domain Name System (DNS) request and reply debugging output. The remaining lines show debugging output from a Telnet connection from a host on the inside of the network to a host on the outside of the network. All Telnet packets, except for the first packet, were translated in the fast path, as indicated by the asterisk (*).
Router# debug ip nat
NAT: s=192.0.2.1->203.0.112.1, d=203.0.112.254 [6825]
NAT: s=203.0.112.254, d=203.0.112.1->192.0.2.1 [21852]
NAT: s=192.0.2.1->203.0.112.1, d=203.0.112.200 [6826]
NAT*: s=203.0.112.200, d=203.0.112.1->192.0.2.1 [23311]
NAT*: s=192.0.2.1->203.0.112.1, d=203.0.112.200 [6827]
NAT*: s=192.0.2.1->203.0.112.1, d=203.0.112.200 [6828]
NAT*: s=203.0.112.200, d=203.0.112.1->192.0.2.1 [23313]
NAT*: s=203.0.112.200, d=203.0.112.1->192.0.2.1 [23325]
s
The table below describes the significant fields shown in the display.
Table 14 debug ip nat Field Descriptions Field
Description
NAT
Indicates that the packet is being translated by NAT. An asterisk (*) indicates that the translation is occurring in the fast path. The first packet in a conversation always goes through the slow path (that is, it is process switched). The remaining packets go through the fast path if a cache entry exists.
s=192.0.2.1->203.0.112.1
Source address of the packet and how it is being translated.
d=203.0.112.254
Destination address of the packet.
[6825]
IP identification number of the packet. Might be useful in the debugging process to correlate with other packet traces from protocol analyzers.
The following is sample output from the debug ip nat detailed command. In this example, the first two lines show the debugging output produced by a DNS request and reply. The remaining lines show the debugging output from a Telnet connection from a host on the inside of the network to a host on the outside of the network. In this example, the inside host 192.168.1.95 was assigned the global address 172.31.233.193. The output fields are self-explanatory.
Router# debug ip nat detailed
NAT: i: udp (192.168.1.95, 1493) -> (172.31.2.132, 53) [22399]
NAT: o: udp (172.31.2.132, 53) -> (172.31.233.193, 1493) [63671]
NAT*: i: tcp (192.168.1.95, 1135) -> (172.31.2.75, 23) [22400]
NAT*: o: tcp (172.31.2.75, 23) -> (172.31.233.193, 1135) [22002]
NAT*: i: tcp (192.168.1.95, 1135) -> (172.31.2.75, 23) [22401]
NAT*: i: tcp (192.168.1.95, 1135) -> (172.31.2.75, 23) [22402]
NAT*: o: tcp (172.31.2.75, 23) -> (172.31.233.193, 1135) [22060]
NAT*: o: tcp (172.31.2.75, 23) -> (172.31.233.193, 1135) [22071]
The following is sample output from the debug ip nat h323 command. In this example, an H.323 call is established between two hosts, one host on the inside and the other host on the outside of the network. The debugging output displays the H.323 message names that NAT recognizes and the embedded IP addresses contained in those messages.
Router# debug ip nat h323
NAT:H225:[0] processing a Setup message
NAT:H225:[0] found Setup sourceCallSignalling
NAT:H225:[0] fix transportAddress addr=192.168.122.50 port=11140
NAT:H225:[0] found Setup fastStart
NAT:H225:[0] Setup fastStart PDU length:18
NAT:H245:[0] processing OpenLogicalChannel message, forward channel
number 1
NAT:H245:[0] found OLC forward mediaControlChannel
NAT:H245:[0] fix TransportAddress addr=192.168.122.50 port=16517
NAT:H225:[0] Setup fastStart PDU length:29
NAT:H245:[0] Processing OpenLogicalChannel message, forward channel
number 1
NAT:H245:[0] found OLC reverse mediaChannel
NAT:H245:[0] fix Transportaddress addr=192.168.122.50 port=16516
NAT:H245:[0] found OLC reverse mediaControlChannel
NAT:H245:[0] fix TransportAddress addr=192.168.122.50 port=16517
NAT:H225:[1] processing an Alerting message
NAT:H225:[1] found Alerting fastStart
NAT:H225:[1] Alerting fastStart PDU length:25
NAT:H245:[1] processing OpenLogicalChannel message, forward channel
number 1
NAT:H323:[0] received pak, payload_len=46
NAT:H323:[0] processed up to new_payload_len 4
NAT:H323:[0] expecting data len=42--payload_len left 42
NAT:H323:[0] try to process tpkt with len 42, payload_len left 42
NAT:H225:processing a Facility message
NAT:H225:pdu_len :31 msg_IE:28
NAT:H323:choice-value:9
NAT:H225:[0] found h245Tunneling
NAT:H225:[0] found h245Control
NAT:H225:[0] h245control PDU length:20
NAT:H245:[0] processing OpenLogicalChannel message, forward channel
number 2
NAT:H245:[0] found OLC forward mediaControlChannel
NAT:H245:[0] fix TransportAddress addr=192.168.122.50 port=51001
NAT:H245:[0] TransportAddress addr changed 192.168.122.50->172.31.122.129
NAT:H245:[0] message changed, encoding back
NAT:H245:exit process tpkt with new_len 20
NAT:H225:message changed, encoding back
NAT:H323:[0] processed up to new_payload_len 46
NAT:H323:[0] new pak payload len is 46
The table below describes the significant fields shown in the display.
Table 15 debug ip nat h323 Field Descriptions Field
Description
NAT
Indicates that the packet is being translated by NAT.
H.225, H.245, and H.323
Protocol of the packet.
[0]
Indicates that the packet is moving from a host outside the network to one host inside the network.
[1]
Indicates that the packet is moving from a host inside the network to one host outside the network.
The following is sample output from the debug ip nat ipsec command. The output fields are self-explanatory.
Router# debug ip nat ipsec
5d21h:NAT:new IKE going In->Out, source addr 192.168.122.35, destination addr 192.168.22.20, initiator cookie
0x9C42065D
5d21h:NAT:IPSec:created In->Out ESP translation IL=192.168.122.35 SPI=0xAAE32A0A, IG=192.168.22.40, OL=192.168.22.20,
OG=192.168.22.20
5d21h:NAT:IPSec:created Out->In ESP translation OG=192.168.22.20 SPI=0xA64B5BB6, OL=192.168.22.20, IG=192.168.22.40,
IL=192.168.122.35
5d21h:NAT:new IKE going In->Out, source addr 192.168.122.20, destination addr 192.168.22.20, initiator cookie
0xC91738FF
5d21h:NAT:IPSec:created In->Out ESP translation IL=192.168.122.20 SPI=0x3E2E1B92, IG=192.168.22.40, OL=192.168.22.20,
OG=192.168.22.20
5d21h:NAT:IPSec:Inside host (IL=192.168.122.20) trying to open an ESP connection to Outside host (OG=192.168.22.20),
wait for Out->In reply
5d21h:NAT:IPSec:created Out->In ESP translation OG=192.168.22.20 SPI=0x1B201366, OL=192.168.22.20, IG=192.168.22.40,
IL=192.168.122.20
The following is sample output from the debug ip nat sipcommand. In this example, one IP phone registers with a Cisco SIP proxy and then calls another IP phone. The debugging output displays the SIP messages that NAT recognizes and the embedded IP addresses contained in those messages.
Router# debug ip nat sip
NAT:SIP:[0] processing REGISTER message
NAT:SIP:[0] translated embedded address
192.168.122.3->10.1.1.1
NAT:SIP:[0] translated embedded address
192.168.122.3->10.1.1.1
NAT:SIP:[0] message body found
NAT:SIP:[0] found address/port in SDP body:192.168.122.20
20332
NAT:SIP:[1] processing SIP/2.0 100 Trying reply message
NAT:SIP:[1] translated embedded address
10.1.1.1->192.168.122.3
NAT:SIP:[1] processing SIP/2.0 200 OK reply message
NAT:SIP:[1] translated embedded address
10.1.1.1->192.168.122.3
NAT:SIP:[1] translated embedded address
10.1.1.1->192.168.122.3
NAT:SIP:[1] processing INVITE message
NAT:SIP:[1] translated embedded address
10.1.1.1->192.168.122.3
NAT:SIP:[1] message body found
NAT:SIP:[1] found address/port in SDP body:192.168.22.20
The table below describes the significant fields shown in the display.
Table 16 debug ip nat sip Field Descriptions Field
Description
NAT
Indicates that the packet is being translated by NAT.
SIP
Protocol of the packet.
[0]
Indicates that the packet is moving from a host outside the network to one host inside the network.
[1]
Indicates that the packet is moving from a host inside the network to one host outside the network.
The following is sample output from the debug ip nat tcp-alg command:
Router# debug ip nat tcp-alg
*Oct  6 04:56:13.411:  NAT-L4F:setting ALG_NEEDED flag in subblock
*Oct  6 04:56:13.411:  NAT-L4F : Still in the spoofing mode, tcpflags = 0x4
*Oct  6 04:56:13.411:  NAT-L4F : Close notify from L4F
*Oct  6 04:56:13.427:  NAT-L4F:setting ALG_NEEDED flag in subblock
*Oct  6 04:56:23.807:  NAT-L4F:setting ALG_NEEDED flag in subblock
*Oct  6 04:56:23.807:  NAT-L4F: Policy check successful
*Oct  6 04:56:23.807:  NAT-L4F: received fd1: 1073741825 and
                    tcp flags = 0x2, payload_len = 0
*Oct  6 04:56:23.811:  NAT-L4F:setting ALG_NEEDED flag in subblock
*Oct  6 04:56:23.811:  NAT-L4F: received fd2: 1073741826 and
                    tcp flags = 0x12,payload_len = 0
*Oct  6 04:56:23.811:  NAT-L4F:setting ALG_NEEDED flag in subblock
*Oct  6 04:56:23.811:  NAT-L4F: Received final ACK from fd1 : 1073741825 and
                   tcp flags = 0x10
*Oct  6 04:56:23.811:  NAT-L4F:Transistioning to proxy: rc 0 error 0
*Oct  6 04:56:23.811: NAT-ALG: H.225/H.245 ASN encode/decode library initialized
*Oct  6 04:56:23.811:  NAT-L4F: Successfully proxied this flow
*Oct  6 04:56:23.811:  NAT-L4F:setting ALG_NEEDED flag in subblock
*Oct  6 04:56:23.811: NAT-ALG: lookup=0 l7_bytes_recd=12 appl_type=5
*Oct  6 04:56:23.811: NAT-ALG: Skinny l7_msg_size = 12
*Oct  6 04:56:23.811: NAT-ALG: after state machine:
*Oct  6 04:56:23.811: NAT-ALG: remaining_hdr_sz=0
*Oct  6 04:56:23.811: NAT-ALG: remaining_payl_sz=0
*Oct  6 04:56:23.811: NAT-ALG: tcp_alg_state=0
*Oct  6 04:56:23.811: NAT-ALG: complete_msg_len=12
*Oct  6 04:56:23.811:  l4f_send returns 12 bytes
*Oct  6 04:56:23.811:  Complete buffer written to proxy
*Oct  6 04:56:23.811:  NAT-L4F:NO DATA to read
*Oct  6 04:56:23.815:  NAT-L4F:setting ALG_NEEDED flag in subblock
*Oct  6 04:56:24.027:  NAT-L4F:setting ALG_NEEDED flag in subblock
*Oct  6 04:56:24.027: NAT-ALG: lookup=0 l7_bytes_recd=56 appl_type=5
*Oct  6 04:56:24.027: NAT-ALG: Skinny l7_msg_size = 56
*Oct  6 04:56:24.027: NAT-ALG: after state machine:
*Oct  6 04:56:24.027: NAT-ALG: remaining_hdr_sz=0
*Oct  6 04:56:24.027: NAT-ALG: remaining_payl_sz=0
*Oct  6 04:56:24.027: NAT-ALG: tcp_alg_state=0
*Oct  6 04:56:24.027: NAT-ALG: complete_msg_len=56
*Oct  6 04:56:24.027:  l4f_send returns 56 bytes
*Oct  6 04:56:24.027:  Complete buffer written to proxy
*Oct  6 04:56:24.027:  NAT-L4F:NO DATA to read
*Oct  6 04:56:24.035:  NAT-L4F:setting ALG_NEEDED flag in subblock
*Oct  6 04:56:24.239:  NAT-L4F:setting ALG_NEEDED flag in subblock
*Oct  6 04:56:24.239: NAT-ALG: lookup=0 l7_bytes_recd=16 appl_type=5
*Oct  6 04:56:24.239: NAT-ALG: Skinny l7_msg_size = 16
*Oct  6 04:56:24.239: NAT-ALG: after state machine:
*Oct  6 04:56:24.239: NAT-ALG: remaining_hdr_sz=0
*Oct  6 04:56:24.239: NAT-ALG: remaining_payl_sz=0
*Oct  6 04:56:24.239: NAT-ALG: tcp_alg_state=0
*Oct  6 04:56:24.239: NAT-ALG: complete_msg_len=16
*Oct  6 04:56:24.239:  l4f_send returns 16 bytes
*Oct  6 04:56:24.239:  Complete buffer written to proxy
*Oct  6 04:56:24.239:  NAT-L4F:NO DATA to read
*Oct  6 04:56:24.239:  NAT-L4F:setting ALG_NEEDED flag in subblock
*Oct  6 04:56:24.239: NAT-ALG: lookup=1 l7_bytes_recd=116 appl_type=5
*Oct  6 04:56:24.239: NAT-ALG: Skinny l7_msg_size = 116
*Oct  6 04:56:24.239: NAT-ALG: after state machine:
*Oct  6 04:56:24.239: NAT-ALG: remaining_hdr_sz=0
*Oct  6 04:56:24.239: NAT-ALG: remaining_payl_sz=0
*Oct  6 04:56:24.239: NAT-ALG: tcp_alg_state=0
*Oct  6 04:56:24.239: NAT-ALG: complete_msg_len=116
*Oct  6 04:56:24.239:  l4f_send returns 116 bytes
*Oct  6 04:56:24.239:  Complete buffer written to proxy
*Oct  6 04:56:24.239:  NAT-L4F:NO DATA to read
*Oct  6 04:56:24.239:  NAT-L4F:setting ALG_NEEDED flag in subblock
*Oct  6 04:56:24.239: NAT-ALG: lookup=0 l7_bytes_recd=32 appl_type=5
*Oct  6 04:56:24.239: NAT-ALG: Skinny l7_msg_size = 32
*Oct  6 04:56:24.239: NAT-ALG: after state machine:
*Oct  6 04:56:24.239: NAT-ALG: remaining_hdr_sz=0
*Oct  6 04:56:24.239: NAT-ALG: remaining_payl_sz=0
*Oct  6 04:56:24.239: NAT-ALG: tcp_alg_state=0
*Oct  6 04:56:24.239: NAT-ALG: complete_msg_len=32
*Oct  6 04:56:24.239:  l4f_send returns 32 bytes
*Oct  6 04:56:24.239:  Complete buffer written to proxy
*Oct  6 04:56:24.239:  NAT-L4F:NO DATA to read
*Oct  6 04:56:24.243:  NAT-L4F:setting ALG_NEEDED flag in subblock
*Oct  6 04:56:24.243:  NAT-L4F:read RST, aborting
*Oct  6 04:56:24.243:  NAT-L4F:Buffer list is empty
*Oct  6 04:56:24.243:  NAT-L4F : Close notify from L4F
The table below describes the significant fields shown in the display.
Table 17 debug ip nat tcp-alg Field Descriptions Field
Description
NAT-L4F
Indicates that the packet is being processed by the NAT-ALG interface with Layer 4 forwarding.
NAT-ALG
Indicates that the packet is being processed by NAT-ALG.
The following is sample output from the debug ip nat vrf command:
Router# debug ip nat vrf
6d00h:NAT:address not stolen for 192.168.121.113, proto 1 port 7224
6d00h:NAT:creating portlist proto 1 globaladdr 10.1.1.10
6d00h:NAT:Allocated Port for 192.168.121.113 -> 10.1.1.10:wanted 7224 got 7224
6d00h:NAT:i:icmp (192.168.121.113, 7224) -> (172.28.88.2, 7224) [2460]
6d00h:NAT:s=192.168.121.113->10.1.1.10, d=172.28.88.2 [2460] vrf=> shop
6d00h:NAT*:o:icmp (172.28.88.2, 7224) -> (10.1.1.10, 7224) [2460]      vrf=> shop
6d00h:NAT*:s=172.28.88.2, d=10.1.1.10->192.168.121.113 [2460] vrf=> shop
6d00h:NAT:Allocated Port for 192.168.121.113 -> 10.1.1.10:wanted 7225 got 7225
6d00h:NAT:i:icmp (192.168.121.113, 7225) -> (172.28.88.2, 7225) [2461]
6d00h:NAT:s=192.168.121.113->10.1.1.10, d=172.28.88.2 [2461] vrf=> shop
6d00h:NAT*:o:icmp (172.28.88.2, 7225) -> (10.1.1.10, 7225) [2461]      vrf=> shop
6d00h:NAT*:s=172.28.88.2, d=10.1.1.10->192.168.121.113 [2461] vrf=> shop
6d00h:NAT:Allocated Port for 192.168.121.113 -> 10.1.1.10:wanted 7226 got 7226
6d00h:NAT:i:icmp (192.168.121.113, 7226) -> (172.28.88.2, 7226) [2462]
6d00h:NAT:s=192.168.121.113->10.1.1.10, d=172.28.88.2 [2462] vrf=> shop
The table below describes the significant fields shown in the display.
Table 18 debug ip nat vrf Field Descriptions Field
Description
NAT
Indicates that the packet is being translated by NAT.
s=192.168.121.113->10.1.1.10
Source address of the packet and how it is being translated.
d=172.28.88.2
Destination address of the packet.
[2460]
IP identification number of the packet.
vrf=>
Indicates that NAT is applied to a particular VPN.
The following is sample output from the debug ip nat wlan-nat command:
Router# debug ip nat wlan-nat
WLAN-NAT: Creating secure ARP entry (10.1.1.1,0010.7bc2.9ff6)
WLAN-NAT: Triggered Acct Start for (209.165.201.1,0010.7bc2.9ff6)
WLAN-NAT: Extracting addr:209.165.201.1,input_idb:Ethernet1/2 from pak
WLAN-NAT: Saving address:209.165.201.1,input_idb:Ethernet1/2 in pak
After the WLAN-entry times out, the following debugs will be seen:
WLAN-NAT: Removing secure arp entry (10.1.1.1,0010.7bc2.9ff6)
WLAN-NAT: triggered Acct Stop for (209.165.201.1,0010.7bc2.9ff6)
The table below describes the significant fields shown in the display.
Related Commands
Command
Description
clear ip nat translation
Clears dynamic NAT translations from the translation table.
ip nat
Designates that traffic originating from or destined for an interface is subject to NAT.
ip nat inside destination
Enables NAT of the inside destination address.
ip nat inside source
Enables NAT of the inside source address.
ip nat outside source
Enables NAT of the outside source address.
ip nat pool
Defines a pool of IP addresses for NAT.
ip nat service
Enables a port other than the default port.
show ip nat statistics
Displays NAT statistics.
show ip nat translations
Displays active NAT translations.
debug ip nat redundancy
To enable debugging output for the IP Network Address Translation (NAT) redundancy, use the debug ip nat redundancy command in privileged EXEC mode. To disable debugging output, use the no form of this command.
debug ip nat redundancy { [ rf | db ] [ errors ] | messages | [ detailed | errors ] | cf | packets }
no debug ip nat redundancy { [ rf | db ] [ errors ] | messages | [ detailed | errors ] | cf | packets }
Syntax Description
rf Specifies debugging for Redundancy Framework (RF).
db Specifies debugging for the database.
errors Specifies debugging for errors cases.
messages Specifies debugging for messages.
detailed Specifies detailed debugging for messages.
cf Specifies debugging for the checkpointing facility.
packets Specifies debugging for packet information.
Command History
Usage Guidelines
Use the debug ip nat redundancy command to enable debugging output for NAT redundancy.
Examples
The following example shows how to enable debugging output for CF.
Device# debug ip nat redundancy cf IP NAT HA Checkpointing Facility debugging is on Device# show debugging *Nov 6 18:41:42.669: NAT-HA-CF: ipnat_ha_cf_msg_callback cf_hndl=33554611 ent_hndl=0 cf_msg=0xE4007230 *Nov 6 18:41:42.669: NAT-HA-CF: Recevied msg: payload=0xE4007270 len=152debug ip nbar trace
To enable detailed debugging of packets per flow on a data plane, use the debug ip nbar trace command in privileged EXEC mode. To disable debugging, use the no form of this command.
debug ip nbar trace { detail acl-name [ packets ] [ packets-per-flow ] | summary [ acl-name ] [ number-of-flows ] }
no debug ip nbar trace
Syntax Description
detail
Enables detailed debugging of packets per flow.
acl-name
Specifies the name of the access control list (ACL) configured on the device.
packets
(Optional) Specifies the total number of packets.
packets-per-flow
(Optional) Specifies the number of packets in a flow.
summary
Captures Network-Based Application Recognition (NBAR) classification summary.
number-of-flows
(Optional) Specifies the number of flows.
Examples
The following is sample output from the debug ip nbar trace detail command:
Device# debug ip nbar trace detail acl 100 200 Graph Id 1 Classification: 82, flag: 163 Packet No: 1 String: Searching Source V4 WKP String: Searching Destination V4 WKP String: Entering loop core from Heuristic Regex State Node:http-verify-heuristic-entry-point-get State Node:http-verify-heuristic-entry-point-get State Node:HTTP-url-get-check State Node:HTTP-url-get-check State Node:HTTP-url-get-check State Node:HTTP-url-get-check State Node:youtube-found-url State Node:http-check-url-fe State Node:HTTP-request-advance-packet-pointer-to-next-http-header State Node:HTTP-request-advance-packet-pointer-to-next-http-header State Node:HTTP-request-advance-packet-pointer-to-next-http-header State Node:HTTP-request-end-of-request-check State Node:HTTP-request-check-end-of-packet State Node:HTTP-request-check-end-of-packet State Node:HTTP-request-headers-parser State Node:HTTP-request-headers-parserdebug ip nbar clients
To enable debugging of application programming interfaces (APIs) pertaining to Network-Based Application Recognition (NBAR) on a control plane, use the debug ip nbar clients command in privileged EXEC mode. To disable debugging, use the no form of the command.
Examples
The following is sample output from the debug ip nbar clients low command:
Device# debug ip nbar clients low

*May 14 08:33:37.468: STILE:CLIENT:LOW: intf list: Interface not found
*May 14 08:33:37.468: STILE:CLIENT:LOW: intf list: Interface not found
*May 14 08:33:37.468: STILE:CLIENT:LOW: intf list: Interface not found
*May 14 08:33:37.468: STILE:CLIENT:LOW: intf list: Interface not found
*May 14 08:33:37.468: STILE:CLIENT:LOW: intf list: Interface not found
*May 14 08:33:37.468: STILE:CLIENT:LOW: Fast flag: SET FLAG
*May 14 08:33:37.468: STILE:CLIENT:LOW: Fast flag: Client configs Fast Flag result end:1
debug ip nbar config
To enable debugging of all commands configured for the activation and deactivation of Network-Based Application Recognition (NBAR) on a control plane, use the debug ip nbar config command in privileged EXEC mode. To disable debugging, use the no form of this command.
Examples
The following is sample output from the debug ip nbar config command:
Device# debug ip nbar config high

*May 14 08:36:59.059: STILE:CONF:HIGH: Attempt to add branch to node that does not have branches
*May 14 08:36:59.060: STILE:CONF:HIGH: Attempt to add branch to node that does not have branches
*May 14 08:37:04.314: STILE:CONF:HIGH: Fast flag request for MQC is 1
*May 14 08:37:04.314: STILE:CONF:HIGH: Update fast flag
*May 14 08:37:04.314: STILE:CONF:HIGH: Fast flag request for MQC is 1
*May 14 08:37:04.314: STILE:CONF:HIGH: MQC or P.D set fast flag
debug ip nbar platform
To enable debugging of application programming interfaces (APIs) pertaining to Network-Based Application Recognition (NBAR) on a control plane, use the debug ip nbar platform command in privileged EXEC mode. To disable debugging, use the no form of this command.
Examples
The following is sample output from the debug ip nbar platform command:
Device# debug ip nbar platform low

*May 14 02:15:29.214: STILE:PLAT:HIGH: fs range: invalid id
*May 14 02:15:29.214: STILE:PLAT:HIGH: fs range: invalid id
*May 14 02:15:29.214: STILE:PLAT:HIGH: fs range: invalid id
*May 14 02:15:29.214: STILE:PLAT:HIGH: fs range: invalid id
debug ip ospf adj
To display information on adjacency events related to Open Shortest Path First (OSPF), such as packets being dropped due to a Time-to-Live (TTL) security check, use the debug ip ospf adj command in privileged EXEC mode. To disable debugging output, use the no form of this command.
Examples
The following is sample output from the debug ip ospf adjcommand:
Router# debug ip ospf adj
Jan 31 00:13:05.175: OSPF: Drop packet on Serial2/0 from 10.1.1.1 with TTL: 1
Mar 27 23:15:03.175: OSPF Drop packet on OSPF_VL0 from 10.1.1.100 with TTL: 253
Information in the output includes the day and time the packet was dropped, protocol name, interface on which the packet was dropped, neighbor address, and TTL hop count.
debug ip ospf database-timer rate-limit
To display when link-state advertisement (LSA) rate-limiting timers will expire, use the debug ip ospf database-timer rate-limitcommand in privileged EXEC mode.
Usage Guidelines
Use this command if you need to see when the timers will expire per LSA. Use an access list if you want to limit the output.
Examples
The following is sample output from the debug ip ospf database-timer rate-limit command for an example configuration that includes the timers throttle lsa all 100 10000 45000 command. Comments are inserted to explain the preceding output.
Router# debug ip ospf database-timer rate-limit
OSPF rate limit timer events debugging is on
*Mar 12 20:18:20.383:OSPF:Starting rate limit timer for 10.10.24.4
10.10.24.4 1 with 100ms delay
The interface is shut down, which causes OSPF to generate a new router LSA. The system starts a timer for 100 milliseconds.
*Mar 12 20:18:20.495:OSPF:Rate limit timer is expired for 10.10.24.4
10.10.24.4 1
The rate limit timer is expired after 100 milliseconds (a small delta is added to the timer).
*Mar 12 20:18:20.495:OSPF:For next LSA generation - wait :10000ms next:
20000ms
*Mar 12 20:18:20.495:OSPF:Build router LSA for area 24, router ID
10.10.24.4, seq 0x80000003
The system will generate update a router LSA after the timer expires.
debug ip ospf events
To display information on Open Shortest Path First (OSPF)-related events, such as adjacencies, flooding information, designated router selection, and shortest path first (SPF) calculation, use the debug ip ospf events command in privileged EXEC mode. To disable debugging output, use the no form of this command.
Examples
The following is sample output from the debug ip ospf events command:
Router# debug ip ospf events
OSPF:hello with invalid timers on interface Ethernet0
hello interval received 10 configured 10
net mask received 255.255.255.0 configured 255.255.255.0
dead interval received 40 configured 30
The debug ip ospf events output shown might appear if any of the following situations occurs:
- The IP subnet masks for routers on the same network do not match.
- The OSPF hello interval for the router does not match that configured for a neighbor.
- The OSPF dead interval for the router does not match that configured for a neighbor.
If a router configured for OSPF routing is not seeing an OSPF neighbor on an attached network, perform the following tasks:
- Make sure that both routers have been configured with the same IP mask, OSPF hello interval, and OSPF dead interval.
- Make sure that both neighbors are part of the same area type.
In the following example line, the neighbor and this router are not part of a stub area (that is, one is a part of a transit area and the other is a part of a stub area, as explained in RFC 1247):
OSPF: hello packet with mismatched E bitdebug ip ospf mpls traffic-eng advertisements
To print information about traffic engineering advertisements in Open Shortest Path First (OSPF) link state advertisement (LSA) messages, use the debug ip ospf mpls traffic-eng advertisements command in privileged EXEC mode. To disable debugging output, use the no form of this command.
Command History
Release
Modification
12.0(5)ST
This command was introduced.
12.1(3)T
This command was integrated into Cisco IOS Release 12.1(3)T.
12.0(22)S
This command was integrated into Cisco IOS Release 12.0(22)S.
12.2(28)SB
This command was integrated into Cisco IOS Release 12.2(28)SB.
12.2(33)SRA
This command was integrated into Cisco IOS Release 12.2(33)SRA.
Examples
In the following example, information about traffic engineering advertisements is printed in OSPF LSA messages:
Router# debug ip ospf mpls traffic-eng advertisements
OSPF:IGP delete router node 10.106.0.6 fragment 0 with 0 links
      TE Router ID 10.106.0.6
OSPF:IGP update router node 10.110.0.10 fragment 0 with 0 links
      TE Router ID 10.110.0.10
OSPF:MPLS announce router node 10.106.0.6 fragment 0 with 1 links
      Link connected to Point-to-Point network
      Link ID :10.110.0.10
      Interface Address :10.1.0.6
      Neighbor Address :10.1.0.10
      Admin Metric :10
      Maximum bandwidth :1250000
      Maximum reservable bandwidth :625000
      Number of Priority :8
      Priority 0 :625000      Priority 1 :625000
      Priority 2 :625000      Priority 3 :625000
      Priority 4 :625000      Priority 5 :625000
      Priority 6 :625000      Priority 7 :625000
      Affinity Bit :0x0
The table below describes the significant fields shown in the display.
Table 20 debug ip ospf mpls traffic-eng advertisements Field Descriptions Field
Description
Link ID
Index of the link being described.
Interface Address
Address of the interface.
Neighbor Address
Address of the neighbor.
Admin Metric
Administrative weight associated with this link.
Maximum bandwidth
Bandwidth capacity of the link (kbps).
Maximum reservable bandwidth
Amount of reservable bandwidth on this link.
Number of Priority
Number of priority levels for which bandwidth is advertised.
Priority
Bandwidth available at indicated priority level.
Affinity Bit
Attribute flags of the link that are being flooded.
debug ip ospf nsf
To display debugging messages about Open Shortest Path First (OSPF) during a Cisco nonstop forwarding (NSF) restart, use the debug ip ospf nsf command in privileged EXEC mode. To disable the display of debugging output, use the no form of this command.
Command History
Release
Modification
12.0(22)S
This command was introduced.
12.2(18)S
This command was integrated into Cisco IOS Release 12.2(18)S.
12.2(20)S
Support for the Cisco 7304 router was added.
12.2(28)SB
This command was integrated into Cisco IOS Release 12.2(28)SB.
12.2(33)SRA
This command was integrated into Cisco IOS Release 12.2(33)SRA.
12.2(33)SXH
This command was integrated into Cisco IOS Release 12.2(33)SXH.
Usage Guidelines
Use the debug ip ospf nsf command to diagnose problems with OSPF link-state database (LSDB) resynchronization and NSF operations.
debug ip ospf packet
To display information about each Open Shortest Path First (OSPF) packet received, use the debug ip ospf packet command in privileged EXEC mode. To disable debugging output, use the no form of this command.
Examples
The following is sample output from the debug ip ospf packet command:
Router# debug ip ospf packet
OSPF: rcv. v:2 t:1 l:48 rid:200.0.0.117
      aid:0.0.0.0 chk:6AB2 aut:0 auk:
The debug ip ospf packet command produces one set of information for each packet received. The output varies slightly depending on which authentication is used. The following is sample output from the debug ip ospf packet command when message digest algorithm 5 (MD5) authentication is used.
Router# debug ip ospf packet
OSPF: rcv. v:2 t:1 l:48 rid:200.0.0.116
      aid:0.0.0.0 chk:0 aut:2 keyid:1 seq:0x0
The table below describes the significant fields shown in the display.
Table 21 debug ip ospf packet Field Descriptions Field
Description
v:
OSPF version.
t:
OSPF packet type. Possible packet types follow:
l:
OSPF packet length in bytes.
rid:
OSPF router ID.
aid:
OSPF area ID.
chk:
OSPF checksum.
aut:
OSPF authentication type. Possible authentication types follow:
keyid:
MD5 key ID.
seq:
Sequence number.
debug ip ospf rib
To display debugging information for Open Shortest Path First (OSPF) Version 2 routes in the global or local Routing Information Base (RIB), use the debug ip ospf ribcommand in privileged EXEC mode. To disable the debugging of OSPF Version 2 routes, use the no form of this command.
debug ip ospf rib [ local | [ redistribution | global [access-list-number] ] ] [detail]
no debug ip ospf rib [ local | [ redistribution | global [access-list-number] ] ] [detail]
Syntax Description
local
(Optional) Displays debugging information for OSPF Version 2 routes in the local RIB.
redistribution
(Optional) Displays debugging information about redistributed OSPF Version 2 routes.
global
(Optional) Displays debugging information for OSPF Version 2 routes in the global RIB.
access-list-number
(Optional) Number of an access list. This is a decimal number from 1 to 199 or from 1300 to 2699.
detail
(Optional) Displays more detailed debug information.
Command History
Release
Modification
12.4(15)T
This command was introduced.
12.2(33)SRC
This command was integrated into Cisco IOS Release 12.2(33)SRC.
12.2(33)SB
This command was integrated into the Cisco IOS 12.2(33)SB release.
12.2SX
This command is supported in the Cisco IOS Release 12.2SX train. Support in a specific 12.2SX release of this train depends on your feature set, platform, and platform hardware.
Usage Guidelines
You can use the output from the debug ip ospf rib command to learn about the function of the local RIB and the interaction between the route redistribution process and the global RIB. For example, you can learn why the routes that OSPF placed in the global RIB are not the same ones that you anticipated.
A Cisco Technical Assistance Center representative may ask you to turn on debugging using the debug ip ospf rib command as part of troubleshooting a problem.
To monitor updates from the OSPF database to the OSPF local RIB, use the local keyword, and to monitor updates from the OSPF database to the OSPF global RIB, use the global keyword.
It is highly recommended that you limit the debugging output to information specific to the IP prefix that is associated with a specific access list by entering the access-list-number argument.
Examples
The following is sample output from the debug ip ospf ribcommand with the access-list-number argument used in order to limit the debugging output to information specific to the IP prefix that is associated with the specific access list 1:
Router# show running-config | include access-list 1 access-list 112 permit 10.1.1.0 0.0.0.255 ! access-list 1 is configured Router# debug ip ospf rib local detail 1 *May 31 21:28:17.331: OSPF-RIB-LOCAL: Delete intra-area connected route 192.168.130.2/255.255.255.0, area 1, dist 10, for interface Ethernet0/0.1 *May 31 21:28:17.331: OSPF-RIB-LOCAL: Local RIB process OSPF-1 Router clear *May 31 21:28:17.331: OSPF-RIB-LOCAL: Add intra-area connected route 192.168.130.2/255.255.255.0, area 1, dist 10, for interface Ethernet0/0.1 . . .debug ip ospf spf statistic
To display statistical information while running the shortest path first (SPF) algorithm, use the debug ip ospf spf statisticcommand in privileged EXEC mode. To disable the debugging output, use the no form of this command.
Usage Guidelines
The debug ip ospf spf statistic command displays the SPF calculation times in milliseconds, the node count, and a time stamp.
Examples
The following is sample output from the debug ip ospf spf statisticcommand:
Router# debug ip ospf spf statistic
00:05:59:	OSPF:	Begin SPF at 359.216ms, process time 60ms
00:05:59:	spf_time 00:05:59.216, wait_interval 0s
00:05:59:	OSPF:	End SPF at 359.216ms, Total elapsed time 0ms
00:05:59:	Intra: 0ms, Inter: 0ms, External: 0ms
00:05:59:	R: 4, N: 2, Stubs: 1
00:05:59:	SN: 1, SA: 0, X5: 1, X7: 0
00:05:59:	SPF suspends: 0 intra, 1 total
The table below describes the significant fields shown in the display.
Table 22 debug ip ospf spf statistic Field Descriptions Field
Description
Begin SPF at
Absolute time in milliseconds when SPF is started.
process time
Cumulative time since the process has been created.
spf_time
Last time SPF was run or an event has happened to run SPF.
wait_interval
Time waited to run SPF.
End SPF at
Absolute time in milliseconds when SPF had ended.
Total elapsed time
Total time take to run SPF.
Intra:
Time taken to process intra-area link-state advertisements (LSAs).
Inter:
Time taken to process interarea LSAs.
External:
Time taken to process external LSAs.
R:
Number of router LSAs.
N:
Number of network LSAs.
Stubs:
Number of stub links.
SN:
Number of summary network LSAs.
SA:
Number of summary LSAs describing autonomous system boundary routers (ASBRs).
X5:
Number of external type 5 LSAs.
X7:
Number of external type 7 LSAs.
SPF suspends: intra
Number of times process is suspended during intra-area SPF run.
total
Total number of times process is suspended during SPF run.
debug ip packet
To display general IP debugging information and IP security option (IPSO) security transactions, use the debug ip packet command in privileged EXEC mode. To disable debugging output, use the no form of this command.
Syntax Description
access-list-number
(Optional) The IP access list number that you can specify. If the datagram is not permitted by that access list, the related debugging output is suppressed. Standard, extended, and expanded access lists are supported. The range of standard and extended access lists is from 1 to 199. The range of expanded access lists is from 1300 to 2699.
detail
(Optional) Displays detailed IP packet debugging information. This information includes the packet types and codes as well as source and destination port numbers.
dump
(Hidden) Displays IP packet debugging information along with raw packet data in hexadecimal and ASCII forms. This keyword can be enabled with individual access lists and also with the detail keyword.
Note The dump keyword is not fully supported and should be used only in collaboration with Cisco Technical Support. See the caution notes below, in the usage guidelines, for more specific information.
Usage Guidelines
If a communication session is closing when it should not be, an end-to-end connection problem can be the cause. The debug ip packet command is useful for analyzing the messages traveling between the local and remote hosts. IP packet debugging captures the packets that are process switched including received, generated and forwarded packets. IP packets that are switched in the fast path are not captured.
IPSO security transactions include messages that describe the cause of failure each time a datagram fails a security test in the system. This information is also sent to the sending host when the router configuration allows it.
Caution
Because the debug ip packet command generates a substantial amount of output and uses a substantial amount of system resources, this command should be used with caution in production networks. It should only be enabled when traffic on the IP network is low, so other activity on the system is not adversely affected. Enabling the detail and dump keywords use the highest level of system resources of the available configuration options for this command, so a high level of caution should be applied when enabling either of these keywords.
Caution
The dump keyword is not fully supported and should be used only in collaboration with Cisco Technical Support. Because of the risk of using significant CPU utilization, the dump keyword is hidden from the user and cannot be seen using the “?” prompt. The length of the displayed packet information may exceed the actual packet length and include additional padding bytes that do not belong to the IP packet. Also note that the beginning of a packet may start at different locations in the dump output depending on the specific router, interface type, and packet header processing that may have occurred before the output is displayed.
Examples
The following is sample output from the debug ip packet command:
Router# debug ip packet
IP packet debugging is on
IP: s=172.69.13.44 (Fddi0), d=10.125.254.1 (Serial2), g=172.69.16.2, forward
IP: s=172.69.1.57 (Ethernet4), d=10.36.125.2 (Serial2), g=172.69.16.2, forward
IP: s=172.69.1.6 (Ethernet4), d=255.255.255.255, rcvd 2
IP: s=172.69.1.55 (Ethernet4), d=172.69.2.42 (Fddi0), g=172.69.13.6, forward
IP: s=172.69.89.33 (Ethernet2), d=10.130.2.156 (Serial2), g=172.69.16.2, forward
IP: s=172.69.1.27 (Ethernet4), d=172.69.43.126 (Fddi1), g=172.69.23.5, forward
IP: s=172.69.1.27 (Ethernet4), d=172.69.43.126 (Fddi0), g=172.69.13.6, forward
IP: s=172.69.20.32 (Ethernet2), d=255.255.255.255, rcvd 2
IP: s=172.69.1.57 (Ethernet4), d=10.36.125.2 (Serial2), g=172.69.16.2, access denied
The output shows two types of messages that the debug ip packet command can produce; the first line of output describes an IP packet that the router forwards, and the third line of output describes a packet that is destined for the router. In the third line of output, rcvd 2 indicates that the router decided to receive the packet.
The table below describes the significant fields shown in the display.
Table 23 debug ip packet Field Descriptions Field
Description
IP:
Indicates that this is an IP packet.
s=172.69.13.44 (Fddi0)
Indicates the source address of the packet and the name of the interface that received the packet.
d=10.125.254.1 (Serial2)
Indicates the destination address of the packet and the name of the interface (in this case, S2) through which the packet is being sent out on the network.
g=172.69.16.2
Indicates the address of the next-hop gateway.
forward
Indicates that the router is forwarding the packet. If a filter denies a packet, “access denied” replaces “forward,” as shown in the last line of output.
The following is sample output from the debug ip packet command enabled with the detail keyword:
Router# debug ip packet detail

IP packet debugging is on (detailed)
001556: 19:59:30: CEF: Try to CEF switch 10.4.9.151 from FastEthernet0/0
001557: 19:59:30: IP: s=10.4.9.6 (FastEthernet0/0), d=10.4.9.151 (FastEthernet03
001558: 19:59:30:     TCP src=179, dst=11001, seq=3736598846, ack=2885081910, wH
001559: 20:00:09: CEF: Try to CEF switch 10.4.9.151 from FastEthernet0/0
001560: 20:00:09: IP: s=10.4.9.4 (FastEthernet0/0), d=10.4.9.151 (FastEthernet03
001561: 20:00:09:     TCP src=179, dst=11000, seq=163035693, ack=2948141027, wiH
001562: 20:00:14: CEF: Try to CEF switch 10.4.9.151 from FastEthernet0/0
001563: 20:00:14: IP: s=10.4.9.6 (FastEthernet0/0), d=10.4.9.151 (FastEthernet03
001564: 20:00:14:     ICMP type=8, code=0
001565: 20:00:14: IP: s=10.4.9.151 (local), d=10.4.9.6 (FastEthernet0/0), len 1g
001566: 20:00:14:     ICMP type=0, code=0
The format of the output with detail keywordprovides additional information, such as the packet type, code, some field values, and source and destination port numbers.
The table below describes the significant fields shown in the display.
Table 24 debug ip packet detail Field Descriptions Field
Description
CEF:
Indicates that the IP packet is being processed by CEF.
IP:
Indicates that this is an IP packet.
s=10.4.9.6 (FastEthernet0/0)
Indicates the source address of the packet and the name of the interface that received the packet.
d=10.4.9.151 (FastEthernet03)
Indicates the destination address of the packet and the name of the interface through which the packet is being sent out on the network.
TCP src=
Indicates the source TCP port number.
dst=
Indicates the destination TCP port number.
seq=
Value from the TCP packet sequence number field.
ack=
Value from the TCP packet acknowledgement field.
ICMP type=
Indicates ICMP packet type.
code=
Indicates ICMP return code.
The following is sample output from the debug ip packet command enabled with the dump keyword:
Router# debug ip packet dump
IP packet debugging is on (detailed) (dump)
21:02:42: IP: s=10.4.9.6 (FastEthernet0/0), d=10.4.9.4 (FastEthernet0/0), len 13
07003A00:                       0005 00509C08            ...P..
07003A10: 0007855B 4DC00800 45000064 001E0000  ...[M@..E..d....
07003A20: FE019669 0A040906 0A040904 0800CF7C  ~..i..........O|
07003A30: 0D052678 00000000 0A0B7145 ABCDABCD  ..&x......qE+M+M
07003A40: ABCDABCD ABCDABCD ABCDABCD ABCDABCD  +M+M+M+M+M+M+M+M
07003A50: ABCDABCD ABCDABCD ABCDABCD ABCDABCD  +M+M+M+M+M+M+M+M
07003A60: ABCDABCD ABCDABCD ABCDABCD ABCDABCD  +M+M+M+M+M+M+M+M
07003A70: ABCDABCD ABCDABCD ABCDABCD           +M+M+M+M+M+M
21:02:42: IP: s=10.4.9.4 (local), d=10.4.9.6 (FastEthernet0/0), len 100, sending
07003A00:                       0005 00509C08            ...P..
07003A10: 0007855B 4DC00800 45000064 001E0000  ...[M@..E..d....
07003A20: FF019569 0A040904 0A040906 0000D77C  ...i..........W|
07003A30: 0D052678 00000000 0A0B7145 ABCDABCD  ..&x......qE+M+M
07003A40: ABCDABCD ABCDABCD ABCDABCD ABCDABCD  +M+M+M+M+M+M+M+M
07003A50: ABCDABCD ABCDABCD ABCDABCD ABCDABCD  +M+M+M+M+M+M+M+M
07003A60: ABCDABCD ABCDABCD ABCDABCD ABCDABCD  +M+M+M+M+M+M+M+M
07003A70: ABCDABCD ABCDABCD ABCDABCD           +M+M+M+M+M+M
21:02:42: CEF: Try to CEF switch 10.4.9.4 from FastEthernet0/0
21:02:42: IP: s=10.4.9.6 (FastEthernet0/0), d=10.4.9.4 (FastEthernet0/0), len 13
07003380:                       0005 00509C08            ...P..
07003390: 0007855B 4DC00800 45000064 001F0000  ...[M@..E..d....
070033A0: FE019668 0A040906 0A040904 0800CF77  ~..h..........Ow
070033B0: 0D062678 00000000 0A0B7149 ABCDABCD  ..&x......qI+M+M
070033C0: ABCDABCD ABCDABCD ABCDABCD ABCDABCD  +M+M+M+M+M+M+M+M
070033D0: ABCDABCD ABCDABCD ABCDABCD ABCDABCD  +M+M+M+M+M+M+M+M
070033E0: ABCDABCD ABCDABCD ABCDABCD ABCDABCD  +M+M+M+M+M+M+M+M
070033F0: ABCDABCD ABCDABCD ABCDABCD           +M+M+M+M+M+M
NoteThe dump keyword is not fully supported and should be used only in collaboration with Cisco Technical Support. See the caution in the usage guidelines section of this command reference page for more specific information.
The output from the debug ip packet command, when the dump keyword is enabled, provides raw packet data in hexadecimal and ASCII forms. This addtional output is displayed in addition to the standard output. The dump keyword can be used with all of the available configuration options of this command.
The table below describes the significant fields shown in the display.
Table 25 debug ip packet dump Field Descriptions Field
Description
IP:
Indicates that this is an IP packet.
s=10.4.9.6 (FastEthernet0/0)
Indicates the source address of the packet and the name of the interface that received the packet.
d=10.4.9.4 (FastEthernet0/0) len 13
Indicates destination address and length of the packet and the name of the interface through which the packet is being sent out on the network.
sending
Indicates that the router is sending the packet.
The calculation on whether to send a security error message can be somewhat confusing. It depends upon both the security label in the datagram and the label of the incoming interface. First, the label contained in the datagram is examined for anything obviously wrong. If nothing is wrong, assume the datagram to be correct. If something is wrong, the datagram is treated as unclassified genser . Then the label is compared with the interface range, and the appropriate action is taken, as the table below describes.
Table 26 Security Actions Classification
Authorities
Action Taken
Too low
Too low
Good
Too high
No Response
No Response
No Response
In range
Too low
Good
Too high
No Response
Accept
Send Error
Too high
Too low
In range
Too high
No Response
Send Error
Send Error
The security code can only generate a few types of Internet Control Message Protocol (ICMP) error messages. The only possible error messages and their meanings follow:
- ICMP Parameter problem, code 0--Error at pointer
- ICMP Parameter problem, code 1--Missing option
- ICMP Parameter problem, code 2--See Note that follows
- ICMP Unreachable, code 10--Administratively prohibited
NoteThe message “ICMP Parameter problem, code 2” identifies a specific error that occurs in the processing of a datagram. This message indicates that the router received a datagram containing a maximum length IP header but no security option. After being processed and routed to another interface, it is discovered that the outgoing interface is marked with “add a security label.” Because the IP header is already full, the system cannot add a label and must drop the datagram and return an error message.
When an IP packet is rejected due to an IP security failure, an audit message is sent via Department of Defense Intelligence Information System Network Security for Information Exchange (DNSIX) Network Address Translation (NAT). Also, any debug ip packet output is appended to include a description of the reason for rejection. This description can be any of the following:
- No basic
- No basic, no response
- Reserved class
- Reserved class, no response
- Class too low, no response
- Class too high
- Class too high, bad authorities, no response
- Unrecognized class
- Unrecognized class, no response
- Multiple basic
- Multiple basic, no response
- Authority too low, no response
- Authority too high
- Compartment bits not dominated by maximum sensitivity level
- Compartment bits do not dominate minimum sensitivity level
- Security failure: extended security disallowed
- NLESO source appeared twice
- ESO source not found
- Postroute, failed xfc out
- No room to add IPSO
debug ip pgm host
NoteSupport for the PGM Host feature has been removed. Use of this command is not recommended.
To display debug messages for the Pragmatic General Multicast (PGM) Host feature, use the debug ip pgm host command in privileged EXEC mode. To disable debugging output, use the no form of this command.
Syntax Description
data
(Optional) Enables debugging for PGM sent (ODATA) and re-sent (RDATA) data packets.
nak
(Optional) Enables debugging for PGM negative acknowledgment (NAK) data packets, NAK confirmation (NCF) data packets, and Null NAK (NNAK) data packets.
spm
(Optional) Enables debugging for PGM source path messages (SPMs).
Command Default
Debugging for PGM Host is not enabled. If the debug ip pgm host command is used with no additional keywords, debugging is enabled for all PGM Host message types.
Examples
The following is sample output from the debug ip pgm host command:
Router# debug ip pgm host

Host SPM debugging is on
Host NAK/NCF debugging is on
Host ODATA/RDATA debugging is on
The following is sample output from the debug ip pgm host command when the data keyword is used:
Router# debug ip pgm host data

02:50:23:PGM Host:Received ODATA from 10.0.30.2 to 224.3.3.3 (74 bytes)
02:50:23:     ODATA TSI 00000A001E02-0401 data-dport BBBB csum 9317 tlen 74
02:50:23:     tsqn         31 dsqn         39
The following example shows output of the debug ip pgm hostcommand when the nak keyword is used. In the following example, the host sends a NAK to the source for a missing packet and the source returns an NCF to the host followed by an RDATA data packet.
Router# debug ip pgm host nak

02:50:24:PGM Host:Sending NAK from 10.0.32.2 to 10.0.32.1 (36 bytes)
02:50:24:     NAK TSI 00000A001E02-0401 data-dport BBBB csum 04EC tlen 36
02:50:24:     dsqn         38 data source 10.0.30.2 group 224.3.3.3
02:50:24:PGM Host:Received NCF from 10.0.30.2 to 224.3.3.3 (36 bytes)
02:50:24:     NCF TSI 00000A001E02-0401 data-dport BBBB csum 02EC tlen 36
02:50:24:     dsqn         38 data source 10.0.30.2 group 224.3.3.3
02:50:24:PGM Host:Received RDATA from 10.0.30.2 to 224.3.3.3 (74 bytes)
02:50:24:     RDATA TSI 00000A001E02-0401 data-dport BBBB csum 9218 tlen 74
02:50:24:     tsqn         31 dsqn         38
The following is sample output from the debug ip pgm host command with the spm keyword is used:
Router# debug ip pgm host spm
02:49:39:PGM Host:Received SPM from 10.0.30.2 to 224.3.3.3 (36 bytes)
02:49:39:     SPM TSI 00000A001E02-0401 data-dport BBBB csum EA08 tlen 36
02:49:39:     dsqn        980 tsqn         31 lsqn         31   NLA 10.0.32.1
Related Commands
Command
Description
clear ip pgm host
Resets PGM Host connections to their default values and clears traffic statistics.
ip pgm host
Enables the PGM Host feature.
show ip pgm host defaults
Displays the default values for PGM Host traffic.
show ip pgm host sessions
Displays open PGM Host traffic sessions.
show ip pgm host traffic
Displays PGM Host traffic statistics.
debug ip pgm router
To display debug messages for Pragmatic General Multicast (PGM), use the debug ip pgm routercommand in privileged EXEC mode. To disable debugging output, use the no form of this command.
Command Default
Debugging for PGM is not enabled. If the debug ip pgm routercommand is used with no additional keywords, debugging is enabled for all PGM message types.
Examples
The following shows sample output from the debug ip pgm routercommand:
Router# debug ip pgm router
SPM debugging is on
NAK/NNAK/NCF debugging is on
RDATA debugging is on
The following shows sample output from the debug ip pgm routercommand when the spm keyword is used:
Router# debug ip pgm router spm
PGM: Received SPM on Ethernet1/0/5 from 10.7.0.200 to 227.7.7.7 (52 bytes)
     SPM TSI 0A0700C85555-1000 data-dport 1001 csum CCCC tlen 52
     dsqn 3758096779 tsqn       1954 isqn       1979 lsqn       1990
     NLA 10.7.0.200
     SPM from source/RPF-neighbour 10.7.0.200 for 10.7.0.200 (SPT)
     Forwarded SPM from 10.7.0.200 to 227.7.7.7
The following is a debugging message for a selective SPM:
Router# debug ip pgm router spm
PGM: Received SPM on Ethernet1/0/5 from 10.7.0.200 to 234.4.3.2 (52 bytes)
     SPM TSI 0A0700C85555-2000 data-dport 2001 csum CCCC tlen 52    Options  P N O
     dsqn 3758096768 tsqn       1986 isqn       1994 lsqn       2006
     NLA 10.7.0.200
     SPM from source/RPF-neighbour 10.7.0.200 for 10.7.0.200 (SPT)
     Forwarded SPM from 10.7.0.200 to 227.7.7.7
The “P N O” flags indicate which options are present in this packet:
- P indicates that this is a parity packet.
- N indicates that options are network significant.
- O indicates that options are present.
The following shows sample output from the debug ip pgm routercommand when the nak keyword is used:
Router# debug ip pgm router nak
PGM: Received NAK on Ethernet1/0/0 from 10.1.0.4 to 10.1.0.2 (36 bytes)
     NAK TSI 0A0700C85555-1000 data-dport 1001 csum CCCC tlen 36
     dsqn       1990 data source 10.7.0.200 group 227.7.7.7
     NAK unicast routed to RPF neighbour 10.4.0.1
     Forwarding NAK from 10.1.0.4 to 10.4.0.1 for 10.7.0.200
PGM: Received NCF on Ethernet1/0/5 from 10.7.0.200 to 227.7.7.7 (36 bytes)
     NCF TSI 0A0700C85555-1000 data-dport 1001 csum CACC tlen 36
     dsqn       1990 data source 10.7.0.200 group 227.7.7.7
     NAK retx canceled for TSI 0A0700C85555-1000 dsqn       1990
     NAK elimination started for TSI 0A0700C85555-1000 dsqn       1990
PGM: Received NCF on Ethernet1/0/5 from 10.7.0.200 to 227.7.7.7 (36 bytes)
     NCF TSI 0A0700C85555-1000 data-dport 1001 csum CACC tlen 36
     dsqn       1991 data source 10.7.0.200 group 227.7.7.7
     No NAK retx outstanding for TSI 0A0700C85555-1000 dsqn       1991
     NAK anticipated for TSI 0A0700C85555-1000 dsqn       1991
The following example shows output of the debug ip pgm routercommand with the datakeyword. The debugging message is for an RDATA packet for which the router has only anticipated state, sqn 1991. Because it did not actually get a NAK, this RDATA is not forwarded by the PGM router.
Router# debug ip pgm router data PGM: Received RDATA on Ethernet1/0/5 from 10.7.0.200 to 227.7.7.7 (70 bytes) RDATA TSI 0A0700C85555-1000 data-dport 1001 csum CCCC tlen 32 tsqn 1954 dsqn 1990 Marking Ethernet1/0/0 for forwarding Marking Serial5/0 for skipping Forwarded RDATA from 10.7.0.200 to 227.7.7.7 Debug message for RDATA packet corresponding to a NAK for sqn 1990. Since the NAK was received on Ethernet1/0/0, RDATA is forwarded out only that interface and another interface in the multicast olist Serial5/0 is skipped. PGM: Received RDATA on Ethernet1/0/5 from 10.7.0.200 to 227.7.7.7 (70 bytes) RDATA TSI 0A0700C85555-1000 data-dport 1001 csum CCCC tlen 32 tsqn 1954 dsqn 1991 Eliminated RDATA (null oif) from 10.7.0.200 to 227.7.7.7debug ip pim
To display Protocol Independent Multicast (PIM) packets received and sent, and to display PIM-related events, use the debug ip pimcommand in privileged EXEC mode. To disable debugging output, use the no form of this command.
debug ip pim [ vrf vrf-name ] [ group-address | atm | auto-rp | bsr | df [rp-address] | hello | tag ]
no debug ip pim [ vrf vrf-name ] [ group-address | atm | auto-rp | bsr | df [rp-address] | hello | tag ]
Syntax Description
vrf vrf-name
(Optional) Displays PIM-related events associated with the Multicast Virtual Private Network (MVPN) routing and forwarding (MVRF) instance specified for the vrf-name argument.
group-address
(Optional) IP address or Domain Name System (DNS) name of a multicast group. Entering a multicast group address restricts the output to display only PIM-related events associated with the multicast group address specified for the optional group-address argument.
atm
(Optional) Displays PIM ATM signaling activity.
auto-rp
(Optional) Displays the contents of each PIM packet used in the automatic discovery of group-to-rendezvous point (RP) mapping and the actions taken on the address-to-RP mapping database.
bsr
(Optional) Displays candidate-RPs and Bootstrap Router (BSR) activity.
df
(Optional) When bidirectional PIM is used, displays all designated forwarder (DF) election messages.
rp-address
(Optional) The rendezvous point IP address.
hello
(Optional) Displays events associated with PIM hello messages.
tag
(Optional) Displays tag-switching-related activity.
Command History
Release
Modification
10.2
This command was introduced.
11.1
The auto-rp keyword was added.
11.3
The atm and tag keywords were added.
12.1(2)T
The df keyword was added.
12.1(3)T
The bsr keyword was added.
12.0(22)S
The vrf keyword, vrf-name argument, and hello keyword were added.
12.2(13)T
The vrf keyword and vrf-name argument were added.
12.2(14)S
This command was integrated into Cisco IOS Release 12.2(14)S.
12.2(15)T
The hello keyword was added.
12.2(28)SB
This command was integrated into Cisco IOS Release 12.2(28)SB.
12.2(33)SRA
This command was integrated into Cisco IOS Release 12.2(33)SRA.
12.2(33)SXH
This command was integrated into Cisco IOS Release 12.2(33)SXH.
Usage Guidelines
PIM uses Internet Group Management Protocol (IGMP) packets to communicate with routers and advertise reachability information.
Use this command with the debug ip igmp and debug ip mrouting commands to display additional multicast routing information.
Examples
The following is sample output from the debug ip pim command:
Router# debug ip pim 224.2.0.1

PIM: Received Join/Prune on Ethernet1 from 172.16.37.33
PIM: Received Join/Prune on Ethernet1 from 172.16.37.33
PIM: Received Join/Prune on Tunnel0 from 10.3.84.1
PIM: Received Join/Prune on Ethernet1 from 172.16.37.33
PIM: Received Join/Prune on Ethernet1 from 172.16.37.33
PIM: Received RP-Reachable on Ethernet1 from 172.16.20.31
PIM: Update RP expiration timer for 224.2.0.1
PIM: Forward RP-reachability packet for 224.2.0.1 on Tunnel0
PIM: Received Join/Prune on Ethernet1 from 172.16.37.33
PIM: Prune-list (10.221.196.51/32, 224.2.0.1)
PIM: Set join delay timer to 2 seconds for (10.221.0.0/16, 224.2.0.1) on Ethernet1
PIM: Received Join/Prune on Ethernet1 from 172.16.37.6
PIM: Received Join/Prune on Ethernet1 from 172.16.37.33
PIM: Received Join/Prune on Tunnel0 from 10.3.84.1
PIM: Join-list: (*, 224.2.0.1) RP 172.16.20.31
PIM: Add Tunnel0 to (*, 224.2.0.1), Forward state
PIM: Join-list: (10.0.0.0/8, 224.2.0.1)
PIM: Add Tunnel0 to (10.0.0.0/8, 224.2.0.1), Forward state
PIM: Join-list: (10.4.0.0/16, 224.2.0.1)
PIM: Prune-list (172.16.84.16/28, 224.2.0.1) RP-bit set RP 172.16.84.16
PIM: Send Prune on Ethernet1 to 172.16.37.6 for (172.16.84.16/28, 224.2.0.1), RP
PIM: For RP, Prune-list: 10.9.0.0/16
PIM: For RP, Prune-list: 10.16.0.0/16
PIM: For RP, Prune-list: 10.49.0.0/16
PIM: For RP, Prune-list: 10.84.0.0/16
PIM: For RP, Prune-list: 10.146.0.0/16
PIM: For 10.3.84.1, Join-list: 172.16.84.16/28
PIM: Send periodic Join/Prune to RP via 172.16.37.6 (Ethernet1)
The following lines appear periodically when PIM is running in sparse mode and indicate to this router the multicast groups and multicast sources in which other routers are interested:
PIM: Received Join/Prune on Ethernet1 from 172.16.37.33
PIM: Received Join/Prune on Ethernet1 from 172.16.37.33
The following lines appear when a rendezvous point (RP) message is received and the RP timer is reset. The expiration timer sets a checkpoint to make sure the RP still exists. Otherwise, a new RP must be discovered.
PIM: Received RP-Reachable on Ethernet1 from 172.16.20.31
PIM: Update RP expiration timer for 224.2.0.1
PIM: Forward RP-reachability packet for 224.2.0.1 on Tunnel0
The prune message in the following line states that this router is not interested in the Source-Active (SA) information. This message tells an upstream router to stop forwarding multicast packets from this source. The address 10.221.196.51/32 indicates a host route with 32 bits of mask.
PIM: Prune-list (10.221.196.51/32, 224.2.0.1)In the following line, a second router on the network wants to override the prune message that the upstream router just received. The timer is set at a random value so that if additional routers on the network still want to receive multicast packets for the group, only one will actually send the message. The other routers will receive the join message and then suppress sending their own message.
PIM: Set join delay timer to 2 seconds for (10.221.0.0/16, 224.2.0.1) on Ethernet1In the following line, a join message is sent toward the RP for all sources:
PIM: Join-list: (*, 224.2.0.1) RP 172.16.20.31In the following lines, the interface is being added to the outgoing interface (OIF) of the (*, G) and (S, G) multicast route (mroute) table entry so that packets from the source will be forwarded out that particular interface:
PIM: Add Tunnel0 to (*, 224.2.0.1), Forward state
PIM: Add Tunnel0 to (10.0.0.0/8, 224.2.0.1), Forward state
The following line appears in sparse mode only. There are two trees on which data may be received: the RP tree and the source tree. In dense mode there is no RP. After the source and the receiver have discovered one another at the RP, the first-hop router for the receiver will usually join to the source tree rather than the RP tree.
PIM: Prune-list (172.16.84.16/28, 224.2.0.1) RP-bit set RP 172.16.84.16The send prune message in the next line shows that a router is sending a message to a second router saying that the first router should no longer receive multicast packets for the (S, G). The RP at the end of the message indicates that the router is pruning the RP tree and is most likely joining the source tree, although the router may not have downstream members for the group or downstream routers with members of the group. The output shows the specific sources from which this router no longer wants to receive multicast messages.
PIM: Send Prune on Ethernet1 to 172.16.37.6 for (172.16.84.16/28, 224.2.0.1), RPThe following lines indicate that a prune message is sent toward the RP so that the router can join the source tree rather than the RP tree:
PIM: For RP, Prune-list: 10.9.0.0/16
PIM: For RP, Prune-list: 10.16.0.0/16
PIM: For RP, Prune-list: 10.49.0.0/16
In the following line, a periodic message is sent toward the RP. The default period is once per minute. Prune and join messages are sent toward the RP or source rather than directly to the RP or source. It is the responsibility of the next hop router to take proper action with this message, such as continuing to forward it to the next router in the tree.
PIM: Send periodic Join/Prune to RP via 172.16.37.6 (Ethernet1)Related Commands
Command
Description
debug ip dvmrp
Displays information on DVMRP packets received and sent.
debug ip igmp
Displays IGMP packets received and sent, and displays IGMP host-related events.
debug ip igrp transactions
Displays transaction information on IGRP routing transactions.
debug ip mrouting
Displays changes to the IP multicast routing table.
debug ip sd
Displays all SD announcements received.
debug ip pim atm
To log Protocol Independent Multicast ( PIM) ATM signalling activity, use the debug ip pim atm command in privileged EXEC mode. To disable debugging output, use the no form of this command.
Examples
The following sample output shows a new group being created and the router toward the rendezvous point (RP) opening a new virtual circuit (VC). Because there are now two groups on this router, there are two VCs open, as reflected by the “current count.”
The following is sample output from the debug ip pim atmcommand:
Router# debug ip pim atm
Jan 28 19:05:51: PIM-ATM: Max VCs 200, current count 1
Jan 28 19:05:51: PIM-ATM: Send SETUP on ATM2/0 for 239.254.254.253/171.69.214.43
Jan 28 19:05:51: PIM-ATM: Received CONNECT on ATM2/0 for 239.254.254.253, vcd 19
Jan 28 19:06:35: PIM-ATM: Max VCs 200, current count 2
The table below describes the significant fields shown in the display.
Table 27 debug ip pim atm Field Descriptions Field
Description
Jan 28 19:05:51
Current date and time (in hours:minutes:seconds).
PIM-ATM
Indicates what PIM is doing to set up or monitor an ATM connection (vc).
current count
Current number of open virtual circuits.
The resulting show ip mroute output follows:
Router# show ip mroute 239.254.254.253
IP Multicast Routing Table
Flags: D - Dense, S - Sparse, C - Connected, L - Local, P - Pruned
       R - RP-bit set, F - Register flag, T - SPT-bit set, J - Join SPT
Timers: Uptime/Expires
Interface state: Interface, Next-Hop or VCD, State/Mode
(*, 239.254.254.253), 00:00:04/00:02:53, RP 171.69.214.50, flags: S
  Incoming interface: Ethernet1/1, RPF nbr 171.69.214.50
  Outgoing interface list:
    ATM2/0, VCD 19, Forward/Sparse-Dense, 00:00:04/00:02:52
debug ip pim auto-rp
To display the contents of each Protocol Independent Multicast (PIM) packet used in the automatic discovery of group-to-rendezvous point (RP) mapping and the actions taken on the address-to-RP mapping database, use the debug ip pim auto-rp command in privileged EXEC mode. To disable debugging output, use the no form of this command.
Command History
Release
Modification
11.3
This command was introduced.
12.0(23)S
The vrf keyword and vrf-name argument were added.
12.2(13)T
This command was integrated into Cisco IOS Release 12.2(13)T.
12.2(14)S
This command was integrated into Cisco IOS Release 12.2(14)S.
12.2(27)SBC
This command was integrated into Cisco IOS Release 12.2(27)SBC.
12.2(33)SRA
This command was integrated into Cisco IOS Release 12.2(33)SRA.
Examples
The following is sample output from the debug ip pim auto-rp command:
Router# debug ip pim auto-rp
Auto-RP: Received RP-announce, from 172.16.214.66, RP_cnt 1, holdtime 180 secs
Auto-RP:  update (192.168.248.0/24, RP:172.16.214.66)
Auto-RP: Build RP-Discovery packet
Auto-RP:  Build mapping (192.168.248.0/24, RP:172.16.214.66),
Auto-RP:  Build mapping (192.168.250.0/24, RP:172.16.214.26).
Auto-RP:  Build mapping (192.168.254.0/24, RP:172.16.214.2).
Auto-RP: Send RP-discovery packet (3 RP entries)
Auto-RP: Build RP-Announce packet for 172.16.214.2
Auto-RP:  Build announce entry for (192.168.254.0/24)
Auto-RP: Send RP-Announce packet, IP source 172.16.214.2, ttl 8
The first two lines show a packet received from 172.16.214.66 announcing that it is the RP for the groups in 192.168.248.0/24. This announcement contains one RP address and is valid for 180 seconds. The RP-mapping agent then updates its mapping database to include the new information.
Auto-RP: Received RP-announce, from 172.16.214.66, RP_cnt 1, holdtime 180 secs
Auto-RP:  update (192.168.248.0/24, RP:172.16.214.66)
In the next five lines, the router creates an RP-discovery packet containing three RP mapping entries. The packet is sent to the well-known CISCO-RP-DISCOVERY group address (224.0.1.40).
Auto-RP: Build RP-Discovery packet
Auto-RP:  Build mapping (192.168.248.0/24, RP:172.16.214.66),
Auto-RP:  Build mapping (192.168.250.0/24, RP:172.16.214.26).
Auto-RP:  Build mapping (192.168.254.0/24, RP:172.16.214.2).
Auto-RP: Send RP-discovery packet (3 RP entries)
The final three lines show the router announcing that it intends to be an RP for the groups in 192.168.254.0/24. Only routers inside the scope “ttl 8” receive the advertisement and use the RP for these groups.
Auto-RP: Build RP-Announce packet for 172.16.214.2
Auto-RP:  Build announce entry for (192.168.254.0/24)
Auto-RP: Send RP-Announce packet, IP source 172.16.214.2, ttl 8
The following is sample output from the debug ip pim auto-rp command when a router receives an update. In this example, the packet contains three group-to-RP mappings, which are valid for 180 seconds. The RP-mapping agent then updates its mapping database to include the new information.
Router# debug ip pim auto-rp
Auto-RP: Received RP-discovery, from 172.16.214.17, RP_cnt 3, holdtime 180 secs
Auto-RP:  update (192.168.248.0/24, RP:172.16.214.66)
Auto-RP:  update (192.168.250.0/24, RP:172.16.214.26)
Auto-RP:  update (192.168.254.0/24, RP:172.16.214.2
debug ip policy
To display IP policy routing packet activity, use the debug ip policycommand in privileged EXEC mode. To disable debugging output, use the no form of this command.
Syntax Description
access-list-name
(Optional) The name of the access list. Displays packets permitted by the access list that are policy routed in process level, Cisco Express Forwarding (CEF), and distributed CEF (DCEF) with NetFlow enabled or disabled.
If no access list is specified, information about all policy-matched and policy-routed packets is displayed.
Usage Guidelines
After you configure IP policy routing with the ip policy and route-map commands, use the debug ip policy command to ensure that the IP policy is configured correctly.
Policy routing looks at various parts of the packet and then routes the packet based on certain user-defined attributes in the packet.
The debug ip policy command helps you determine what policy routing is following. It displays information about whether a packet matches the criteria, and if so, the resulting routing information for the packet.
Caution
Because the debug ip policy command generates a substantial amount of output, use it only when traffic on the IP network is low, so other activity on the system is not adversely affected.
Examples
The following is sample output from the debug ip policycommand:
Router# debug ip policy 3
IP: s=30.0.0.1 (Ethernet0/0/1), d=40.0.0.7, len 100,FIB flow policy match
IP: s=30.0.0.1 (Ethernet0/0/1), d=40.0.0.7, len 100,FIB PR flow accelerated!
IP: s=30.0.0.1 (Ethernet0/0/1), d=40.0.0.7, g=10.0.0.8, len 100, FIB policy routed
The table below describes the significant fields shown in the display.
debug ip rbscp
To display general error messages about access list-based Rate-Based Satellite Control Protocol (RBSCP), use the debug ip rbscpcommand in privileged EXEC mode. To disable debug output, use the no form of this command.
debug ip rbscp ack-split
To display information about TCP ACK splitting done in conjunction with Rate-Based Satellite Control Protocol (RBSCP), use the debug ip rbscp ack-splitcommand in privileged EXEC mode. To disable debug output, use the no form of this command.
Examples
The following is sample output from the debug ip rbscp ack-splitcommand when the packets match the access list applied to RBSCP. The output includes the source and destination IP addresses and port numbers, the hexadecimal sequence number, and the cumulative ACK that acknowledges bytes up to that number.
Router# debug ip rbscp ack-split *May 11 02:17:01.407: RBSCP ACK split: 0x662852D0, input FastEthernet1/0 -> output FastEthernet1/1 *May 11 02:17:01.407: RBSCP ACK split: rcvd src 1.1.1.1:38481 -> dst 3.3.3.1:21, cumack 2336109115 *May 11 02:17:01.407: RBSCP ACK split: generated 0x65FC0874 cumack 2336109112 *May 11 02:17:01.407: RBSCP ACK split: generated 0x66762A78 cumack 2336109113 *May 11 02:17:01.407: RBSCP ACK split: generated 0x6676442C cumack 2336109114 *May 11 02:17:01.407: RBSCP ACK split: releasing original ACK 2336109115 *May 11 02:17:01.415: RBSCP process: 0x662852D0 passed access list *May 11 02:17:01.415: RBSCP ACK split: 0x662852D0, input FastEthernet1/0 -> output FastEthernet1/1 *May 11 02:17:01.415: RBSCP ACK split: rcvd src 1.1.1.1:36022 -> dst 3.3.3.1:20240, cumack 4024420742 *May 11 02:17:01.415: RBSCP ACK split: generated 0x65FC1E7C cumack 4024420739 *May 11 02:17:01.415: RBSCP ACK split: generated 0x65FC2980 cumack 4024420740 *May 11 02:17:01.415: RBSCP ACK split: generated 0x65FC3484 cumack 4024420741 *May 11 02:17:01.415: RBSCP ACK split: releasing original ACK 4024420742 *May 11 02:17:01.419: RBSCP process: 0x662852D0 passed access list *May 11 02:17:01.419: RBSCP ACK split: 0x662852D0, input FastEthernet1/0 -> output FastEthernet1/1debug ip rgmp
To log debugging messages sent by a Router-Port Group Management Protocol (RGMP)-enabled router, use the debug ip rgmp command in privileged EXEC mode. To disable debugging outut, use the no form of this command.
Command Default
Debugging for RGMP is not enabled. If the debug ip rgmpcommand is used without arguments, debugging is enabled for all RGMP message types.
Examples
The following shows sample output from the debug ip rgmpcommand:
Router# debug ip rgmp RGMP: Sending a Hello packet on Ethernet1/0 RGMP: Sending a Join packet on Ethernet1/0 for group 224.1.2.3 RGMP: Sending a Leave packet on Ethernet1/0 for group 224.1.2.3 RGMP: Sending a Bye packet on Ethernet1/0debug ip rip
To display information on Routing Information Protocol ( RIP) routing transactions, use the debug ip rip command in privileged EXEC mode. To disable debugging output, use the no form of this command.
Examples
In the following example, the router being debugged has received updates from a router at source address 10.89.80.28. In this scenario, information has been sent to about five destinations in the routing table update. Notice that the fourth destination address in the update,172.31.0.0, is inaccessible because it is more than 15 hops away from the router from which the update was sent. The router being debugged also sends updates, in both cases to broadcast address 255.255.255.255 as the destination.
Router# debug ip rip
RIP: received update from 10.89.80.28 on Ethernet0
  10.89.95.0 in 1 hops
  10.89.81.0 in 1 hops
  10.89.66.0 in 2 hops
  172.31.0.0 in 16 hops (inaccessible)
  0.0.0.0 in 7 hop
RIP: sending update to 255.255.255.255 via Ethernet0 (10.89.64.31)
  subnet 10.89.94.0, metric 1
  172.31.0.0 in 16 hops (inaccessible)
RIP: sending update to 255.255.255.255 via Serial1 (10.89.94.31)
  subnet 10.89.64.0, metric 1
  subnet 10.89.66.0, metric 3
  172.31.0.0 in 16 hops (inaccessible)
  default 0.0.0.0, metric 8
The second line is an example of a routing table update. It shows the number of hops between a given Internet address and the router.
The entries show that the router is sending updates that are similar, except that the number in parentheses is the source address encapsulated into the IP header.
The following are examples for the debug ip rip command of entries that appear at startup, during an interface transition event, or when a user manually clears the routing table:
RIP: broadcasting general request on Ethernet0
RIP: broadcasting general request on Ethernet1
The following entry is most likely caused by a malformed packet from the sender:
RIP: bad version 128 from 160.89.80.43debug ip routing
To display information on Routing Information Protocol ( RIP) routing table updates and route cache updates, use the debug ip routing command in privileged EXEC mode. To disable debugging output, use the no form of this command.
Examples
The following is sample output from the debug ip routing command:
Router# debug ip routing
RT: add 172.25.168.0 255.255.255.0 via 172.24.76.30, igrp metric [100/3020]
RT: metric change to 172.25.168.0 via 172.24.76.30, igrp metric [100/3020]
        new metric [100/2930]
IP: cache invalidation from 0x115248 0x1378A, new version 5736
RT: add 172.26.219.0 255.255.255.0 via 172.24.76.30, igrp metric [100/16200]
RT: metric change to 172.26.219.0 via 172.24.76.30, igrp metric [100/16200]
        new metric [100/10816]
RT: delete route to 172.26.219.0 via 172.24.76.30, igrp metric [100/10816]
RT: no routes to 172.26.219.0, entering holddown
IP: cache invalidation from 0x115248 0x1378A, new version 5737
RT: 172.26.219.0 came out of holddown
RT: garbage collecting entry for 172.26.219.0
IP: cache invalidation from 0x115248 0x1378A, new version 5738
RT: add 172.26.219.0 255.255.255.0 via 172.24.76.30, igrp metric [100/10816]
RT: delete route to 172.26.219.0 via 172.24.76.30, igrp metric [100/10816]
RT: no routes to 172.26.219.0, entering holddown
IP: cache invalidation from 0x115248 0x1378A, new version 5739
RT: 172.26.219.0 came out of holddown
RT: garbage collecting entry for 172.26.219.0
IP: cache invalidation from 0x115248 0x1378A, new version 5740
RT: add 172.26.219.0 255.255.255.0 via 172.24.76.30, igrp metric [100/16200]
RT: metric change to 172.26.219.0 via 172.24.76.30, igrp metric [100/16200]
        new metric [100/10816]
RT: delete route to 172.26.219.0 via 172.24.76.30, igrp metric [100/10816]
RT: no routes to 172.26.219.0, entering holddown
IP: cache invalidation from 0x115248 0x1378A, new version 5741
In the following lines, a newly created entry has been added to the IP routing table. The “metric change” indicates that this entry existed previously, but its metric changed and the change was reported by means of IGRP. The metric could also be reported via RIP, OSPF, or another IP routing protocol. The numbers inside the brackets report the administrative distance and the actual metric.
RT: add 172.25.168.0 255.255.255.0 via 172.24.76.30, igrp metric [100/3020]
RT: metric change to 172.25.168.0 via 172.24.76.30, igrp metric [100/3020]
        new metric [100/2930]
IP: cache invalidation from 0x115248 0x1378A, new version 5736
“Cache invalidation” means that the fast-switching cache was invalidated due to a routing table change. “New version” is the version number of the routing table. When the routing table changes, this number is incriminated. The hexadecimal numbers are internal numbers that vary from version to version and software load to software load.
In the following output, the “holddown” and “cache invalidation” lines are displayed. Most of the distance vector routing protocols use “holddown” to avoid typical problems like counting to infinity and routing loops. If you look at the output of the show ip protocols command you will see the timer values for “holddown” and “cache invalidation.” “Cache invalidation” corresponds to “came out of holddown.” “Delete route” is triggered when a better path appears. It removes the old inferior path.
RT: delete route to 172.26.219.0 via 172.24.76.30, igrp metric [100/10816]
RT: no routes to 172.26.219.0, entering holddown
IP: cache invalidation from 0x115248 0x1378A, new version 5737
RT: 172.26.219.0 came out of holddown
debug ip routing static bfd
To enable debugging output on IP static Bidirectional Forwarding Detection (BFD) neighbor events, use the debug ip routing static bfdcommand in privileged EXEC mode. To disable debugging output, use the no form of this command.
Examples
The following is sample output from the debug ip routing static bfdcommand:
Router# debug ip routing static bfd
*Dec 18 19:01:48.416: IP-ST-BFD(default): queued Config BFD neighbor command: intf Ethernet1/1, gw 10.1.1.1 *Dec 18 19:01:48.416: IP-ST: Entering ipstatic_bfd_neighbor_add
Router(config)# ip route 10.2.0.0 255.255.0.0 Ethernet1/1 10.1.1.1
Router(config)# *Dec 18 19:02:06.348: IP-ST: head_gwif: NULL *Dec 18 19:02:06.348: IP-ST: Inserted to GWIF tree (head): 10.2.0.0/16 Et1/1 10.1.1.1 *Dec 18 19:02:16.852: RT: updating static 10.2.0.0/16 (0x0) via 10.1.1.1 Et1/1 *Dec 18 19:02:16.856: RT: add 10.2.0.0/16 via 10.1.1.1, static metric [1/0] RtrB(config)#end RouterB#
debug ip rsvp
Caution
Use this command with a small number of tunnels or Resource Reservation Protocol (RSVP) reservations. Too much data can overload the CPU.
To display debug messages for RSVP categories, use the debug ip rsvp command in privileged EXEC mode. To disable debugging output, use the no form of this command.
debug ip rsvp [ all | api | authentication | cli | data-pkts | database | detail | dump-messages | errors | events | fast-reroute | filter [ acl | vrf { * | vrf-name [acl] } ] | function | handles | hello | messages | msg-mgr | path | policy | proxy | rate-limit | reliable-msg | resv | routing | sbm | signalling | snmp | summary-refresh | svc | timeouts | timer | traffic-control | wfq ]
no debug ip rsvp
Syntax Description
all
(Optional) RSVP messages for all categories.
api
(Optional) RSVP application programming interface (API) events.
authentication
(Optional) RSVP authentication.
cli
(Optional) RSVP command-line interface (CLI).
data-pkts
(Optional) RSVP data processing.
database
(Optional) RSVP database debugging.
detail
(Optional) RSVP packet content.
dump-messages
(Optional) Dump RSVP message content.
errors
(Optional) Informational debugging messages and messages about irregular events.
events
(Optional) RSVP process events.
fast-reroute
(Optional) RSVP fast-reroute support for label-switched paths (LSPs).
filter
(Optional) RSVP debug message filter.
acl
(Optional) Number (1 to 199) of the access control list (ACL).
vrf *
(Optional) A virtual routing and forwarding (VFR) instance. * = A wildcard to display all VRFs.
vrf vrf-name
(Optional) A VFR instance. vrf-name = The name of a VRF.
acl
(Optional) Number (1 to 199) of the ACL for the VRF.
function
(Optional) RSVP function names.
handles
(Optional) RSVP database handles event.
hello
(Optional) RSVP hello events.
messages
(Optional) Brief information about all RSVP messages that are sent and received via IP debugging.
msg-mgr
(Optional) RSVP message-manager events.
path
(Optional) RSVP PATH messages.
policy
(Optional) RSVP policy information.
proxy
(Optional) Proxy API trace.
rate-limit
(Optional) RSVP rate-limiting events.
reliable-msg
(Optional) RSVP reliable messages events.
resv
(Optional) RSVP RESV messages.
routing
(Optional) RSVP routing messages.
sbm
(Optional) RSVP subnet bandwidth manager (SBM) messages.
signalling
(Optional) RSVP signalling (PATH and RESV) messages.
snmp
(Optional) RSVP Simple Network Management Protocol (SNMP) events.
sso
(Optional) RSVP stateful switchover (SSO) events.
summary-refresh
(Optional) RSVP summary refresh and bundle messages events.
svc
(Optional) Switched virtual circuit (SVC) events.
timeouts
(Optional) RSVP refresh timeouts.
timer
(Optional) RSVP timer events.
traffic-control
(Optional) RSVP traffic control events.
wfq
(Optional) RSVP weighted fair queueing (WFQ) events.
Command History
Release
Modification
12.0(5)T
This command was introduced.
12.2(13)T
The dump-messages, msg-mgr, proxy, rate-limit, reliable-msg, and summary-refresh keywords were added.
12.0(23)S
The timeouts keyword was added.
12.0(24)S
The hello keyword was added.
12.2(33)SRA
This command was integrated into Cisco IOS Release 12.2(33)SRA.
12.2(31)SB2
This command was integrated into Cisco IOS Release 12.2(31)SB2.
12.2(33)SXH
This command was integrated into Cisco IOS Release 12.2(33)SXH.
12.4(20)T
The command output was modified to display RSVP source address and interface information.
15.0(1)M
This command was modified. The optional vrf and *keywords and vrf-nameargument were added.
12.2(33)SRE
This command was modified. For point-to-multipoint traffic engineering tunnels, the output displays the destination address of the sub-label switched path (LSP).
Examples
The following output appears in source-address: source-address format after you configure a source address and enable the debug ip rsvp cli command:
Router# debug ip rsvp cli
RSVP cli debugging is on
*Sep 11 06:33:27.203: RSVP: RSVP source-address is enabled on interface Ethernet1/0. source-address: 10.1.3.13The following output appears in source-interface::address: source-interface::address format after you configure a source interface address and enable the debug ip rsvp cli command:
*Sep 11 06:33:27.203: RSVP: RSVP source-interface is enabled on interface Ethernet1/0. source-interface::address: Loopback0::10.1.1.1The following output appears when you enable the debug ip rsvp path command and configure a source address in the HOP object of PATH, PATHTEAR, or PATHERROR messages:
*Sep 12 08:56:46.267: RSVP: 10.1.1.1_200->10.4.4.4_100[0.0.0.0]: building hop object with src addr: 10.2.3.23Examples
The following commands show how to enable debugging for RSVP signaling and messages:
Router# debug ip rsvp signalling

RSVP signalling messages (Summary) debugging is on
Router# debug ip rsvp messages

RSVP messages (sent/received via IP) debugging is on
The following output displays RSVP signaling-related events that include sending and receiving PATH and RESV messages, admitting new reservations, establishing sessions, sending and receiving acknowledgments (ACKs), and sending and receiving summary refresh messages:
01:14:56:RSVP 10.20.1.1_19->10.75.1.1_100[10.20.1.1]:Received Path message from 10.20.1.1 (on sender host) 01:14:56:RSVP:new path message passed parsing, continue... 01:14:56:RSVP 10.20.1.1_19->10.75.1.1_100[10.20.1.1]:Refresh Path psb = 61646BB0 refresh interval = 0mSec 01:14:56:RSVP 10.20.1.1_19->10.75.1.1_100[10.20.1.1]:Sending Path message to 10.4.4.2 01:14:56:RSVP session 10.75.1.1_100[10.20.1.1]:Path sent by IP to 10.4.4.2 length=216 checksum=B1E4 TOS=0xC0 prerouted=YES router_alert=YES udp=NO (Ethernet1) 01:14:56:RSVP:Resv received from IP layer (IP HDR 10.4.4.2->10.4.4.1) 01:14:56:RSVP session 10.75.1.1_100[10.20.1.1]:Received RESV for 10.75.1.1 (Ethernet1) from 10.4.4.2 01:14:56:RSVP 10.20.1.1_19->10.75.1.1_100[10.20.1.1]:reservation not found--new one 01:14:56:RSVP-RESV:Admitting new reservation:6165D0E4 01:14:56:RSVP 10.20.1.1_19->10.75.1.1_100[10.20.1.1]:RSVP bandwidth is available 01:14:56:RSVP-RESV:reservation was installed:6165D0E4 01:14:57:RSVP:Sending Unknown message to 10.4.4.2 01:14:57:RSVP:Ack sent by IP to 10.4.4.2 length=20 checksum=34A7 TOS=0x00 prerouted=NO router_alert=NO udp=NO (Ethernet1) 01:14:57:RSVP 10.20.1.1_19->10.75.1.1_100[10.20.1.1]:Refresh Path psb = 61646BB0 refresh interval = 937mSec 01:14:58:%LINK-3-UPDOWN:Interface Tunnel100, changed state to up 01:14:59:%LINEPROTO-5-UPDOWN:Line protocol on Interface Tunnel100, changed state to up 01:15:26:RSVP 10.20.1.1_19->10.75.1.1_100[10.20.1.1]:Refresh Path psb = 61646BB0 refresh interval = 30000mSec 01:15:26:RSVP 10.20.1.1_19->10.75.1.1_100[10.20.1.1]:Sending Path message to 10.4.4.2 01:15:26:RSVP session 10.75.1.1_100[10.20.1.1]:Path sent by IP to 10.4.4.2 length=216 checksum=B1E4 TOS=0xC0 prerouted=YES router_alert=YES udp=NO (Ethernet1) 01:15:26:RSVP:Resv received from IP layer (IP HDR 10.4.4.2->10.4.4.1) 01:15:26:RSVP session 10.75.1.1_100[10.20.1.1]:Received RESV for 10.75.1.1 (Ethernet1) from 10.4.4.2 01:15:26:RSVP 10.20.1.1_19->10.75.1.1_100[10.20.1.1]:reservation found--processing possible change:6165D0E4 01:15:26:RSVP 10.20.1.1_19->10.75.1.1_100[10.20.1.1]:No change in reservation 01:15:27:RSVP:Sending Ack message to 10.4.4.2 01:15:27:RSVP:Ack sent by IP to 10.4.4.2 length=20 checksum=34A7 TOS=0x00 prerouted=NO router_alert=NO udp=NO (Ethernet1) 01:15:56:RSVP:Sending Srefresh message to 10.4.4.2 01:15:56:RSVP:Srefresh sent by IP to 10.4.4.2 length=32 checksum=CA0D TOS=0x00 prerouted=NO router_alert=NO udp=NO (Ethernet1) 01:15:56:RSVP:Ack received from IP layer (IP HDR 10.4.4.2->10.4.4.1) 01:15:56:RSVP:Srefresh received from IP layer (IP HDR 10.4.4.2->10.4.4.1) 01:15:56:RSVP-RESV:Resv state is being refreshed for 0x91 01:15:56:RSVP:Sending Ack message to 10.4.4.2 01:15:56:RSVP:Ack sent by IP to 10.4.4.2 length=20 checksum=34A5 TOS=0x00 prerouted=NO router_alert=NO udp=NO (Ethernet1) 01:16:26:RSVP:Sending Srefresh message to 10.4.4.2 01:16:26:RSVP:Srefresh sent by IP to 10.4.4.2 length=32 checksum=CA0C TOS=0x00 prerouted=NO router_alert=NO udp=NO (Ethernet1) 01:16:26:RSVP:Ack received from IP layer (IP HDR 10.4.4.2->10.4.4.1) 01:16:26:RSVP:Srefresh received from IP layer (IP HDR 10.4.4.2->10.4.4.1) 01:16:26:RSVP-RESV:Resv state is being refreshed for 0x91 01:16:26:RSVP:Sending Ack message to 10.4.4.2 01:16:26:RSVP:Ack sent by IP to 10.4.4.2 length=20 checksum=34A3 TOS=0x00 prerouted=NO router_alert=NO udp=NO (Ethernet1)debug ip rsvp aggregation
To display debugging output for Resource Reservation Protocol (RSVP) aggregation sessions, use the debug ip rsvp aggregationcommand in privileged EXEC mode. To disable debugging output, use the no form of this command.
Usage Guidelines
This command displays information about RSVP aggregation sessions.
RSVP aggregation maintains a Finite State Machine (FSM) for each aggregate session. The RSVP code uses the FSM to maintain aggregate states and transition between the states of an aggregate. For example, after the aggregator sends out the aggregate PATH message, a new state will be entered for the aggregate session (RESV_WAIT) to reflect that an aggregate RESV message is expected. If an aggregate RESV message is received, the session enters the ESTABLISHED state. If an aggregate RESV is not received within a timeout, the aggregate session is cleaned and the process starts again.
Each aggregate reservation can be in one of the following states:
- PATH_WAIT--Valid at the deaggregator only. The aggregate reservation at the deaggregator enters this state after the deaggregator has sent a PATHERROR message requesting a new aggregate needed.
- RESV_WAIT--Valid at the aggregator only. The aggregate reservation at the aggregator enters this state after the aggregator has sent a PATH message for the aggregate reservation.
- RESVCONF_WAIT--Valid at the deaggregator only. The aggregate reservation at the deaggregator enters this state after the deaggregator has sent a RESV message for the aggregate reservation.
- ESTABLISHED--Valid at both the aggregator and the deaggregator. The aggregator enters this state after a RESVCONF message has been sent. The deaggregator enters this state after it receives a RESVCONF message for the aggregate reservation.
- SHUT_DELAY--Valid at both the aggregator and the deaggregator. The aggregator and the deaggregator enter this state after the last end-to-end (E2E) reservation has been removed.
There are timers associated with the PATH_WAIT, RESV_WAIT, RESVCONF_WAIT, and SHUT_DELAY states. For example, if an event that is needed to move the FSM out of the PATH_WAIT, RESV_WAIT, or RESVCONF_WAIT state does not occur, (that is, an aggregate PATH message is not received when in the PATH_WAIT state), the timer expires and the aggregate is cleared.
In the successful scenario, the aggregate stays in the ESTABLISHED state as long as some E2E flows are aggregated. Both the aggregator and the deaggregator stay in the SHUT_DELAY state until the timer expires or an aggregate RESVTEAR or PATHTEAR message is received.
Examples
The following example shows output from the debug ip rsvp aggregationcommand taken at an aggregator:
Router# debug ip rsvp aggregation RSVP aggregation debugging is on *Jan 25 18:40:03.385: RSVP-AGG-3175: 10.3.3.3->10.4.4.4_46[A][4AB8208]: event=NEW_AGG_NEEDED, current state=START *Jan 25 18:40:03.385: RSVP-AGG-3175: 10.3.3.3->10.4.4.4_46[A][4AB8208]: triggered Aggregate Path to 10.4.4.4 *Jan 25 18:40:03.385: RSVP-AGG-3175: 10.3.3.3->10.4.4.4_46[A][4AB8208]: new state=RESV_WAIT *Jan 25 18:40:03.441: RSVP-AGG-3175: 10.3.3.3->10.4.4.4_46[A][4AB8208]: event=AGG_RESV_STATE_CREATED, current state=RESV_WAIT *Jan 25 18:40:03.441: RSVP-AGG-3175: 10.3.3.3->10.4.4.4_46[A][4AB8208]: new state=ESTABLISHED *Jan 25 18:40:03.465: RSVP-AGG-3175: 10.3.3.3->10.4.4.4_46[A][4AB8208]: event=E2E_RESV_STATE_CREATED, current state=ESTABLISHED *Jan 25 18:40:03.465: RSVP-AGG-3175: 10.3.3.3->10.4.4.4_46[A][4AB8208]: event=E2E_RESV_STATE_ADMITTED, current state=ESTABLISHEDdebug ip rsvp authentication
To display debugging output related to Resource Reservation Protocol (RSVP) authentication, use the debug ip rsvp authenticationcommand in privileged EXEC mode. To disable debugging output, use the no form of this command.
Usage Guidelines
After you enable RSVP authentication, RSVP logs system error events whenever an authentication check fails. These events are logged instead of just being displayed when debugging is enabled because they may indicate potential security attacks. The events are generated when:
- RSVP receives a message that does not contain the correct cryptographic signature. This could be due to misconfiguration of the authentication key or algorithm on one or more RSVP neighbors, but it may also indicate an (unsuccessful) attack.
- RSVP receives a message with the correct cryptographic signature, but with a duplicate authentication sequence number. This may indicate an (unsuccessful) message replay attack.
- RSVP receives a message with the correct cryptographic signature, but with an authentication sequence number that is outside the receive window. This could be due to a reordered burst of valid RSVP messages, but it may also indicate an (unsuccessful) message replay attack.
- Failed challenges result from timeouts or bad challenge responses.
Examples
The following example shows output from the debug ip rsvp authenticationcommand in which the authentication type (digest) and the sequence number have been validated:
Router# debug ip rsvp authentication
RSVP authentication debugging is on
Router# show debugging
*Jan 30 08:10:46.335:RSVP_AUTH:Resv integrity digest from 192.168.101.2 valid
*Jan 30 08:10:46.335:RSVP_AUTH:Resv integrity sequence number 13971113505298841601 from 192.168.101.2 valid
*Jan 30 08:10:46.335:RSVP_AUTH:Resv from 192.168.101.2 passed all authentication checks
NoteCisco routers using RSVP authentication on Cisco IOS software ideally should have clocks that can be accurately restored to the correct time when the routers boot. This capability is available on certain Cisco routers that have clocks with battery backup. For those platforms that do not have battery backup, consider configuring the router to keep its clock synchronized with a Network Time Protocol (NTP) time server. Otherwise, if two adjacent routers have been operating with RSVP authentication enabled and one of them reboots such that its clock goes backward in time, it is possible (but unlikely) the router that did not reboot will log RSVP authentication sequence number errors.
debug ip rsvp detail
To display detailed information about Resource Reservation Protocol (RSVP)-enabled and Subnetwork Bandwidth Manager (SBM) message processing, use the debug ip rsvp detailcommand in privileged EXEC mode. To disable debugging output, use the no form of this command.
Examples
The following example shows the detailed debug information about RSVP and SBM that is available when you enable debug mode through the debug ip rsvp detail command:
Router# debug ip rsvp detail
RSVP debugging is on
router2#u
*Dec 31 16:44:29.651: RSVP: send I_AM_DSBM message from 145.2.2.150
*Dec 31 16:44:29.651: RSVP: IP to 224.0.0.17 length=88 checksum=43AF
(Ethernet2)
*Dec 31 16:44:29.651: RSVP: version:1 flags:0000 type:I_AM_DSBM cksum:43AF
                        ttl:254 reserved:0 length:88
*Dec 31 16:44:29.651:  DSBM_IP_ADDR       type 1 length 8 : 91020296
*Dec 31 16:44:29.651:  HOP_L2             type 1 length 12: 00E01ECE
*Dec 31 16:44:29.651:                                     : 0F760000
*Dec 31 16:44:29.651:  SBM_PRIORITY       type 1 length 8 : 00000064
*Dec 31 16:44:29.651:  DSBM_TIMERS        type 1 length 8 : 00000F05
*Dec 31 16:44:29.651:  SBM_INFO           type 1 length 44: 00000000
*Dec 31 16:44:29.651:                                     : 00240C02 00000007
*Dec 31 16:44:29.651:                                     : 01000006 7F000005
*Dec 31 16:44:29.651:                                     : 00000000 00000000
*Dec 31 16:44:29.655:                                     : 00000000 00000000
*Dec 31 16:44:29.655:                                     : 00000000
Related Commands
Command
Description
debug ip rsvp
Displays information about SBM message processing, the DSBM election process, and RSVP message processing.
debug ip rsvp detail sbm
Displays detailed information about the contents of SMB messages only, and SBM and DSBM state transitions.
ip rsvp dsbm-candidate
Configures an interface as a DSBM candidate.
show ip rsvp sbm
Displays information about SBM configured for a specific RSVP-enabled interface or all RSVP-enabled interfaces on the router.
debug ip rsvp dump-messages
Caution
Use this command with a small number of tunnels or Resource Reservation Protocol (RSVP) reservations. Too much data can overload the console.
To display debugging messages for all RSVP events, use the debug ip rsvp dump-messages command in privileged EXEC mode. To disable debugging output, use the no form of this command.
Examples
The following command shows how to enable debugging for RSVP events:
Router# debug ip rsvp dump-messages
RSVP message dump debugging is on
In the following display, notice that a Path message is transmitted and an ACK_DESIRED flag is set for ID: 0x26 Epoch: 0x76798A. In response, a Resv message is sent and an acknowledgment (ACK) is issued for ID: 0x26 Epoch: 0x76798A indicating the RSVP state is established on the neighboring router:
00:37:15:RSVP:version:1 flags:0000 type:PROXY_PATH cksum:0000 ttl:255 reserved:0 length:212 00:37:15: SESSION type 7 length 16: 00:37:15: Destination 140.75.1.1, TunnelId 100, Source 140.20.1.1, Protocol 0, Flags 0000 00:37:15: HOP type 1 length 12: 00:37:15: Neighbor 140.20.1.1, LIH 0x00000000 00:37:15: TIME_VALUES type 1 length 8 : 00:37:15: Refresh period is 30000 msecs 00:37:15: SENDER_TEMPLATE type 7 length 12: 00:37:15: Source 140.20.1.1, tunnel_id 9 00:37:15: SENDER_TSPEC type 2 length 36: 00:37:15: version=0, length in words=7 00:37:15: Token bucket fragment (service_id=1, length=6 words 00:37:15: parameter id=127, flags=0, parameter length=5 00:37:15: average rate=1250 bytes/sec, burst depth=1000 bytes 00:37:15: peak rate =1250 bytes/sec 00:37:15: min unit=0 bytes, max pkt size=4294967295 bytes 00:37:15: ADSPEC type 2 length 48: 00:37:15: version=0 length in words=10 00:37:15: General Parameters break bit=0 service length=8 00:37:15: IS Hops:0 00:37:15: Minimum Path Bandwidth (bytes/sec):2147483647 00:37:15: Path Latency (microseconds):0 00:37:15: Path MTU:-1 00:37:15: Controlled Load Service break bit=0 service length=0 00:37:15: LABEL_REQUEST type 1 length 8 : 00:37:15: Layer 3 protocol ID:2048 00:37:15: EXPLICIT_ROUTE type 1 length 36: 00:37:15: (#1) Strict IPv4 Prefix, 8 bytes, 140.20.1.1/32 00:37:15: (#2) Strict IPv4 Prefix, 8 bytes, 140.4.4.2/32 00:37:15: (#3) Strict IPv4 Prefix, 8 bytes, 140.70.1.1/32 00:37:15: (#4) Strict IPv4 Prefix, 8 bytes, 140.70.1.2/32 00:37:15: SESSION_ATTRIBUTE type 7 length 28: 00:37:15: Session name:tagsw4500-21_t100 00:37:15: Setup priority:7, reservation priority:7 00:37:15: Status:May-Reroute 00:37:15: 00:37:15:RSVP:version:1 flags:0001 type:Path cksum:D61E ttl:255 reserved:0 length:216 00:37:15: MESSAGE_ID type 1 length 12: 00:37:15: ID:0x26 Epoch:0x76798A 00:37:15: Flags:ACK_DESIRED 00:37:15: SESSION type 7 length 16: 00:37:15: Destination 140.75.1.1, TunnelId 100, Source 140.20.1.1, Protocol 0, Flags 0000 00:37:15: HOP type 1 length 12: 00:37:15: Neighbor 140.4.4.1, LIH 0x10000401 00:37:15: TIME_VALUES type 1 length 8 : 00:37:15: Refresh period is 30000 msecs 00:37:15: EXPLICIT_ROUTE type 1 length 28: 00:37:15: (#1) Strict IPv4 Prefix, 8 bytes, 140.4.4.2/32 00:37:15: (#2) Strict IPv4 Prefix, 8 bytes, 140.70.1.1/32 00:37:15: (#3) Strict IPv4 Prefix, 8 bytes, 140.70.1.2/32 00:37:15: LABEL_REQUEST type 1 length 8 : 00:37:15: Layer 3 protocol ID:2048 00:37:15: SESSION_ATTRIBUTE type 7 length 28: 00:37:15: Session name:tagsw4500-21_t100 00:37:15: Setup priority:7, reservation priority:7 00:37:15: Status:May-Reroute 00:37:15: SENDER_TEMPLATE type 7 length 12: 00:37:15: Source 140.20.1.1, tunnel_id 9 00:37:15: SENDER_TSPEC type 2 length 36: 00:37:15: version=0, length in words=7 00:37:15: Token bucket fragment (service_id=1, length=6 words 00:37:15: parameter id=127, flags=0, parameter length=5 00:37:15: average rate=1250 bytes/sec, burst depth=1000 bytes 00:37:15: peak rate =1250 bytes/sec 00:37:15: min unit=0 bytes, max pkt size=4294967295 bytes 00:37:15: ADSPEC type 2 length 48: 00:37:15: version=0 length in words=10 00:37:15: General Parameters break bit=0 service length=8 00:37:15: IS Hops:1 00:37:15: Minimum Path Bandwidth (bytes/sec):1250000 00:37:15: Path Latency (microseconds):0 00:37:15: Path MTU:1500 00:37:15: Controlled Load Service break bit=0 service length=0 00:37:15: 00:37:15:RSVP:version:1 flags:0001 type:Resv cksum:DADF ttl:255 reserved:0 length:132 00:37:15: MESSAGE_ID_ACK type 1 length 12: 00:37:15: Type:ACK 00:37:15: ID:0x26 Epoch:0x76798A 00:37:15: Flags:None 00:37:15: MESSAGE_ID type 1 length 12: 00:37:15: ID:0x43 Epoch:0xE1A1B7 00:37:15: Flags:ACK_DESIRED 00:37:15: SESSION type 7 length 16: 00:37:15: Destination 140.75.1.1, TunnelId 100, Source 140.20.1.1, Protocol 0, Flags 0000 00:37:15: HOP type 1 length 12: 00:37:15: Neighbor 140.4.4.2, LIH 0x10000401 00:37:15: TIME_VALUES type 1 length 8 : 00:37:15: Refresh period is 30000 msecs 00:37:15: STYLE type 1 length 8 : 00:37:15: Shared-Explicit (SE) 00:37:15: FLOWSPEC type 2 length 36: 00:37:15: version = 0 length in words = 7 00:37:15: service id = 5, service length = 6 00:37:15: tspec parameter id = 127, flags = 0, length = 5 00:37:15: average rate = 1250 bytes/sec, burst depth = 1000 bytes 00:37:15: peak rate = 1250 bytes/sec 00:37:15: min unit = 0 bytes, max pkt size = 0 bytes 00:37:15: FILTER_SPEC type 7 length 12: 00:37:15: Source 140.20.1.1, tunnel_id 9 00:37:15: LABEL type 1 length 8 : 00:37:15: Labels:16 00:37:15: 00:37:15:RSVP:version:1 flags:0001 type:Ack cksum:34F5 ttl:255 reserved:0 length:20 00:37:15: MESSAGE_ID_ACK type 1 length 12: 00:37:15: Type:ACK 00:37:15: ID:0x43 Epoch:0xE1A1B7 00:37:15: Flags:None 00:37:15: 00:37:17:%LINK-3-UPDOWN:Interface Tunnel100, changed state to up 00:37:18:%LINEPROTO-5-UPDOWN:Line protocol on Interface Tunnel100, changed state to updebug ip rsvp errors
To display informational debugging messages and messages about irregular events, use the debug ip rsvp errorscommand in privileged EXEC mode. To disable debugging output, use the no form of this command.
Usage Guidelines
Use the debug ip rsvp errors command to display informational messages and messages about irregular events such as an incomplete setup or breakdown of an RSVP session. Informational messages do not necessarily indicate problems. It is useful to use this command if something has gone wrong, but you do not know what.
If you enter a different debug command, such as debug ip rsvp signalling, all the signalling errors and the normal signalling events are displayed. You do not have to also enter the debug ip rsvp errors command.
If there are many active RSVP sessions, enter the following configuration command to activate ACL filtering so that you will view only relevant debugging messages.
Router(config)# access-list
 number
 permit
 udp
 src_ip
 src_port
 dst_ip
 dst_port
Where
- number --Access list number, from 100 to 199
- src_ip --The tunnel headend
- src_port --The link-state packet (LSP) ID
- dst_ip --The tunnel tailend
- dst_port --The tunnel ID, where the tunnel ID is the tunnel interface number
Then enter the following command to turn on ACL filtering:
Router# debug ip rsvp filterIn the following example, debugging is allowed only when the session is initiated from 192.168.1.4 toward 192.168.1.8, for Tunnel8 on the headend.
NoteThis ACL will capture both PATH and RESV messages for the session from 192.168.1.4 to 192.168.1.8, but not any tunnels originating from 1.8 going to 1.4. You can also specify the LSP ID, but that is less useful because it changes all the time, and the combination of the head, tail, and tunnel ID is generally enough to limit the output to what you want.
Router(config)# access-list 101 permit udp host 192.168.1.4 host 192.168.1.8 eq 8 Router# debug ip rsvp filterdebug ip rsvp hello
To verify that a Hello instance has been created,that a Hello instance has been deleted, or that communication with a neighbor has been lost, use the debug ip rsvp hello command in privileged EXEC mode. To disable debugging output, use the no form of this command.
debug ip rsvp hello [client] [detail] [messages] [stats]
no debug ip rsvp hello [client] [detail] [messages] [stats]
Command Default
Debugging activity for the Hello instance or communication with a neighbor does not occur.
Usage Guidelines
When you enter the debug ip rsvp hello command, Resource Reservation Protocol (RSVP) signaling messages are shown, but RSVP hello messages are excluded because of the large number of hello messages that are sent.
Examples
Following is sample output from the debug ip rsvp hello command. The first portion of the output is for serial interface 2/0 when Hello is created.
Router# debug ip rsvp hello
00:22:03: RSVP-HELLO: rsvp_hello_inst_init: Initializing ACTIVE hello inst 10.0.0.2->10.0.0.3
00:22:03: RSVP-HELLO: rsvp_hello_create_instance_from_psb: Next hop Se2/0 is adjacent
00:22:03: RSVP-HELLO: rsvp_hello_create_instance_from_psb: Create hello instance for 10.0.0.2->10.0.0.3 on Se2/0 (psb=61BC5F60)
00:22:03: RSVP-HELLO: rsvp_hello_find_instance: psb_cnt=2 for hello inst 10.0.0.2->10.0.0.3
00:22:03: RSVP-HELLO: rsvp_hello_incoming_message: Neighbor 10.0.0.3 state changed to UP
00:22:05: %LINK-3-UPDOWN: Interface Tunnel1, changed state to up
00:22:06: %LINEPROTO-5-UPDOWN: Line protocol on Interface Tunnel1, changed state to up
Router(config-if)#
Router(config-if)# shut

Router(config-if)#
The following output shows that Hello has been deleted:
00:25:19: RSVP-HELLO: rsvp_hello_path_delete: psb for hello inst 10.0.0.2->10.0.0.3 exited READY state (psb_cnt=1)
00:25:19: RSVP-HELLO: rsvp_hello_path_delete: psb for hello inst 10.0.0.2->10.0.0.3 exited READY state (psb_cnt=0)
00:25:19: RSVP-HELLO: rsvp_hello_path_delete: Last psb deleted, hello inst for 10.0.0.2->10.0.0.3 ACTIVE->PASSIVE
00:25:19: RSVP-HELLO: rsvp_hello_path_delete: psb for hello inst 10.0.0.2->10.0.0.3 exited READY state (psb_cnt=0)
00:25:19: RSVP-HELLO: rsvp_hello_path_delete: Last psb deleted, hello inst for 10.0.0.2->10.0.0.3 ACTIVE->PASSIVE
00:25:21: %LINK-5-CHANGED: Interface Tunnel1, changed state to administratively down
00:25:22: %LINEPROTO-5-UPDOWN: Line protocol on Interface Tunnel1,
changed state to down
00:05:51: RSVP-HELLO: Communication lost with 10.0.0.2
00:05:51: RSVP-HELLO: rsvp_hello_communication_lost: Neighbor 10.0.0.2 was reset (src_inst)
Following is sample output from the debug ip rsvp hello statscommand:
Router(config)# debug ip rsvp hello stats
Router#
00:32:28: RSVP-HELLO: rsvp_hello_stats_init: Hello stats is being configured
Related Commands
Command
Description
ip rsvp signalling hello (configuration)
Enables Hello globally on the router.
ip rsvp signalling hello dscp
Sets the DSCP value that is in the IP header of the Hello message sent out from an interface.
ip rsvp signalling hello (interface)
Enables Hello on an interface where you need Fast Reroute protection.
ip rsvp signalling hello refresh interval
Configures the Hello request interval.
ip rsvp signalling hello refresh misses
Specifies how many Hello acknowledgments a node can miss in a row before the node considers that communication with its neighbor is down.
ip rsvp signalling hello statistics
Enables Hello statistics on the router.
debug ip rsvp high-availability
To display debugging output for Resource Reservation Protocol traffic engineering (RSVP-TE) high availability (HA) activities that improve the accessibility of network resources, use the debug ip rsvp high-availabilitycommand in privileged EXEC mode. To disable debugging output, use the no form of this command.
debug ip rsvp high-availability { all | database | errors | events | fsm | issu | messages }
no debug ip rsvp high-availability { all | database | errors | events | fsm | issu | messages }
Syntax Description
all
Displays debugging output for all RSVP-TE HA categories except for the dumping of messages.
database
Displays information about read and write operations to and from the checkpointed database during the RSVP-TE HA activities.
errors
Displays errors encountered by RSVP-TE during HA activities.
events
Displays significant RSVP-TE stateful switchover (SSO) events during RSVP-TE HA activities, such as:
- RSVP-TE process events
- RSVP-TE Route Processor (RP) state (active, standby, and recovery) changes
- Recovery period beginning and end
- Redundant Facility (RF) events handled by RSVP-TE
fsm
Displays significant events for the RSVP-TE checkpointed database finite state machine (fsm) during the RSVP-TE HA activities.
issu
Displays information about RSVP-TE In-Service Software Upgrade (ISSU) activity.
messages
Displays information about Checkpointing Facility (CF) messages sent by RSVP-TE between the active RP and the standby RP.
Usage Guidelines
This command displays information about RSVP-TE activities, before and after SSO, that improve the availability of network resources and services.
Examples
The following example is sample output from the debug ip rsvp high-availability all command, which turns on debugging for IP RSVP-TE HA events, messages, database, errors, fsm, and ISSU:
Router# debug ip rsvp high-availability all
RSVP HA all debugging is on
Router# show debug        <---- This command displays the debugging that is enabled.
IP RSVP HA debugging is on for:
   events
   messages
   database
   errors
   fsm
   issu
This sample debugging output is displayed as an SSO recovery begins on the standby router in the process of the standby router becoming active.
NoteThe prefix in the debug output is composed of label switched path (LSP) 5-tuples in the following format: 10.0.0.3_61->10.0.0.9_10[10.0.0.3]. The 10.0.0.3 represents the source address, the 61 represents the LSP ID, the 10.0.0.9 represents the tunnel destination (tunnel tail), the10 represents the tunnel ID, and the [10.0.0.3] represents the extended tunnel ID.
*May 12 19:46:14.267: RSVP-HA: session 65.39.97.4_18698[0.0.0.0]:rsvp_ha_read_lsp_head_info: Read LSP Head info: tun_id: 10
*May 12 19:46:14.267: RSVP-HA: session 10.0.0.1_10[0.0.0.0]: rsvp_ha_db_entry_find: lsp_head entry found
*May 12 19:46:14.267: rsvp_ha_read_lsp_head_info: entry found
*May 12 19:46:14.267: RSVP-HA:rsvp_ha_read_lsp_head_info: Read LSP Head info: tun_id: 10
*May 12 19:46:14.267: RSVP-HA: session 10.221.123.48_10[0.0.0.0]: rsvp_ha_db_entry_find: lsp_head entry found
*May 12 19:46:14.267: rsvp_ha_read_lsp_head_info: entry found
*May 12 19:46:15.995: %SYS-5-CONFIG_I: Configured from console by console
*May 12 19:46:20.803: RSVP-HA: 10.0.0.3_61->10.0.0.9_10[10.0.0.3]: rsvp_ha_db_entry_find: lsp entry found
*May 12 19:46:20.803: rsvp_ha_read_generic_info: lsp entry found
*May 12 19:46:20.807: RSVP-HA: session 10.0.0.9_10[0.0.0.0]:rsvp_ha_write_generic_info: Writing lsp_head info
*May 12 19:46:20.807: RSVP-HA: session 10.0.0.9_10[0.0.0.0]: rsvp_ha_db_entry_find: lsp_head entry not found
*May 12 19:46:20.807: RSVP-HA: session 10.0.0.9_10[0.0.0.0]: rsvp_ha_handle_wr_entry_not_found:
entry not found, type =lsp_head, action: Add
*May 12 19:46:20.807: RSVP-HA: session 10.0.0.9_10[0.0.0.0]: rsvp_ha_db_entry_create: Created lsp_head entry
*May 12 19:46:20.807: RSVP-HA: session 10.0.0.9_10[0.0.0.0]:rsvp_ha_set_entry_state: None -> Send-Pending
*May 12 19:46:20.807: RSVP-HA: session 10.0.0.9_10[0.0.0.0]: rsvp_ha_db_wavl_entry_insert: Inserted entry into lsp_head Write DB, Send_Pending tree
*May 12 19:46:20.807: RSVP-HA: session 10.0.0.9_10[0.0.0.0]:rsvp_ha_fsm_wr_event_add_entry: add lsp_head entry to Write DB
*May 12 19:46:20.807: RSVP-HA: 10.0.0.3_61->10.0.0.9_10[10.0.0.3]:
rsvp_ha_write_generic_info: Writing lsp info
*May 12 19:46:20.807: RSVP-HA: 10.0.0.3_61->10.0.0.9_10[10.0.0.3]: rsvp_ha_db_entry_find: lsp entry not found
*May 12 19:46:20.807: RSVP-HA: 10.0.0.3_61->10.0.0.9_10[10.0.0.3]:
rsvp_ha_handle_wr_entry_not_found: entry not found, type =lsp, action: Add
*May 12 19:46:20.807: RSVP-HA: 10.0.0.3_61->10.0.0.9_10[10.0.0.3]: rsvp_ha_db_entry_create: Created lsp entry
*May 12 19:46:20.807: RSVP-HA:10.0.0.3_61->10.0.0.9_10[10.0.0.3]:
rsvp_ha_set_entry_state: None -> Send-Pending
*May 12 19:46:20.807: RSVP-HA: 10.0.0.3_61->10.0.0.9_10[10.0.0.3]: rsvp_ha_db_wavl_entry_insert: Inserted entry into lsp Write DB, Send_Pending tree
*May 12 19:46:20.807: RSVP-HA: 10.0.0.3_61->10.0.0.9_10[10.0.0.3]:
rsvp_ha_fsm_wr_event_add_entry: add lsp entry to Write DB
*May 12 19:46:20.807: rsvp_ha_rd_remove_lsp_head_info: Event RD: remove lsp_head_info
*May 12 19:46:20.807: RSVP-HA: session 10.27.90.140_10[0.0.0.0]:
rsvp_ha_db_entry_find: lsp_head entry found
*May 12 19:46:20.807: RSVP-HA: session 10.0.0.9_10[0.0.0.0]: rsvp_ha_db_wavl_entry_remove: Removed entry from lsp_head Read DB, Checkpointed tree
*May 12 19:46:20.807: RSVP-HA: session 10.0.0.9_10[0.0.0.0]: rsvp_ha_db_entry_free: Freeing lsp_head entry
*May 12 19:46:20.807: RSVP-HA: session 10.0.0.9_10[0.0.0.0]:rsvp_ha_set_entry_state: Checkpointed -> None
.
.
.
The following example shows how to turn debugging off for this command:
Router# no debug ip rsvp high-availability all
RSVP HA all debugging is off
Related Commands
Command
Description
debug ip rsvp sso
Displays debugging output for RSVP signalling when the graceful restart feature is configured.
debug mpls traffic-eng ha sso
Displays debugging output for MPLS traffic engineering HA activities during the graceful switchover from an active RP to a redundant standby RP.
debug ip rsvp p2mp
To display status messages for Resource Reservation Protocol (RSVP) point-to-multipoint (P2MP) events, use the debug ip rsvp p2mpcommand in privileged EXEC mode. To disable debugging output, use the no form of this command.
Usage Guidelines
If the P2MP tunnel is not up, issue this command and the debug ip rsvp signalling command and examine the output to determine if there is a problem with the configuration.
Use this command with a small number of tunnels or RSVP reservations or use the RSVP debug message filter to limit the amount of data. Too much data can overload the CPU.
Examples
The following example shows status messages as a P2MP sub-LSP is signaled:
Router# debug ip rsvp p2mp RSVP p2mp debugging is on IP RSVP debugging is on for: p2mp Router (config)# interface tunnel100 Router (config-if)# no shutdown 06:56:21: RSVP: 10.1.0.1_134[Src/1]->10.2.0.1_100[Src] {13}: First Sub-LSP, accept Path. 06:56:21: RSVP: 10.1.0.1_134[Src/2]->10.3.0.1_100[Src] {13}: Sibling Sub-LSP received with consistent signalling attributes, accept Path 06:56:21: RSVP: 10.1.0.1_134[Src/3]->10.4.0.1_100[Src] {13}: Sibling Sub-LSP received with consistent signalling attributes, accept Path 06:56:22: RSVP: 10.1.0.1_134[Src/1]->10.2.0.1_100[Src] {13}: First Sub-LSP, accept Resv. 06:56:22: %LINEPROTO-5-UPDOWN: Line protocol on Interface Tunnel100, changed state to up 06:56:22: RSVP: 10.1.0.1_134[Src/3]->10.4.0.1_100[Src] {13}: Sibling Sub-LSP received with consistent signalling attributes, accept Resv 06:56:22: RSVP: 10.1.0.1_134[Src/2]->10.3.0.1_100[Src] {13}: Sibling Sub-LSP received with consistent signalling attributes, accept Resvdebug ip rsvp policy
To display debugging messages for Resource Reservation Protocol (RSVP) policy processing, use the debug ip rsvp policycommand in privileged EXEC mode. To disable debugging output, use the noform of this command.
Usage Guidelines
You might find it useful to enable the debug cops command when you are using the debug ip rsvp policy command. Together, these commands generate a complete record of the policy process.
Examples
The following example uses only the debug ip rsvp policy command:
Router-1# debug ip rsvp policy
RSVP_POLICY debugging is on
02:02:14:RSVP-POLICY:Creating outbound policy IDB entry for Ethernet2/0 (61E6AB38)
02:02:14:RSVP-COPS:COPS query for Path message, 10.31.0.1_44->10.33.0.1_44
02:02:14:RSVP-POLICY:Building incoming Path context
02:02:14:RSVP-POLICY:Building outgoing Path context on Ethernet2/0
02:02:14:RSVP-POLICY:Build REQ message of 216 bytes
02:02:14:RSVP-POLICY:Message sent to PDP
02:02:14:RSVP-COPS:COPS engine called us with reason2, handle 6202A658
02:02:14:RSVP-COPS:Received decision message
02:02:14:RSVP-POLICY:Received decision for Path message
02:02:14:RSVP-POLICY:Accept incoming message
02:02:14:RSVP-POLICY:Send outgoing message to Ethernet2/0
02:02:14:RSVP-POLICY:Replacement policy object for path-in context
02:02:14:RSVP-POLICY:Replacement TSPEC object for path-in context
02:02:14:RSVP-COPS:COPS report for Path message, 10.31.0.1_44->10.33.0.1_44
02:02:14:RSVP-POLICY:Report sent to PDP
02:02:14:RSVP-COPS:COPS report for Path message, 10.31.0.1_44->10.33.0.1_44
The following example uses both the debug ip rsvp policy and the debug cops commands:
Router-1# debug ip rsvp policy RSVP_POLICY debugging is on Router-1# debug cops COPS debugging is on 02:15:14:RSVP-POLICY:Creating outbound policy IDB entry for Ethernet2/0 (61E6AB38) 02:15:14:RSVP-COPS:COPS query for Path message, 10.31.0.1_44->10.33.0.1_44 02:15:14:RSVP-POLICY:Building incoming Path context 02:15:14:RSVP-POLICY:Building outgoing Path context on Ethernet2/0 02:15:14:RSVP-POLICY:Build REQ message of 216 bytes 02:15:14:COPS:** SENDING MESSAGE ** COPS HEADER:Version 1, Flags 0, Opcode 1 (REQ), Client-type:1, Length:216 HANDLE (1/1) object. Length:8. 00 00 22 01 CONTEXT (2/1) object. Length:8. R-type:5. M-type:1 IN_IF (3/1) object. Length:12. Address:10.1.2.1. If_index:4 OUT_IF (4/1) object. Length:12. Address:10.33.0.1. If_index:3 CLIENT SI (9/1) object. Length:168. CSI data: 02:15:14: SESSION type 1 length 12: 02:15:14: Destination 10.33.0.1, Protocol_Id 17, Don't Police , DstPort 44 02:15:14: HOP type 1 length 12:0A010201 02:15:14: :00000000 02:15:14: TIME_VALUES type 1 length 8 :00007530 02:15:14: SENDER_TEMPLATE type 1 length 12: 02:15:14: Source 10.31.0.1, udp_source_port 44 02:15:14: SENDER_TSPEC type 2 length 36: 02:15:14: version=0, length in words=7 02:15:14: Token bucket fragment (service_id=1, length=6 words 02:15:14: parameter id=127, flags=0, parameter length=5 02:15:14: average rate=1250 bytes/sec, burst depth=10000 bytes 02:15:14: peak rate =1250000 bytes/sec 02:15:14: min unit=0 bytes, max unit=1514 bytes 02:15:14: ADSPEC type 2 length 84: 02:15:14: version=0 length in words=19 02:15:14: General Parameters break bit=0 service length=8 02:15:14: IS Hops:1 02:15:14: Minimum Path Bandwidth (bytes/sec):1250000 02:15:14: Path Latency (microseconds):0 02:15:14: Path MTU:1500 02:15:14: Guaranteed Service break bit=0 service length=8 02:15:14: Path Delay (microseconds):192000 02:15:14: Path Jitter (microseconds):1200 02:15:14: Path delay since shaping (microseconds):192000 02:15:14: Path Jitter since shaping (microseconds):1200 02:15:14: Controlled Load Service break bit=0 service length=0 02:15:14:COPS:Sent 216 bytes on socket, 02:15:14:RSVP-POLICY:Message sent to PDP 02:15:14:COPS:Message event! 02:15:14:COPS:State of TCP is 4 02:15:14:In read function 02:15:14:COPS:Read block of 96 bytes, num=104 (len=104) 02:15:14:COPS:** RECEIVED MESSAGE ** COPS HEADER:Version 1, Flags 1, Opcode 2 (DEC), Client-type:1, Length:104 HANDLE (1/1) object. Length:8. 00 00 22 01 CONTEXT (2/1) object. Length:8. R-type:1. M-type:1 DECISION (6/1) object. Length:8. COMMAND cmd:1, flags:0 DECISION (6/3) object. Length:56. REPLACEMENT 00 10 0E 01 61 62 63 64 65 66 67 68 69 6A 6B 6C 00 24 0C 02 00 00 00 07 01 00 00 06 7F 00 00 05 44 9C 40 00 46 1C 40 00 49 98 96 80 00 00 00 C8 00 00 01 C8 CONTEXT (2/1) object. Length:8. R-type:4. M-type:1 DECISION (6/1) object. Length:8. COMMAND cmd:1, flags:0 02:15:14:Notifying client (callback code 2) 02:15:14:RSVP-COPS:COPS engine called us with reason2, handle 6202A104 02:15:14:RSVP-COPS:Received decision message 02:15:14:RSVP-POLICY:Received decision for Path message 02:15:14:RSVP-POLICY:Accept incoming message 02:15:14:RSVP-POLICY:Send outgoing message to Ethernet2/0 02:15:14:RSVP-POLICY:Replacement policy object for path-in context 02:15:14:RSVP-POLICY:Replacement TSPEC object for path-in context 02:15:14:RSVP-COPS:COPS report for Path message, 10.31.0.1_44->10.33.0.1_44 02:15:14:COPS:** SENDING MESSAGE ** COPS HEADER:Version 1, Flags 1, Opcode 3 (RPT), Client-type:1, Length:24 HANDLE (1/1) object. Length:8. 00 00 22 01 REPORT (12/1) object. Length:8. REPORT type COMMIT (1) 02:15:14:COPS:Sent 24 bytes on socket, 02:15:14:RSVP-POLICY:Report sent to PDP 02:15:14:Timer for connection entry is zero 02:15:14:RSVP-COPS:COPS report for Path message, 10.31.0.1_44->10.33.0.1_44debug ip rsvp rate-limit
To display debugging messages for Resource Reservation Protocol (RSVP) rate-limiting events, use the debug ip rsvp rate-limitcommand in privileged EXEC mode. To disable debugging output, use the no form of this command.
Examples
The following command shows how to enable debugging for RSVP rate-limiting and message manager events:
Router# debug ip rsvp rate-limit
RSVP rate-limit debugging is on
Router# debug ip rsvp msg-mgr
RSVP msg-mgr debugging is on
In the following display, RSVP process information including messages, timers, neighbors IP addresses, and message IDs, appear:
01:00:19:RSVP-RATE-LIMIT:rsvp_msg_pacing_send_message 01:00:19:RSVP-MSG-MGR (140.4.4.2):Starting timer msg-pacing interval 20 01:00:19:RSVP-MSG-MGR (140.4.4.2):Enqueue element 27000405 of type 3 on msg-pacing TAIL 01:00:19:RSVP-RATE-LIMIT:rsvp_msg_pacing_timer - timer expired 01:00:19:RSVP-MSG-MGR (140.4.4.2):Dequeueing element 27000405 of type 3 from msg-pacing 01:00:19:RSVP-RATE-LIMIT:rsvp_msg_pacing_send_qe:sending psb (qe 27000405) 01:00:21:%LINK-3-UPDOWN:Interface Tunnel100, changed state to up 01:00:22:%LINEPROTO-5-UPDOWN:Line protocol on Interface Tunnel100, changed state to up 01:01:03:RSVP-RATE-LIMIT:rsvp_msg_pacing_send_message 01:01:03:RSVP-MSG-MGR (140.4.4.2):Starting timer msg-pacing interval 20 01:01:03:RSVP-MSG-MGR (140.4.4.2):Enqueue element 27000405 of type 3 on msg-pacing TAIL 01:01:03:RSVP-RATE-LIMIT:rsvp_msg_pacing_timer - timer expired 01:01:03:RSVP-MSG-MGR (140.4.4.2):Dequeueing element 27000405 of type 3 from msg-pacing 01:01:03:RSVP-RATE-LIMIT:rsvp_msg_pacing_send_qe:sending psb (qe 27000405) 01:01:42:RSVP-RATE-LIMIT:rsvp_msg_pacing_send_message 01:01:42:RSVP-MSG-MGR (140.4.4.2):Starting timer msg-pacing interval 20 01:01:42:RSVP-MSG-MGR (140.4.4.2):Enqueue element 27000405 of type 3 on msg-pacing TAIL 01:01:42:RSVP-RATE-LIMIT:rsvp_msg_pacing_timer - timer expired 01:01:42:RSVP-MSG-MGR (140.4.4.2):Dequeueing element 27000405 of type 3 from msg-pacing 01:01:42:RSVP-RATE-LIMIT:rsvp_msg_pacing_send_qe:sending psb (qe 27000405) 01:02:09:RSVP-RATE-LIMIT:rsvp_msg_pacing_send_message 01:02:09:RSVP-MSG-MGR (140.4.4.2):Starting timer msg-pacing interval 20 01:02:09:RSVP-MSG-MGR (140.4.4.2):Enqueue element 27000405 of type 3 on msg-pacing TAIL 01:02:09:RSVP-RATE-LIMIT:rsvp_msg_pacing_timer - timer expired 01:02:09:RSVP-MSG-MGR (140.4.4.2):Dequeueing element 27000405 of type 3 from msg-pacing 01:02:09:RSVP-RATE-LIMIT:rsvp_msg_pacing_send_qe:sending psb (qe 27000405)debug ip rsvp reliable-msg
To display debugging messages for Resource Reservation Protocol (RSVP) reliable messages events, use the debug ip rsvp reliable-msgcommand in privileged EXEC mode. To disable debugging output, use the no form of this command.
Examples
The following command shows how to enable debugging for RSVP reliable messages events:
Router# debug ip rsvp reliable-msg
RSVP reliable-msg debugging is on
In the following display, message IDs, acknowledgments (ACKs), and message processes including retransmissions, appear:
01:07:37:RSVP-RMSG:Inserted msg id(0x46, 0x48000403) on local msgid db 01:07:37:RSVP-RMSG:rsvp_rmsg_process_acks, Handle:000C1701 neighbor:140.4.4.2 01:07:37:RSVP-RMSG:max_ids:1 q_sz:1 msg_sz:1500 ids_len:1432 num_objs:0 obj_len:0 nbr:140.4.4.2 01:07:39:%LINK-3-UPDOWN:Interface Tunnel100, changed state to up 01:07:40:%LINEPROTO-5-UPDOWN:Line protocol on Interface Tunnel100, changed state to up 01:08:07:RSVP-RMSG:rsvp_rmsg_process_acks, Handle:000C1701 neighbor:140.4.4.2 01:08:07:RSVP-RMSG:max_ids:1 q_sz:1 msg_sz:1500 ids_len:1432 num_objs:0 obj_len:0 nbr:140.4.4.2 01:08:37:RSVP-RMSG:max_ids:1 q_sz:1 msg_sz:1500 ids_len:1424 num_objs:1 obj_len:8 nbr:140.4.4.2 01:08:37:RSVP-RMSG:rsvp_rmsg_process_immediate_tmb, Handle:2D000404 neighbor:140.4.4.2 01:08:37:RSVP-RMSG:Inserted msg id(0x47, 0x2D000404) on local msgid db 01:08:37:RSVP-RMSG:current queue:immed next_queue:rxmt-1 (qe 2D000404s) 01:08:37:RSVP-RMSG:rsvp_rmsg_process_acks, Handle:000C1701 neighbor:140.4.4.2 01:08:37:RSVP-RMSG:max_ids:1 q_sz:1 msg_sz:1500 ids_len:1432 num_objs:0 obj_len:0 nbr:140.4.4.2 01:08:38:RSVP-RMSG:rsvp_rmsg_process_rxmt_tmb, Handle:2D000404 neighbor:140.4.4.2 01:08:38:RSVP-RMSG:An ack was received for tmb 2D000404 on neighbor 140.4.4.2 01:09:07:RSVP-RMSG:max_ids:1 q_sz:1 msg_sz:1500 ids_len:1424 num_objs:1 obj_len:8 nbr:140.4.4.2 01:09:07:RSVP-RMSG:rsvp_rmsg_process_immediate_tmb, Handle:2E000404 neighbor:140.4.4.2 01:09:07:RSVP-RMSG:Inserted msg id(0x48, 0x2E000404) on local msgid db 01:09:07:RSVP-RMSG:current queue:immed next_queue:rxmt-1 (qe 2E000404s) 01:09:07:RSVP-RMSG:rsvp_rmsg_process_acks, Handle:000C1701 neighbor:140.4.4.2 01:09:07:RSVP-RMSG:max_ids:1 q_sz:1 msg_sz:1500 ids_len:1432 num_objs:0 obj_len:0 nbr:140.4.4.2 01:09:08:RSVP-RMSG:rsvp_rmsg_process_rxmt_tmb, Handle:2E000404 neighbor:140.4.4.2 01:09:08:RSVP-RMSG:An ack was received for tmb 2E000404 on neighbor 140.4.4.2 01:09:37:RSVP-RMSG:max_ids:1 q_sz:1 msg_sz:1500 ids_len:1424 num_objs:1 obj_len:8 nbr:140.4.4.2 01:09:37:RSVP-RMSG:rsvp_rmsg_process_immediate_tmb, Handle:2F000404 neighbor:140.4.4.2 01:09:37:RSVP-RMSG:Inserted msg id(0x49, 0x2F000404) on local msgid db 01:09:37:RSVP-RMSG:current queue:immed next_queue:rxmt-1 (qe 2F000404s) 01:09:37:RSVP-RMSG:rsvp_rmsg_process_acks, Handle:000C1701 neighbor:140.4.4.2 01:09:37:RSVP-RMSG:max_ids:1 q_sz:1 msg_sz:1500 ids_len:1432 num_objs:0 obj_len:0 nbr:140.4.4.2 01:09:38:RSVP-RMSG:rsvp_rmsg_process_rxmt_tmb, Handle:2F000404 neighbor:140.4.4.2 01:09:38:RSVP-RMSG:An ack was received for tmb 2F000404 on neighbor 140.4.4.2debug ip rsvp sbm
To display detailed information about Subnetwork Bandwidth Manager (SBM) messages only, and SBM and Designated Subnetwork Bandwidth Manager (DSBM) state transitions, use the debug ip rsvp sbmcommand in privileged EXEC mode. To disable debugging output, use the no form of this command.
Usage Guidelines
The debug ip rsvp sbmcommand provides information about messages received, minimal detail about the content of these messages, and information about state transitions.
Examples
The following example shows the detailed debug information about SBM and the SBM and DSBM state transitions that is available when you enable debug mode through the debug ip rsvp sbm command:
Router# debug ip rsvp sbm RSVP debugging is on router2# *Dec 31 16:45:34.659: RSVP: send I_AM_DSBM message from 145.2.2.150 *Dec 31 16:45:34.659: RSVP: IP to 224.0.0.17 length=88 checksum=9385 (Ethernet2) *Dec 31 16:45:34.659: RSVP: version:1 flags:0000 type:I_AM_DSBM cksum:9385 ttl:254 reserved:0 length:88 *Dec 31 16:45:34.659: DSBM_IP_ADDR type 1 length 8 : 91020296 *Dec 31 16:45:34.659: HOP_L2 type 1 length 12: 00E01ECE *Dec 31 16:45:34.659: : 0F760000 *Dec 31 16:45:34.659: SBM_PRIORITY type 1 length 8 : 0029B064 *Dec 31 16:45:34.659: DSBM_TIMERS type 1 length 8 : 00000F05 *Dec 31 16:45:34.659: SBM_INFO type 1 length 44: 00000000 *Dec 31 16:45:34.659: : 00240C02 00000007 *Dec 31 16:45:34.659: : 01000006 7F000005 *Dec 31 16:45:34.659: : 00000000 00000000 *Dec 31 16:45:34.663: : 00000000 00000000 *Dec 31 16:45:34.663: : 00000000 *Dec 31 16:45:34.663:debug ip rsvp sso
To display debugging output for Resource Reservation Protocol (RSVP) signaling when the graceful restart feature is configured, use the debug ip rsvp ssocommand in privileged EXEC mode. To disable debugging, use the no form of this command.
Usage Guidelines
This command displays debugging output from RSVP signaling during and after the Route Processor (RP) stateful switchover when system control and routing protocol execution is transferred from the active RP to the redundant standby RP. The SSO process occurs when the active router becomes unavailable, so that no interruption of network services occurs. The command displays information about the activities that RSVP performs when you configure a graceful restart, such as:
- Writing checkpointing information into the write database when a new traffic engineering (TE) label switched path (LSP) is signaled on the active RP
- Recovering the LSP checkpointed information from the read database after SSO
- Displaying information about LSPs not recovered
Examples
The following is sample output from the debug ip rsvp ssocommand that was displayed during a successful SSO on the standby router as it became active:
Router# debug ip rsvp sso
RSVP sso debugging is on
Router#
NoteThe prefix in the debug output is composed of LSP 5-tuples in the following format: 10.0.0.3_61->10.0.0.9_10[10.0.0.3]. The 10.0.0.3 represents the source address, the 61 represents the LSP ID, the 10.0.0.9 represents the tunnel destination (tunnel tail), the10 represents the tunnel ID, and the [10.0.0.3] represents the extended tunnel ID.
*May 12 20:12:38.175: RSVP-HA: begin recovery, send msg to RSVP
*May 12 20:12:38.175: RSVP: 10.0.0.3_61->10.0.0.9_10[10.0.0.3]: event: new Path received during RSVP or IGP recovery period
*May 12 20:12:38.175: RSVP: 10.0.0.3_61->10.0.0.9_10[10.0.0.3]: rsvp_ha_sb_event_new_path_received: lsp_info found, attempt to recover lsp
*May 12 20:12:38.175: RSVP: 10.0.0.3_61->10.0.0.9_10[10.0.0.3]: set psb_is_recovering flag
*May 12 20:12:38.179: RSVP: 10.0.0.3_61->10.0.0.9_10[10.0.0.3]:rsvp_ha_sb_set_path_info: Recovering: Set next_hop and next_idb in psb
*May 12 20:12:38.179: RSVP: 10.0.0.3_61->10.0.0.9_10[10.0.0.3]:rsvp_ha_mark_lsp_if_recoverable: LSP is recoverable (ERO expansion. not needed)
*May 12 20:12:38.179: RSVP-HA: rsvp_ha_sb_handle_recovery_start: Recovery period start: set GR recovery time.
*May 12 20:12:38.179: RSVP_HA: checkpoint hello_globals_info
*May 12 20:12:38.179: RSVP-HELLO: rsvp_ha_update_all_gr_hi: Updating all GR HIs with new src_instance
*May 12 20:12:38.183: RSVP: 10.0.0.3_61->10.0.0.9_10[10.0.0.3]: prevent populating output; LSP is recovering
*May 12 20:12:38.187: RSVP: 10.0.0.3_61->10.0.0.9_10[10.0.0.3]: prevent populating output; LSP is recovering
*May 12 20:12:38.939: RSVP: 10.0.0.3_61->10.0.0.9_10[10.0.0.3]:
rsvp_ha_sb_event_new_resv_received: event: Resv for LSP received during recovery period
*May 12 20:12:38.943: RSVP: 10.0.0.3_61->10.0.0.9_10[10.0.0.3]:
rsvp_ha_event_lsp_create_head: psb found
*May 12 20:12:38.943: RSVP: 10.0.0.3_61->10.0.0.9_10[10.0.0.3]:
rsvp_ha_event_lsp_create_head: event: LSP created at head-end, try to checkpoint it
*May 12 20:12:38.943: RSVP: 10.0.0.3_61->10.0.0.9_10[10.0.0.3]: LSP was checkpointed
*May 12 20:12:38.943: RSVP-HA: 10.0.0.3_61->10.0.0.9_10[10.0.0.3]: rsvp_ha_sb_event_lsp_head_recovered: event: LSP head was recovered
*May 12 20:12:38.943: RSVP-HA: recovery period over, send msg to RSVP
*May 12 20:12:38.947: RSVP-HA: rsvp_ha_sb_handle_recovery_end: Deleting state for LSPs not recovered
Router#
The following example shows how to turn debugging off for this command:
Router# no debug ip rsvp sso
RSVP sso debugging is off
Related Commands
Command
Description
debug ip rsvp high-availability
Displays debugging output for RSVP-TE HA activities that improve the accessibility of network resources.
debug mpls traffic-eng ha sso
Displays debugging output for MPLS traffic engineering HA activities during the graceful switchover from an active RP to a redundant standby RP.
debug ip rsvp summary-refresh
To display debugging messages for Resource Reservation Protocol (RSVP) summary-refresh messages events, use the debug ip rsvp summary-refreshcommand in privileged EXEC mode. To disable debugging output, use the no form of this command.
Examples
The following command shows how to enable debugging for RSVP summary-refresh messages events:
Router# debug ip rsvp summary-refresh
RSVP summary-refresh debugging is on
In the following output, the IP addresses, the interfaces, the types of RSVP messages (Path and Resv), message IDs, and epoch identifiers (for routers) for which RSVP summary-refresh events occur are shown:
01:11:00:RSVP-SREFRESH:Incoming message from nbr 140.4.4.2 with epoch:0xE1A1B7 msgid:0x84 on Ethernet1
01:11:00:RSVP-SREFRESH 140.20.1.1_18->140.75.1.1_100[140.20.1.1]:Created msgid 0x84 for nbr 140.4.4.2
01:11:02:%LINK-3-UPDOWN:Interface Tunnel100, changed state to up
01:11:03:%LINEPROTO-5-UPDOWN:Line protocol on Interface Tunnel100, changed state to up
01:11:30:RSVP-SREFRESH:140.20.1.1_18->140.75.1.1_100[140.20.1.1]:Path, ID:0x4C :Start using Srefresh to 140.4.4.2
01:11:31:RSVP-SREFRESH:Incoming message from nbr 140.4.4.2 with epoch:0xE1A1B7 msgid:0x84 on Ethernet1
01:11:31:RSVP-SREFRESH:State exists for nbr:140.4.4.2 epoch:0xE1A1B7 msgid:0x84
01:12:00:RSVP-SREFRESH:Preparing to Send Srefresh(es) to 140.4.4.2, 1 IDs Total
01:12:00:RSVP-SREFRESH:Sending 1 IDs in this Srefresh
01:12:00:RSVP-SREFRESH:140.20.1.1_18->140.75.1.1_100[140.20.1.1]:Path, ID:0x4C
01:12:01:RSVP-SREFRESH:Incoming message from nbr 140.4.4.2 with epoch:0xE1A1B7 msgid:0x86 on Ethernet1
01:12:01:RSVP-SREFRESH:Rec'd 1 IDs in Srefresh from 140.4.4.2 (on Ethernet1), epoch:0xE1A1B7 msgid:0x86
01:12:01:RSVP-SREFRESH:140.20.1.1_18->140.75.1.1_100[140.20.1.1]:Resv, ID:0x84
01:12:30:RSVP-SREFRESH:Preparing to Send Srefresh(es) to 140.4.4.2, 1 IDs Total
01:12:30:RSVP-SREFRESH:Sending 1 IDs in this Srefresh
01:12:30:RSVP-SREFRESH:140.20.1.1_18->140.75.1.1_100[140.20.1.1]:Path, ID:0x4C
01:12:31:RSVP-SREFRESH:Incoming message from nbr 140.4.4.2 with epoch:0xE1A1B7 msgid:0x88 on Ethernet1
01:12:31:RSVP-SREFRESH:Rec'd 1 IDs in Srefresh from 140.4.4.2 (on Ethernet1), epoch:0xE1A1B7 msgid:0x88
01:12:31:RSVP-SREFRESH:140.20.1.1_18->140.75.1.1_100[140.20.1.1]:Resv, ID:0x84
01:13:00:RSVP-SREFRESH:Preparing to Send Srefresh(es) to 140.4.4.2, 1 IDs Total
01:13:00:RSVP-SREFRESH:Sending 1 IDs in this Srefresh
01:13:00:RSVP-SREFRESH:140.20.1.1_18->140.75.1.1_100[140.20.1.1]:Path, ID:0x4C
01:13:01:RSVP-SREFRESH:Incoming message from nbr 140.4.4.2 with epoch:0xE1A1B7 msgid:0x8A on Ethernet1
01:13:01:RSVP-SREFRESH:Rec'd 1 IDs in Srefresh from 140.4.4.2 (on Ethernet1), epoch:0xE1A1B7 msgid:0x8A
01:13:01:RSVP-SREFRESH:140.20.1.1_18->140.75.1.1_100[140.20.1.1]:Resv, ID:0x84
NoteIn the preceding output, notice the message IDs that correspond to Path or Resv state being refreshed. Because the entire message does not have to be transmitted, there is less data and network performance is improved.
debug ip rsvp traffic-control
To display debugging messages for compression-related events, use the debug ip rsvp traffic-control command inprivilegedEXEC mode. To disable debugging output, use the no form of this command.
Command History
Release
Modification
12.0
This command was introduced.
12.2(15)T
This command was modified. The command output was modified to include compression-related events.
12.0(24)S
This command was integrated into Cisco IOS Release 12.0(24)S.
12.2(14)S
This command was integrated into Cisco IOS Release 12.2(14)S.
12.2(18)SXF2
This command was integrated into Cisco IOS Release 12.2(18)SXF2.
12.2(33)SRA
This command was integrated into Cisco IOS Release 12.2(33)SRA.
Cisco IOS XE Release 2.6
This command was integrated into Cisco IOS XE Release 2.6.
Usage Guidelines
Use the debug ip rsvp traffic-control command to troubleshoot compression-related problems.
Examples
The following example from the debug ip rsvp traffic-control command shows that compression was successfully predicted:
Router# debug ip rsvp traffic-control
RSVP debugging is on
Router# show debugging
00:44:49: RSVP-TC: Attempting to install QoS for rsb 62CC66F0
00:44:49: RSVP-TC: Adding new tcsb 02000406 for rsb 62CC66F0
00:44:49: RSVP-TC: Assigning WFQ QoS (on FR VC 101) to tcsb 02000406
00:44:49: RSVP-TC: Predicted compression for TCSB 2000406:
00:44:49: RSVP-TC:   method      = rtp
00:44:49: RSVP-TC:   context ID  = 2
00:44:49: RSVP-TC:   factor      = 82 percent
00:44:49: RSVP-TC:   bytes-saved = 36 bytes
00:44:49: RSVP-TC: Bandwidth check: requested bw=65600 old bw=0
00:44:49: RSVP-TC: RSVP bandwidth is available
00:44:49: RSVP-TC: Consulting policy for tcsb 02000406
00:44:49: RSVP-TC: Policy granted QoS for tcsb 02000406
00:44:49: RSVP-TC: Requesting QoS for tcsb 02000406
00:44:49: RSVP-TC:    ( r = 8200       bytes/s   M = 164        bytes
00:44:49: RSVP-TC:      b = 328        bytes     m = 164        bytes )
00:44:49: RSVP-TC:      p = 10000      bytes/s   Service Level = priority
00:44:49: RSVP-WFQ: Update for tcsb 02000406 on FR PVC dlci 101 on Se3/0
00:44:49: RSVP-WFQ: Admitted 66 kbps of bandwidth
00:44:49: RSVP-WFQ: Allocated PRIORITY queue 24
00:44:49: RSVP-TC: Allocation succeeded for tcsb 02000406
The following example from the debug ip rsvp traffic-control command shows that compression was unsuccessfully predicted because no compression context IDs were available:
Router# debug ip rsvp traffic-control RSVP debugging is on Router# show debugging 00:10:16:RSVP-TC:Attempting to install QoS for rsb 62CED62C 00:10:16:RSVP-TC:Adding new tcsb 01000421 for rsb 62CED62C 00:10:16:RSVP-TC:Assigning WFQ QoS (on FR VC 101) to tcsb 01000421 00:10:16:RSVP-TC:sender's flow is not rtp compressible for TCSB 1000421 00:10:16: reason: no contexts available 00:10:16:RSVP-TC:sender's flow is not udp compressible for TCSB 1000421 00:10:16: reason: no contexts available 00:10:16:RSVP-TC:Bandwidth check:requested bw=80000 old bw=0 00:10:16:RSVP-TC:RSVP bandwidth is available 00:10:16:RSVP-TC:Consulting policy for tcsb 01000421 00:10:16:RSVP-TC:Policy granted QoS for tcsb 01000421 00:10:16:RSVP-TC:Requesting QoS for tcsb 01000421 00:10:16:RSVP-TC: ( r = 10000 bytes/s M = 200 bytes 00:10:16:RSVP-TC: b = 400 bytes m = 200 bytes ) 00:10:16:RSVP-TC: p = 10000 bytes/s Service Level = priority 00:10:16:RSVP-WFQ:Update for tcsb 01000421 on FR PVC dlci 101 on Se3/0 00:10:16:RSVP-WFQ:Admitted 80 kbps of bandwidth 00:10:16:RSVP-WFQ:Allocated PRIORITY queue 24 00:10:16:RSVP-TC:Allocation succeeded for tcsb 01000421debug ip rsvp wfq
To display debugging messages for the weighted fair queue (WFQ), use the debug ip rsvp wfqcommand in privileged EXEC mode. To disable debugging output, use the no form of this command.
Command History
Release
Modification
12.1(3)T
This command was introduced.
12.0(24)S
This command was integrated into Cisco IOS Release 12.0(24)S.
12.2(14)S
This command was integrated into Cisco IOS Release 12.2(14)S.
12.2(18)SXF2
This command was integrated into Cisco IOS Release 12.2(18)SXF2.
12.2(33)SRA
This command was integrated into Cisco IOS Release 12.2(33)SRA.
Cisco IOS XE Release 2.6
This command was integrated into Cisco IOS XE Release 2.6.
Examples
The following is sample output from the debug ip rsvp wfq command:
Router# debug ip rsvp wfq
RSVP debugging is on
Router# show debugging
IP RSVP debugging is on
IP RSVP debugging (Traffic Control events) is on
IP RSVP debugging (WFQ events) is on
Router#
03:03:23:RSVP-TC:Attempting to install QoS for rsb 6268A538
03:03:23:RSVP-TC:Adding new tcsb 00001A01 for rsb 6268A538
03:03:23:RSVP-TC:Assigning WFQ QoS to tcsb 00001A01
03:03:23:RSVP-TC:Consulting policy for tcsb 00001A01
03:03:23:RSVP-TC:Policy granted QoS for tcsb 00001A01
03:03:23:RSVP-TC:Requesting QoS for tcsb 00001A01
03:03:23:RSVP-TC:   ( r = 12500      bytes/s   M = 1514       bytes
03:03:23:RSVP-TC:     b = 1000       bytes     m = 0          bytes )
03:03:23:RSVP-TC:     p = 12500      bytes/s   Service Level = non-priority
03:03:23:RSVP-WFQ:Requesting a RESERVED queue on Et0/1 for tcsb 00001A01
03:03:23:RSVP-WFQ:Queue 265 allocated for tcsb 00001A01
03:03:23:RSVP-TC:Allocation succeeded for tcsb 00001A01
Router#
Router# no debug ip rsvp wfq
RSVP debugging is off