If you are involved in the operation of an IP network, a question you may hear is: "How good is your network?" Or, to put it
another way, how can you measure and monitor the quality of the service that you are offering to your customers? And how can your
customers monitor the quality of the service you provide to them?
These questions have been lurking behind many public and enterprise IP networks for many years now. With the increasing levels of
deployment of various forms of high-speed (or broadband) services within today's Internet there is new impetus to find some usable
answers that allow both providers and users to place some objective benchmarks against the service offerings. With the lift in
access speed with broadband services, there is an associated expectation on the part of the end user or service customer about the
performance of the Internet service. It should be "better" in some fashion, where "better" relates to the performance of the
network and the service profile that is offered to network applications. And not only is there an expectation of "better"
performance, it should be measurable. This article looks at network performance and explores its definition and
measurement.
An informal functional approach to a definition of network performance is measuring the speed of the network. How fast is the
network? Or, what is the elapsed time for a particular network transaction? Or, how quickly can I download a data file? This
measurement of time for a network transaction to complete certainly relates to the speed of the network, and speed is a good
network performance benchmark, but is speed everything?
When looking at the broad spectrum of performance, the answer is that speed is not everything. The ability of a network to support
transactions that include the transfer of large volumes of data, as well as supporting a large number of simultaneous transactions,
is also part of the overall picture of network load and hence of network performance. But large data sets is not everything in
performance. Consideration should also be given to the class of network applications where the data is implicitly clocked according
to some external clock source. Such real-time applications include interactive voice and video, and their performance requirements
include the total delay between the end points, or latency, as well as the small-scale variation of this latency, or
jitter. Such performance measurements also include the ratio of discarded packets to the total number of packets sent, or
loss rate, as well as the extent to which a sequence of packets is reordered within the network, or even duplicated by the network.
Taken together, this set of performance factors can be considered as a form of the amount of distortion of the original real-time
signal.
Accordingly, a functional description of network performance encompasses a description of speed, capacity, and distortion of
transactions that are carried across the network. This informal description of what constitutes network performance certainly feels
to be on the correct path, given that if one knew the latency, available bandwidth, loss, and jitter rates and packet reorder
probability as a profile of network performance between two network end points, as well as the characteristics of the network
transaction, it is possible to make a reasonable prediction relating to the performance of the transaction.
Taking this informal definition, the next step is to create a more rigorous framework for measuring performance. For any single
network path between an entry and egress point, it is possible to measure the path latency, available peak bandwidth, loss rates,
jitter profile, and reorder probability. But there is a difference between a description of the performance of a particular path
across a network and the performance of the network as an aggregate entity. Given a set of per-path performance measurements, how
can you construct a view of the performance of the network? A common methodology is to take a relatively complete set of path
measurements across a network and then combine them to create an average metric. Although this accomplishes a useful reduction in
the size of the data, there is also a loss of information. The average network performance measurements have little relationship to
the performance of any individual path.
There are various ways to improve this loss of information, including weighting the individual path measurements by the amount of
traffic passed along the path. Such techniques are indeed to ensure that paths that use far-flung network outliers that carry
relatively low volumes of traffic have a much lower impact on the overall network performance metric than the major network transit
paths.
Given these performance indicators, the next step is to determine how these indicators may be measured, and how the resulting
measurements can be meaningfully interpreted. At this point it is useful to look at numerous popular network management and
measurement tools and examine their ability to provide useful measurements. There are two basic approaches to this task; one is to
collect management information from the active elements of the network using a management protocol, and from this information make
some inferences about network performance. This can be termed a passive approach to performance measurement, in that the
approach attempts to measure the performance of the network without disturbing its operation. The second approach is to use an
active approach and inject test traffic into the network and measure its performance in some fashion, and relate the performance of
the test traffic to the performance of the network in carrying the normal payload.
In IP networks the ubiquitous network management tool is the Simple Network Management Protocol (SNMP). There is no doubt
that SNMP can provide a wealth of data about the operational status of each management network element, but can it tell you
anything about the overall network performance?
The operation of SNMP is a polling operation, where a management station directs periodic polls to various managed
elements and collects the responses. These responses are used to update a view of the operating status of the network.
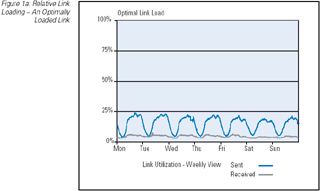
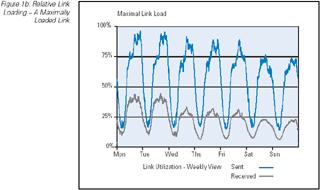
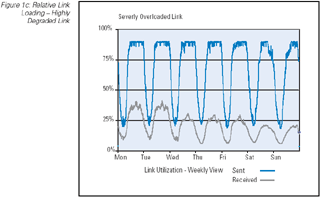
The most basic tool for measuring network performance is the periodic measurement of the interface byte counters. Such measurements
can provide a picture of the current traffic levels on the network link, and when related to the total capacity of the link, the
relative link loading level can be provided. As a performance indicator this relative link loading level can provide some
indication of link performance, in that a relatively lightly loaded link (such as a load of 5 to 10 percent of total available
capacity) would normally indicate a link that has no significant performance implications, whereas a link operating at 100 percent
of total available capacity would likely be experiencing high levels of packet drop, queuing delay, and potentially a high jitter
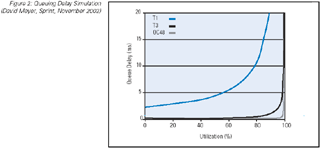
level. (Figure 1) In between these two extremes there are performance implications of increasing the load. Of course it should be
noted that the characteristics of the link have a bearing on the interpretation of the load levels, and a low-latency 10-Gbps link
operating at 90-percent load will have very significantly lower levels of performance degradation than a 2-Mbps high-latency link
under the same 90-percent load. (Figure 2)
Figure 1a: Relative Link Loading — An Optimally Loaded Link

Figure 1b: Relative Link Loading — A Maximally Loaded Link

Figure 1c: Relative Link Loading — Highly Degraded Link

Figure 2: Queuing Delay Simulation (David Meyer, Sprint, November 2002)

Relative traffic load on each link can be complemented by measurement of performance-related SNMP counters. A management system can
poll each active network element to retrieve the number of packets dropped for each interface, and the number of packets
successfully forwarded. From these two data items, the relative drop proportion of packets can be calculated on an
element-by-element and potentially a link-by-link basis, and a series of element measures can provide a per-path drop proportion by
combining the individual packet-forwarding measurements for the interfaces on the path.
Bacause some count of relative packet drop rate can be gathered from each network element, with the additional input of the current
forwarding state of the network it is possible to predict the path a packet will take through the network, and hence estimate the
path probability of drop. However, this information is still well short of being a reliable measurement of service
performance.
Queuing delay is somewhat more challenging to measure on an element-by-element basis using element polling with SNMP. In theory,
the polling system could use a rapid sequence of polling the output queue length of a router and estimating the queuing delay based
on an average packet size estimate, together with the knowledge of the available output capacity. Of course, such a measurement
methodology assumes a simple first-in, first-out (FIFO) queuing discipline, a queue size that varies slowly over time, and
slow link speeds. Such assumptions are rarely valid in today's IP networks. As the link speed increases, the queue size may
oscillate with a relatively high frequency as a function of both the number and capacity of the input systems and of the capacity
of the output system. In general, queuing delay is not easily measured using network element polling.
There is no ready way for a polling mechanism to detect and count the incidence of reordered packets. Packet reordering occurs in
many situations, including the use of parallel switching fabrics within a single network element and the use of parallel links
between routers.
IP routers are not typically designed to detect, let alone correct, packet reordering and because they do not detect this
condition, they cannot report on the incidence of reordering via SNMP polling.
The generic approach of network management polling systems is that the polling agent, the network management station, is configured
with an internal model of the network; status information, gathered through element polling, is integrated to the network model.
The correlation of the status of the model to the status of the network itself is intended to be accurate enough to allow
operational anomalies in the network to be recognized and flagged. The challenge is that a sequence of snapshots of element status
values cannot readily be reconstructed into a comprehensive view of the performance of the network as an entire system, or even as
a collection of edge-to-edge paths. Measurement techniques using polling and modeling can track the performance of the individual
elements of the network, but they cannot track per-path service levels across the network. The network-element polling approach can
indicate whether or not each network element is operating within the configured operational parameters, and alert the network
operator when there are local anomalies to this condition. But such a view is best described as network centric, rather
than service centric. An implicit assumption is that if the network is operating within the configured parameters, then all
service-level commitments are being met. This assumption may not be well founded.
The complementary approach to performance instrumentation of network elements is active network probing. This requires the
injection of marked packets into the data stream; collection of the packets at a later time; and correlation of the entry and exit
packets to infer some information regarding delay, drop, and fragmentation conditions for the path traversed by the packet. The most
common probe tools in the network today are ping and traceroute.
The best known, and most widely used active measurement tool is ping. Ping is a very simple tool: a sender generates an
Internet Control Message Protocol (ICMP) echo request packet, and directs it to a target system. As the packet is sent,
the sender starts a timer. The target system simply reverses the ICMP headers and sends the packet back to the sender as an ICMP
echo reply. When the packet arrives at the original sender's system, the timer is halted and the elapsed time is reported. An
example ping output is shown in Figure 3.
Figure 3: Example Ping Report

This simple active sampling technique can reveal a wealth of information. A ping response indicates that the target host is
connected to the network, is reachable from the query agent, and is in a sufficiently functional state to respond to the ping
packet. In itself, this response is useful information, indicating that a functional network path to the target host exists.
Failure to respond is not so informative because it cannot be reliably inferred that the target host is not available. The ping
packet, or perhaps its response, may have been discarded within the network because of transient congestion, or the network may not
have a path to the target host, or the network may not have a path back to the ping sending host, or there may be some form of
firewall in the end-to-end path that blocks the ICMP packet from being delivered.
However, if you can ping a remote IP address, then you can obtain numerous performance metrics. Beyond simple reachability, further
information can be inferred by the ping approach with some basic extensions to our simple ping model. If a sequence of labeled ping
packets is generated, the elapsed time for a response to be received for each packet can be recorded, along with the count of
dropped packets, duplicated packets, and packets that have been reordered by the network. Careful interpretation of the response
times and their variance can provide an indication of the load being experienced on the network path between the query agent and
the target. Load will manifest a condition of increased delay and increased variance, due to the interaction of the router buffers
with the traffic flows along the path elements as load increases. When a router buffer overflows, the router is forced to discard
packets; and under such conditions, increased ping loss is observed. In addition to indications of network load, high erratic delay
and loss within a sequence of ping packets may be symptomatic of routing instability with the network path oscillating between many
path states.
A typical use of ping is to regularly test numerous paths to establish a baseline of path metrics. This enables a comparison of a
specific ping result to these base metrics to give an indication of current path load within the network.
Of course, it is possible to interpret too much from ping results, particularly when pinging routers within a network. Many router
architectures use fast switching paths for data packets, whereas the central processing unit of the router may be used to process
ping requests. The ping response process may be given a low scheduling priority because router operations represent a more critical
router function. It is possible that extended delays and loss, as reported by a ping test, may be related to the processor load or
scheduling algorithm of the target router processor rather than to the condition of the network path. (Figure 4)
Figure 4: Ping Path

Ping sequences do not necessarily mimic packet flow behavior of applications. Typical TCP flow behavior is prone to cluster into
bursts of packet transmissions on each epoch of the round-trip time. Routers may optimize their cache management, switching
behavior, and queue management to take advantage of this behavior. Ping packets may not be clustered; instead, an evenly spaced
pacing is used, meaning that the observed metrics of a sequence of ping packets may not exercise such router optimizations.
Accordingly, the ping results may not necessarily reflect an anticipation of application performance along the same path. Also a
ping test does not measure a simple path between two points. The ping test measures the time to send a packet to a target system
and for the target to respond back to the sender. Ping is measuring a loop rather than a simple path.
With these caveats in mind, monitoring a network through regular ping tests along the major network paths can yield useful
information regarding the status of the network service performance.
Many refinements to ping can extend its utility. Ping can use loose source routing to test the reachability of one host to
another, directing the packet from the query host to the loose source routed host, then to the target host and back via the same
path through the specified approach. However, many networks disable support for loose source routing, given that it can be
exploited in some forms of security attacks. Consequently, the failure of a loose source routed ping may not be a conclusive
indication of a network fault.
Ping also can be used in a rudimentary way to discover the provisioned capacity of network links. By varying the packet length and
comparing the ping times of one router to the next-hop router on a path, the bandwidth of the link can be deduced with some degree
of approximation required because of a background queue-induced level of network jitter.
A more sophisticated variation of pingis to pace the transmission of packets from the received packets, mimicking the behavior of
the TCP flow control algorithms with Slow Start and subsequent congestion avoidance. Treno is such a tool. In
Treno, the transmission of ping packets is managed by the TCP Reno flow-control algorithm, such that further ping packets are
triggered by the reception of responses to earlier packets, and the triggering of further packets is managed by an implementation
of the TCP control function. Such a tool can indicate available flow rate-managed capacity on a chosen path.
The second common ICMP-based network management tool, traceroute , devised by Van Jacobson, is based on the ICMP Time
Exceeded message. Here, a sequence of User Datagram Protocol (UDP) packets are generated to the target host, each
with an increased value of the Time To Live (TTL) field in the IP header. This generates a sequence of ICMP Time Exceeded
messages sourced from the router where the TTL expired. These source addresses are those of the routers, in turn, on the path from
the source to the destination. (Figure 5)
Figure 5: Traceroute Path

Like ping, traceroute measures the elapsed time between the packet transmission and the reception of the corresponding ICMP packet.
In this way, the complete output of a traceroute execution exposes not only the elements of the path to the destination, but also
the delay and loss characteristics of each partial path element. Traceroute also can be used with loose source route options to
uncover the path between two remote hosts. The same caveats mentioned in the ping description relating to the relative paucity in
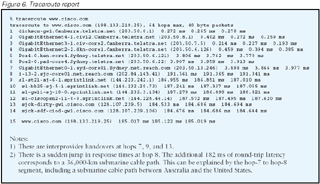
deployment of support for loose source routing apply. An example of a traceroute report is shown in Figure 6.
Figure 6: Traceroute report

Traceroute is an excellent tool for reporting on the state of the routing system. It operates as an excellent "sanity check" of the
match between the design intent of the routing system and the operational behavior of the network.
The caveat to keep in mind when interpreting traceroute output has to do with asymmetric routes within the network. Whereas the
per-hop responses expose the routing path taken in the forward direction to the target host, the delay and loss metrics are
measured across the forward and reverse paths for each step in the forward path. The reverse path is not explicitly visible to
traceroute.
Round-trip probes, such as ping and traceroute, are suited to measuring the total network path between two ends of a transaction,
but how can a network provider measure the characteristics of a component of the total end-to-end path? In such a case the network
provider is interested in the performance of a set of unidirectional transit paths from an network ingress point to an egress
point. There are now some techniques that perform a one-way delay and loss measurement, and they are suited to measuring the
service parameters of individual transit paths across a network. A one-way approach does not use a single network management
system, but relies on the deployment of probe senders and receivers using synchronized clocks.
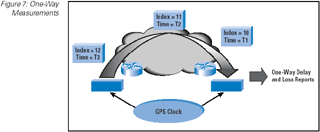
The one-way methodology is relatively straightforward. The sender records the precise time a certain bit of the probe packet was
transmitted into the network; the receiver records the precise time that same bit arrived at the receiver. Precisely synchronizing
the clocks of the two systems is an interesting problem, and initial implementations of this approach have used Global
Positioning System (GPS) satellite receivers as a synchronized clock source.
One of the noted problems with the use of GPS was that computers are generally located within machine rooms and a clear GPS signal
is normally available only on a rooftop. Later implementations of this approach have used the clock associated with the Code
Division Multiple Access (CDMA) mobile telephone network as a highly accurate, synchronized, distributed clock source, with
the advantage that the time signal is usually available close to the measurement unit.
Consequent correlation of the sender's and receiver's data from repeated probes can reveal the one-way delay and loss patterns
between sender and receiver. To correlate this to a service level requires the packets to travel along the same path as the service
flow and with the same scheduling response from the network.
Figure 7: One-Way Measurements

Ping and traceroute are ubiquitous tools. Almost every device can support sending ping and traceroute probes, and, by default
almost every device, including network routers, will respond to a ping or traceroute probe. One-way measurements are a different
matter, and such measurements normally require the use of dedicated devices in order to undertake the clocking of the probes with
the required level of precision (Figure 7).
Whether it is an active or passive measurement regime, the next basic decision is the time base to use for the measurements. Many
applications are very sensitive to short-lived transient network conditions. This may take the form of a burst of packet loss, or a
period of packet reordering, or a switch to a longer round trip time. TCP may react by halving its sending rate, or by entering an
extended wait state while awaiting the retransmission timer to expire. In either case it will take numerous round trip time
intervals for the transport session to recover, and this may impact the behavior of the application. On the other hand, a periodic
network probe may miss the transient event altogether and report no abnormalities whatsoever.
IP networks have bursty traffic sources, and there is a marked self-similarity in the traffic patterns. This appears to be
consistent over a wide range of networks, where large-capacity systems tend to observe large burst patterns and smaller systems
also see bursts of a similar proportionate size. So the question is, what time interval for measurements can provide meaningful
aggregation of information, while at the same time be sensitive enough to report on the outcomes of transient bursts within the
network? Intuitively a measurement time base of hourly measurements is very insensitive to capturing transient bursts, whereas a
time base of a millisecond would generate a massive amount of data, a scenario that would tend to smother the identification of
abnormalities. Interestingly enough, the choice of a measurement base has little to do with the capacity of the links within a
network, but it has a close relationship to the average routing trip time of the individual transport sessions that are active
within the network.
The profile of IP networks is one that is dominated by TCP traffic, and TCP traffic uses a transport control mechanism where the
returning stream of acknowledgement (ACK) packets governs the actions of the sender. This implies that network-based
distortion in the forward data path will not be signaled back to the sender for one complete round-trip time interval, and the
consequent adaptation of the sender to the conditions of the network will take numerous additional round-trip times. The
implication is that in order to capture a comprehensive view of network performance, a time base of 1 to 2 seconds is appropriate.
However, for large networks, such a view generates a massive amount of data. It appears that many networks use a measurement time
base of about 60 to 300 seconds, representing an acceptable compromise between sensitivity of the measurement system and the
consequent volume of measurement data to analyze.
So far the assumption has been that the network operates with a single service level and that probes of the network operate at the
same service level as the network payload. This is certainly a common situation, but the total picture is slightly broader. When
the network provider attempts to create a premium response for certain classes of traffic, and where the customer is paying a
premium tariff to use such a premium service, the question of performance becomes a matter of deep concern to both the provider and
the customer. After all, the customer is now paying a premium for improved performance, so it would help all concerned if this
could be clearly defined and measured.
Solutions exist in both the passive and active polling domains. In the case of SNMP there is a monitoring framework (or Management
Information Base, MIB) relating to the Differentiated Services (DiffServ) model of Quality of Service (QoS), and
also MIBs relating to the Integrated Services (IntServ) QoS model. For the DiffServ MIB, it is first necessary to define
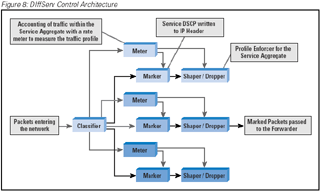
an abstract model of the operation of a DiffServ admission router, by looking at the major functional blocks of the router. The
first of these blocks is the definition of the supported behavior aggregates provided by the network. Within the network path, the
initial active path element is the traffic classification module, which can be modeled as a set of filters and an associated set of
output streams. The output stream is passed to the traffic-conditioning elements, which are the traffic meters and the associated
action elements. Many meter profiles can be used in the model: an average data rate, an exponential weighted moving average of one
of numerous various traffic profiles that can be expressed by a set of token-bucket parameters using an average rate, a peak rate,
and a burst size. More elaborate meter specifications can be constructed using a multilevel token-bucket specification. From the
meter, the traffic is passed through an action filter, which may mark the packets and shape the traffic profile through queues or
discard operations. Together, this sequence of components forms a traffic conditioning block. The traffic is then passed
into a queue through the use of a queuing discipline that applies the desired service behavior. (Figure 8)
Figure 8: DIffServ Control Architecture

From this generic model it is possible to define instrumentation for SNMP polling, where each of these five components—the
behavior aggregate, the classifier, the meter, profile actions, and the queuing discipline—correspond to a MIB table. With
this structure it is possible to parameterize both the specific configuration of the DiffServ network element and its dynamic
state. This MIB is intended to describe the configuration and operation of both edge and interior DiffServ network elements, the
difference being that interior elements use just a behavior aggregate classifier and a queue manager within the management model,
whereas the edge elements use all components of the model.
A comparable MIB is defined for the IntServ architecture and an additional MIB for the operation of guaranteed services. The
IntServ MIB defines the per-element reservation table used to determine the current reservation state, an indication of whether or
not the router can accept further flow reservations, and the reservation characteristics of each current flow. No performance
polling parameters or accounting parameters are included in the MIB. The guaranteed services MIB adds to this definition with a
per-interface definition of a backlog. This is a means of expressing packet quantization delay, a delay term, which is
the packet propagation delay over the interface, and a slack term, which is the amount of slack in the reservation that can be used
without redefining the reservation. Again, these are per-element status definitions, and they do not include performance or
accounting data items.
The IntServ MIB is being further defined as a Resource Reservation Protocol (RSVP) MIB for the operation of IntServ network
elements [14]. There are a larger number of objects within the MIB, including General Objects, Session Statistics Table, Session
Sender Table, Reservation Requests Received Table, Reservation Requests Forwarded Table, RSVP Interface Attributes Table, and an
RSVP Neighbor Table.
Interestingly, the MIB proposes a writeable RSVP reservation table to allow the network manager to manually create a reservation
state that can be removed only through a comparable manual operation. The MIB enables a management system to poll the IntServ
network element to retrieve the status of every active IntServ reserved flow and the operational characteristics of the flow, as
seen by the network element.
In a QoS DiffServ environment, ping and traceroute pose some interesting engineering issues. Ping sends an ICMP packet. The network
QoS admission filters may choose a different classification for these packets from that chosen for normal data-flow TCP or UDP
protocol packets; as a result, the probe packet may be scheduled differently or even take a completely different path to the
network. In an IntServ QoS network, the common classification condition for a flow is a combination of the IP header source and
destination addresses and the TCP or UDP header source and destination port addresses. The ping probe packet cannot reproduce this
complete flow description, and therefore cannot, by default, be inserted into the flow path that it is attempting to measure. With
traceroute, the packet does have a UDP protocol address, but it uses a constant port address by default, causing a similar problem
of attempting to be inserted to an IntServ flow. DiffServ encounters similar problems when attempting to pass the probe packet into
the network via the DiffServ admission classification systems. Inside the network, it is possible to insert the probe packet into
the network with the IP Differentiated Services Code Point (DSCP) field set to the DiffServ behavior aggregate that is
being measured.
The measurement of delay and loss taken by ping and traceroute is a cumulative value of both the forward and return path delay and
loss. When attempting to measure unidirectional flow-path behavior, such as an IntServ flow path, this measurement is of dubious
value, given the level of uncertainty as to which part of the path, forward or reverse, contributed to the ping or traceroute delay
and loss reports.
For one-way delay measurements, in DiffServ networks, this can be done within the network, setting the DSCP field to the value of
the service aggregate being monitored. Of course, from the customer's perspective, the DiffServ network service profile includes
the admission traffic-conditioning block, and the interior one-way measurements are only part of the delivered service. In the
IntServ network, the packets have to be structured to take the same path as the elevated service flows; they are classified by each
element as part of the collection of such elevated service flows for the purposes of scheduling.
From the client's perspective, the measurement choices are more limited. A client does not normally enjoy the ability to poll
network elements within a provider's network. One way for a client to measure service quality is to instigate probing of the
network path, whereby a sender can pass a probe packet into the network and measure the characteristics of the response. Of course,
the problems of inserting probe packets into the service flow remain, as do the issues of unidirectional elevated service flows
with bidirectional probes.
However, the client does have the advantage of being able to monitor and manipulate the characteristics of the service flow itself.
For TCP sessions, the client can monitor the packet retransmission rate, the maximum burst capacity, the average throughput, the
round-trip time (RTT), RTT variance, and misordered packets, by monitoring the state of the outbound data flow and
relating it to the inbound ACK flow. For UDP sessions, there is no corresponding transport-level feedback information flow to the
sender as a part of the transport protocol itself. The receiver can measure the service quality of the received datastream using
information provided in the Real-Time Protocol (RTP) information feedback fields—if RTP is being used for real-time
data or as an application-related tool for other application types. If sender and receiver work in concert, the receiver can
generate periodic quality reports and pass these summaries back to the sender. Such applications can confirm whether an application
is receiving a specified level of service. This approach treats the network like a black box; no attempt is made to identify the
precise nature or source of events that disrupt the delivered service quality. There are no standardized approaches to this
activity, but numerous analysis tools are available for host platforms that perform these measurements.
Though the client can measure and conform service quality on a per-application level of granularity, the second part of the client's
motivation in measuring service quality is more difficult to address. The basic question is whether the service delivered in
response to a premium service request is sufficiently differentiated from a best-effort service transaction. Without necessarily
conducting the transaction a second time, the best approach is to use either one-way delay probes, for unidirectional traffic, or a
bulk TCP capacity probe, to establish some indication of the relativity in performance. From a client perspective none of these are
simple to set up, and the dilemma that the customer often faces is the basic question of whether the cost of operating the
measurement setup is adequately offset by the value of the resulting answers.
So far we have been looking at the ways of measuring network performance as a general task. Of course degraded performance does not
happen by accident (well, sometimes accidents do happen), and it makes the measurement task easier if you can identify precisely
what it is that you are looking for. This approach requires identification of the various situations that can impact network
performance and then set up network measurement and monitoring systems that are tuned to identify these situations.
Within this approach, the motives for network measurement are concerned with identification of traffic load patterns that cause
uneven network load, monitoring, and verification of service-level agreements, detection of abnormal network load that may be a
signature of an attack, forecasting and capacity planning, and routing stability.
The objective here is to create a stable and well-understood model of the operational characteristics of the network, and then
analyze the situations that could disrupt this stable state and the implications in terms of delivered performance under such
conditions.
Such an approach could be described in terms of opposites—instead of measuring network performance, the approach is measuring
the network to identify the conditions that cause nonperformance at particular times within particular network paths. As a
performance management technique, this approach has been very effective—rather than taking a larger amount of performance data
and merging and averaging it into a relatively meaningless index, the approach is to isolate those circumstances where performance
is compromised and report on these exceptions rather than on the remainder of the time.
Of course measuring what is "normal" may involve more than assembling a benchmark set of SNMP-derived polling data and a collection
of latency, loss, and jitter profiles obtained from analysis of large volumes of ping data. One additional tool is the router
itself. Because the router uses many IP packet header fields to switch each packet, one approach is to get the router to assemble
and aggregate information about the characteristics of traffic that has been passed through the router, and send these aggregated
reports to a network management station for further analysis. NetFlow is the most common tool to undertake this form of
reporting. Like SNMP, NetFlow can report on the characteristics of traffic as it passes a point in the network. For measuring
end-to-end performance of individual applications, NetFlow has the same limitations as SNMP. The analogy is one of standing on a
street corner counting cars that go past and from that measurement attempting to derive the average time for a commuter to drive to
or from work. However, the value of NetFlow is that in this context of performance measurement, it can be used to derive a picture
of the baseline characteristics of the network, including identification of the endpoints of the traffic flows. Extending the car
analogy further, NetFlow can provide an indication of the origins and ultimate destinations of the cars as they pass the monitoring
point. This information is useful in terms of designing networks that are adequately configured to handle the transit traffic load.
In addition, with careful analysis, NetFlow can be used to identify exceptional traffic conditions. The advantage here is that
NetFlow data can be used to identify both the abnormal traffic load and also provide some indication of the endpoints of the
abnormal flows. In this way, NetFlow can be deployed as both a baseline network traffic profile benchmarking tool and a performance
exception diagnosis tool.
This approach of capturing the packet header information as the traffic passes a monitoring point in the network has been
implemented in numerous ways, and NetFlow is not the only data-collection tool in this space. One interesting approach has been
used by NeTraMet, an implementation of the Internet Engineering Task Force's (IETF's) Realtime Traffic Flow
Measurement architecture for traffic flow measurement.
The feature here is a powerful ruleset within the tool that allows the flow collector to be configured to collect information about
particular traffic flows and their characteristics. In the context of measuring performance, one of the abilities of the tool is to
match the outbound data flow with the inbound acknowledgement stream, allowing an analyzer some ability to infer end-to-end
performance of the application based on the collected information.
It is clear that the picture is so far very incomplete. The active probe measurements require either some latitude of
interpretation or dedicated instrumentation to take measurements with some necessary level of frequency and precision. The passive
approach of probing the active switching elements of the network is constrained by a very basic model of the switching system, so
that the collectable values provide only a very indirect relationship to the manner in which the switching element is generating
queuing delays and traffic flow instability.
Perhaps what is also increasingly unclear is the relationship between performance and networks in any case. The last few years have
seen a massive swing in public Internet platforms away from networks where some level of congestion and contention was anticipated
to networks that are extensively overprovisioned, and there packet jitter and loss are simply not encountered. With the
ever-decreasing cost of transmission bandwidth in many markets, this environment of abundant network capacity is now also finding
its way into various enterprise network sectors. In such worlds of abundant supply and overengineering of networks, there is really
little left to measure within the network. The entire question of performance then becomes a question phrased much closer to home:
how well is your system tuned to make the most of its resources and those of the server? Often the entire issue with performance is
a situation of abundant network resources, abundant local memory and processing resources, and poor tuning of the transport
protocol stack. That is, of course, quite properly the subject of another article.
The Internet offers a wealth of material on the topic of network measurement, and the major exercise is undertaking some filtering
to get a broad collection of material that encompasses a range of perspectives on this topic. The following sources were used to
prepare this article, and are recommended as starting points for further exploration of this topic.
[1] Internet Performance Survival Guide, Geoff Huston, Wiley Computer Publishing, 2000.
[2] "IPPM Metrics for Measuring Connectivity," J. Mahdavi, V. Paxson,
RFC 2678, September 1999.
[3] "A One-way Delay Metric for IPPM," G. Almes, S. Kalidinki, M. Zeukuaskas,
RFC 2679, September 1999.
[4] "A One-way Packet Loss Metric for IPPM," G. Almes, S. Kalidinki, M. Zeukuaskas,
RFC 2680, September 1999.
[5] The RIPE Test Traffic Measurement service.
[7] "Trends in Measurement and Monitoring of Internet Backbones," session at the 26th North American Network Operators Group,
hosted by D. Meyer, October 2002.
[8] "Some thoughts on CoS and Backbone Networks," D. Meyer, presentation to the IEPREP Working Group, IETF-55, November 2002.
[9] NetFlow resource page:
http://www.cisco.com/warp/public/732/Tech/nmp/netflow/netflow_techdoc.shtml
[10] Netramet, and many other interesting measurement tools are referenced in a resource page at:
http://www.caida.org/tools
This area of research is active, and numerous activities are ongoing in the area of research group activities and
workshops.
[11] The Internet Research Task Force has an Internet Measurement Research Group. Further details can be found at:
http://www.irtf.org/charters/imrg.html
[12] ACM SIGCOMM, the ACM Special Interest Group on Data Communications, sponsors an Internet Measurement Workshop. Proceeding of
the November 2002 workshop can be found at:
http://www.acm.org/sigcomm/imw2002/
[13] The details of the 2003 Passive and Active Measurement Workshop can be found at:
http://www.pam2003.org
[14] "RSVP Management Information Base using SMIv2," F. Baker, J. Krawczyk, A. Sastry, RFC 2206, September 1997.
GEOFF HUSTON holds a B.Sc. and a M.Sc. from the Australian National University. He has been closely involved with the development
of the Internet for the past decade, particularly within Australia, where he was responsible for the initial build of the Internet
within the Australian academic and research sector. Huston is currently the Chief Scientist in the Internet area for Telstra. He is
also a member of the Internet Architecture Board, and is the Secretary of the APNIC Executive Committee. He is author of The
ISP Survival Guide, ISBN 0-471-31499-4, Internet Performance Survival Guide: QoS Strategies for Multiservice
Networks, ISBN 0471-378089, and coauthor of Quality of Service: Delivering QoS on the Internet and in Corporate
Networks, ISBN 0-471-24358- 2, a collaboration with Paul Ferguson. All three books are published by John Wiley & Sons.
E-mail: gih@telstra.net