Applications such as SAP Business Suite, Citrix Xen, and Oracle E-Business and media applications like Unified Communications are recognized as business critical or productivity critical applications in today's enterprises. Cisco IOS® Performance Monitor feature allows enterprise service managers to validate application and network performance for those critical applications and pinpoint problem causes. Cisco Performance Monitor generates performance metrics on potentially every network node without the need of additional modules, cards, or external probes.
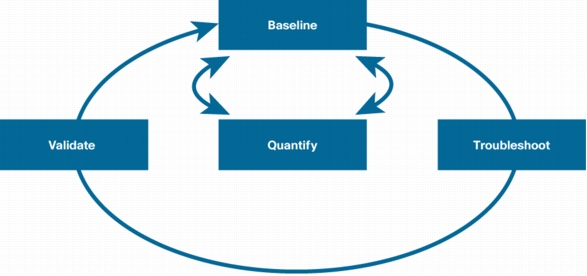
Network performance metrics can be compared against operator-configured thresholds to generate actions such as alerts when the performance of a given application degrades. Furthermore, performance metrics can be directed to a performance assurance system that correlates the data and presents better visibility by displaying hop-by-hop statistics of application flows. Performance Monitor provides the instrumentation for baselining, troubleshooting, and validating transactional applications and media flows (Figure 1).
Figure 1. Cisco Performance Monitor Use Cases
Baselining with Performance Monitor
Creating a solid baseline is the foundation of every performance assurance and fault management system. Cisco IOS Performance Monitor allows service managers to retrieve the following information:
• Response time of transaction-based applications
• Loss and jitter for media flows
• Which applications are consuming network resources
• Times of application usage
• Mapping network performance to network location
The above data can then be used to compile reports about per application performance and utilization statistics that are helpful in service-level agreement (SLA) reporting. Furthermore, the analyzed data can be used for capacity planning and threshold definition. Cisco IOS Performance Monitor passively measures performance metrics, meaning that the performance of user data flowing through the device is measured, as opposed to active measurement, where synthetic data is measured.
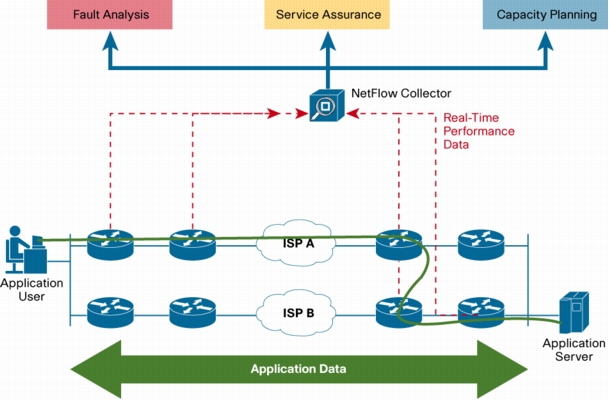
Figure 2. Cisco IOS Performance Monitor
Figure 2 depicts a TCP-based transactional application such as Citrix Xen. IOS Performance monitor turns network nodes into passive probes allowing them to measure application performance metrics like round-trip-time and packet loss, evaluating thresholds and then sending data records to the NetFlow collector. The NetFlow collector may aggregate and correlate the data. The data can then be further analyzed and processed for SLA reporting, capacity planning, and performance assurance.
Cloud Services and Performance Monitor
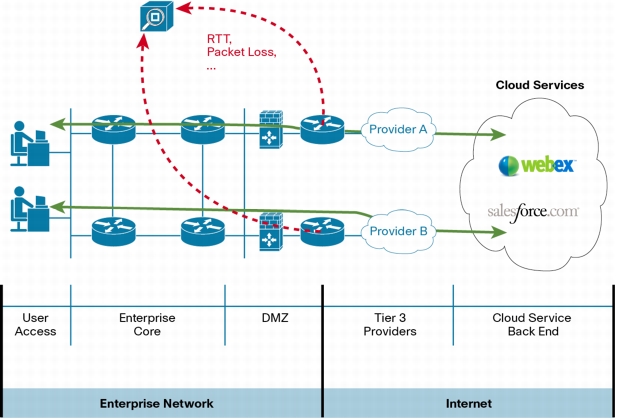
Deploying IOS Performance Monitor at the enterprise edge allows users to baseline performance for cloud-based applications and to compare service levels provided by different managed service providers. Performance metrics gathered at different points in the enterprise network also provide a healthy foundation for fault isolation (Figure 3).
Figure 3. Public Cloud Services and Performance Monitor
Troubleshooting and Fault Isolation
As enterprise IT architectures are getting richer in functionality, they are also becoming more and more difficult to troubleshoot.
Potential error sources are increased when additional devices are introduced in the data path such as media transcoders, media mixers, conferencing bridges, transparent firewalls, application proxy servers, intrusion detection devices, virtualization platforms, and application acceleration devices. Performance Monitor introduces the instrumentation to aid in fault isolation and troubleshooting. Per hop performance metrics can be analyzed and provide essential help when pinpointing the root cause of a problem.
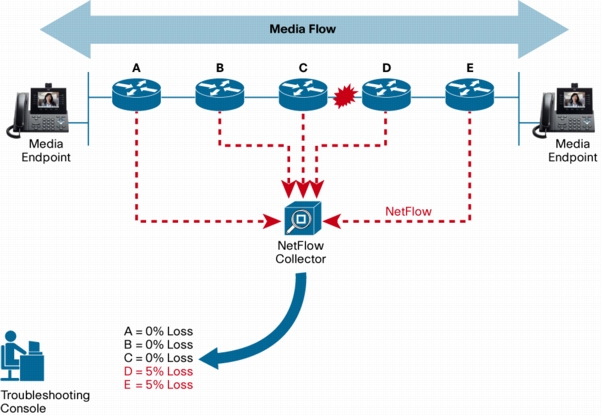
Mapping packet loss to the network path helps in identifying the location of a problem, identifies problem ownership, and ultimately accelerates problem resolution. See Figure 4.
Figure 4. Fault Isolation Example for RTP Media Flow
In addition to RTP and TCP performance metrics you can retrieve other important data points using IOS Performance Monitor. For instance, by inspecting the differentiated services code point (DSCP) of a given flow on a per hop basis, the operator can validate the correct quality of service (QoS) classification and marking configuration.
An additional valuable troubleshooting tool for media applications is Mediatrace.1 Mediatrace is a diagnostics tool that works hand in hand with Performance Monitor.
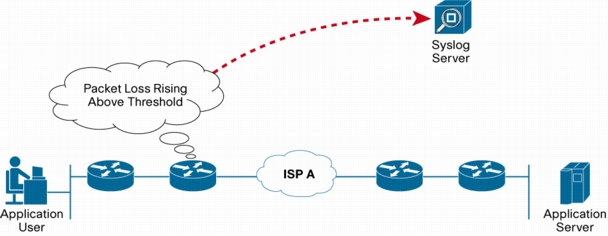
Figure 5 shows an application transaction. A performance monitoring-enabled network node detects an SLA violation causing it to send an alert to a syslog server such as Cisco Prime™ LAN Management Solution (LMS).
Figure 5. Application Crossing Loss Threshold
How Performance Monitor Fits into an Existing Deployment
Cisco Performance Monitor augments the existing set of Cisco IOS Software-based management instrumentation. Many enterprises have adopted the following Cisco IOS Software features for application performance assurance:
• IP SLA: IP service-level agreement for synthetic network performance measurements
• CBQoS: Class-Based Quality of Service for analysis of the performance of QoS policies
• NBAR: Network-Based Application Recognition for discovery of applications within the enterprise network
Cisco Performance Monitor augments these tools by providing granular performance statistics of real application data. Performance Monitor can be used in conjunction with NBAR to detect applications and on top of IP SLA to provide hop-by-hop performance data. While IP SLA meters synthetic traffic between routers and switches, Performance Monitor introduces the ability to provide performance metrics of the actual end-user data. It is also possible to combine IP SLA and Performance Monitor, for example, to measure performance metrics for synthetic IP SLA flows on intermediate nodes.
NetFlow and SNMP
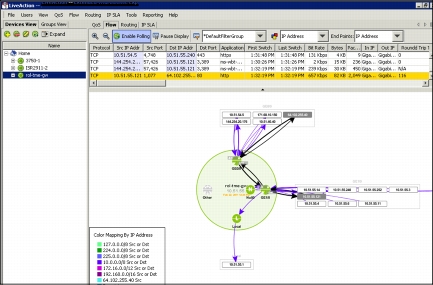
A Performance Monitor-enabled network node meters TCP and RTP metrics such as delay, loss, and jitter. It can forward those statistics using NetFlow records to any NetFlow Version 9-capable collector, and it also allows RTP metrics to be retrieved using SNMP. See Figure 6.
Figure 6. TCP Round-Trip Time Displayed on a Collection Server
Performance Monitor collects the metrics given in Table 1. Table 2 lists the SNMP MIBs introduced for Performance Monitor.
Table 1. Performance Monitor Data Fields
Data Fields for RTP
Data Fields for TCP
Packets Expected Counter
Round Trip Time (RTT)
Packet Loss
Packet Loss
Packet Lost Rate
Loss Event Count
Loss Event Count
Application Packet Count
Interarrival Jitter (RFC3550)
Application Byte Rate
RTP Synchronization Source (SSRC)
Application Octet Count
Application Packet Count
Measured Rate
Application Byte Rate
DSCP
Application Octet Count
IP Flow Destination Address and Port, Source Address and Port, and Protocol
Measured Rate
IP TTL
DSCP
IP TTL Minimum
IP Flow Destination Address and Port, Source Address and Port, and Protocol
Flow to Interface Mapping
IP TTL
IP TTL Minimum
Flow to Interface Mapping
Table 2. SNMP MIBs Introduced for Performance Monitor
MIB
Description
CISCO-FLOW-MONITOR-TC-MIB
This MIB module defines textual conventions used to describe flow monitoring data.
CISCO-FLOW-MONITOR-MIB
This MIB module defines objects that describe monitored flows carrying media streams, statistics relating to these flows, and a history of computed metrics for these flows.
CISCO-RTP-METRICS-MIB
This MIB module defines objects describing RTP metrics.
CISCO-IP-CBR-METRICS-MIB
This MIB module defines objects describing IP CBR metrics.
Conclusion
Cisco Performance Monitor is a powerful addition to the toolbox of enterprise service managers. It delivers the necessary data points that are essential for performance assurance, fault management, and capacity planning without the need for additional hardware. Cisco Performance Monitor provides service managers the information it takes to run mission-critical transactional and media applications in their networks.
Cisco Performance Monitor is available since Cisco IOS Software Release 15.1(3)T on Integrated Services Routers (ISRs) and since Release 12.2(58)SE on Cisco Catalyst 3750 and 3560 Switches.