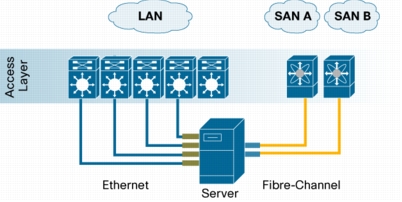
The Cisco Nexus™ family of products gives data center designers the opportunity to transform data center infrastructure from an isolated fabric topology (IFT) to a Unified Fabric topology (UFT). IFTs rely on equipment that provides fixed-configuration access layer transport, such as devices that support Ethernet and Fibre Channel only. UFTs use standards-based IEEE Ethernet and IEEE Data Center Bridging technologies at 10 Gbps to provide a wire-speed lossless fabric to enable server I/O consolidation and Fibre Channel over Ethernet (FCoE).
The benefits for the infrastructure of implementing UFT are many. UFT allows you to increase the bandwidth to the server and reduce the number of physical adapters used, the number of active components that need to be managed, and the cable and overall power and cooling requirements.
The performance benefits for the server are improved by increasing the speed to 10 Gbps per adapter, through the installation of converged network adapters (CNAs). The Cisco® solution, using Cisco Nexus 5000 Series Switches, also decreases switch latency to less than 4 microseconds, satisfying the requirements of a large number of applications such as electronic design automation (EDA) that have used other high-performance (HPC) technologies for similar latency characteristics.
As you will learn in this document, these are only a few of the benefits you can achieve by transforming your data center from IFT to UFT.
Overview of IFT and UFT Topologies
This document presents a real-world example that shows the potential benefits of using Cisco Nexus 5000 Series switching products in a UFT-enabled data center. The data presented is based on server-to-switch connections only and includes all cable counts, active-device counts, and power calculations.
The power calculations are shown for network devices only. When comparing the IFT server adapters (four 1-Gbps Ethernet and two 4-Gbps Fibre Channel) to Intel-based CNAs, server adapter power is roughly equivalent. The amount of power consumed varies by implementation but is similar enough across implementations to be considered the same for this model's purposes.
Another significant benefit of UFT is the increased bandwidth achieved when deploying the dual 10-Gbps CNAs. A raw comparison shows that four 1-Gbps Ethernet interfaces and two 4-Gbps interfaces result in a total of 12 Gbps total bandwidth. Looking deeper, you can determine, in a VMware configuration, that only two 1-Gbps Ethernet ports are used for production traffic.
Server Requirements
Server deployments in the data center can be blades, rack-optimized and superclass, or Symmetric Multiprocessor (SMP) server form factors. Generally, you determine the required network connections based on application, performance, storage, and management connections. The requirements for many server topologies are based on VMware, which generally requires four Ethernet connections and two Fibre Channel connections to accommodate the following:
• SC0 (service console for IP management of the VMware ESX host)
• VMware VMkernel, for VMware VMotion and IP storage
• Production Ethernet interfaces
• Fibre Channel interfaces
Many servers are deployed with even more interfaces for management or increased bandwidth. For example, servers typically come with two LAN-on-motherboard (LOM) interfaces, each using 1-Gbps Ethernet. Mezzanine cards or incremental adapters at 1 Gbps commonly come with four interfaces, bringing the total interface count to eight on the server, with six for Ethernet and two for Fibre Channel. The incremental interfaces can be used for management and backup traffic.
The model of four Ethernet and two Fibre Channel interfaces is useful for a minimum comparison between IFT and UFT implementations, because existing servers will keep the 1-Gbps Ethernet LOM interfaces, even if 10-Gbps CNAs are added.
This model described here references a rack-optimized server environment, but these benefits may apply to blades and the Cisco Nexus 5000 Series as well, when 10-Gbps pass-through technologies reach the blade market. The actual number of interfaces reduced in this model takes into consideration the adapter cards mentioned previously and represent the delta of interfaces for UFT and IFT deployments.
Server Units of Deployment
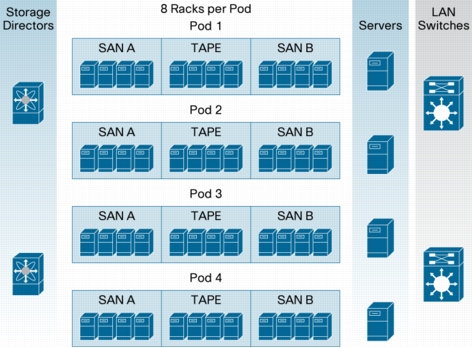
Data center design uses many terms for the grouping of servers and supporting equipment in a given footprint of the facility. A commonly used term is a "pod" or a "zone". A pod is a unit of measure that helps facilities, network support, storage support, and other supporting organizations determine power, cooling, cabling, rack, and floor-space requirements. Aggregating the number of pods simplifies the math for the engineers and planners as they determine the total server requirements. The total number of servers in a pod varies based on many factors. The model in this document has 1120 servers in a pod.
This model shows the racks targeted for consolidation as the SAN equipment racks. Each of these racks houses top-of-rack (ToR) switches, and the racks represent the potential number of racks that can be eliminated per pod.
The Ethernet switching racks could be shown in this model in the same way as the SAN switching racks. However, the strategy of UFT is targeted at reducing the proliferation of networking equipment, whether SAN or Ethernet. This model reflects the first step of UFT, which is access layer consolidation.
The model shows the benefits for a redundant data center zone within a given geographic area. A UFT strategy allows up to 32 racks per data center site (based on the number of pods) and up to 64 across the redundant data centers.
The rack reduction is significant and is one of many benefits represented in this model. Figure 1 shows the rack configuration and the associated switching equipment.
Figure 1. Racks Targeted for Reduction
You can base many other units of measure on a pod: for example, basic server units. As used here, the basic server unit refers to the number of ports for a given Ethernet or Fibre Channel switch.
Comparing IFT and UFT Models
This section details the differences between a basic IFT server unit and a basic UFT server unit, showing how this model was calculated and comparing the two approaches.
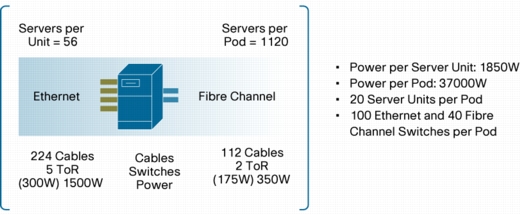
Figure 2 presents pod summary data for the basic IFT server unit.
Figure 2. IFT Server Unit
The IFT server unit consists of the following:
• Four Ethernet adapters, each at 1-Gbps Ethernet
• Two Fibre Channel adapters, each at 4-Gbps Fibre Channel
The IFT server unit includes a total of 56 servers. This number was based primarily on attachment to dual ToR Fibre Channel switches that use 8 ports for interswitch links (ISLs) and 56 ports for servers. The Ethernet portion of this network requires a minimum of 224 ports, which, based on 48-port ToR rack switches, results in a minimum of five ToR Ethernet switches. The calculations used in this model use the count of five, but you may see six for symmetry purposes. This attachment scenario uses the following counts:
• IFT interconnect ports
– 224 Ethernet ports
– 112 Fibre Channel ports
• Cabling
– 224 Ethernet cables
– 112 Fibre Channel cables
• Total active devices
– 5 Ethernet ToR switches
– 2 Fibre Channel ToR switches
• Power
– 300W average for ToR Ethernet (times 5)
– 175W average for ToR Fibre Channel (times 2)
– Total power per IFT server unit = 1850W
UFT Server Unit
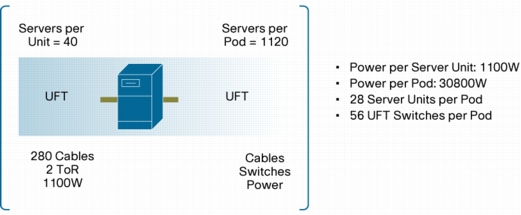
Figure 3 presents pod summary data for the basic UFT server unit.
Figure 3. UFT Server Unit
The UFT server unit consists of the following:
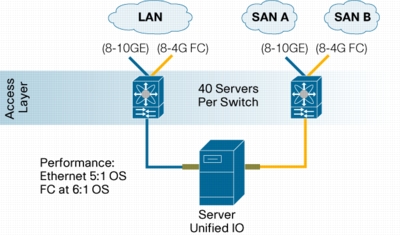
• 2 CNAs, each at 10 Gbps
The UFT server unit includes a total of 40 servers. This number is based on attachment to dual Cisco Nexus 5020 Switches that use all 40 fixed ports for server connections, and the 2 modular slots for a combination of 10 Gigabit Ethernet and Fibre Channel uplinks. The choice of network modules depends on the number of interfaces as well as the host-to-ISL or subscription level. Since this is a UFT implementation, there are no separate switches for Ethernet and Fibre Channel, just UFT interfaces, which reduces the infrastructure considerations. This attachment scenario uses the following counts:
• UFT interconnect ports
– 80 UFT ports
• Cabling
– 80 UFT cables
• Total active devices
– 2 Cisco Nexus 5020 Switches
• Power
– 550W average for each Cisco Nexus 5020 Switch (times 2)
– Total power per UFT server unit = 1100W
IFT Pod
This section provides further comparison between the aggregation of the IFT server unit and the totals for a given pod. Remember that this model aggregates up to 1120 servers in a single pod, and each data center may have multiple pods.
Figure 4 shows the equipment used for the IFT server unit and the IFT pod.
Figure 4. IFT Server Unit and IFT Pod Equipment
Isolated Fabric-SU
Isolated Fabric-POD
Servers per Unit/POD
56
1120
Server Units per POD
20
-
Ethernet Cables
224
4480
Fibre-channel Cables
112
2240
Total Cables
336
6720
Ethernet TOR Switches
5
100
FC TOR Switches
2
40
Total Switch Devices
7
140
Ethernet SW Power
300w
30kW
FC SW Power
175w
7kW
Power per Unit/POD
1850w
37kW
The summary data is shown in blue in the table. You can see that cable counts are significant in the IFT model.
The cost for power in this IFT pod is based on the following numbers:
• US$0.10 per kilowatt hour (kWh)
• 0.8 cooling factor
• Total annual cost based on 37 kW = US$64,824 (power and cooling per pod)
The aggregate bandwidth available to each server (four 1-Gbps Ethernet and two 4-Gbps Fibre Channel) is effectively 4 Gbps + 8 Gbps =12 Gbps (assuming active-active mode on both Ethernet and Fibre Channel).
UFT Pod
Figure 5 shows the equipment for the UFT server unit and the UFT pod.
Figure 5. UFT Pod
Unified Fabric-SU
Unified Fabric-POD
Servers per Unit/POD
40
1120
Server Units per POD
28
-
Unified Fabric Cables
80
2240
Total Cables
80
2240
Unified Fabric TOR Switches
2
56
Total Switch Devices
2
56
Unified fabric SW Power
550w
30.8kW
Power per Unit/POD
1100w
30.8kW
The summary data is shown in blue in the table. You can easily see the reduction in elements with a UFT pod in comparison to an IFT pod.
The cost for power in this UFT pod is based on the following numbers:
• US$0.10 per kWh
• 0.8 cooling factor
• Total annual cost based on 30800 W = US$53,961 (power and cooling per pod)
The aggregate bandwidth available to each server (two 10-Gbps CNAs) is effectively 10 Gbps + 10 Gbps =20 Gbps (assuming active-active mode on both Ethernet and Fibre Channel).
Benefits of UFT Pod in Comparison to IFT Pod
The benefits of a UFT pod in comparison to an IFT pod are significant, and as you deploy pods in the data center, the aggregate benefits will increase.
Assume that this environment is built out into redundant data center zones. Each of these locations contains four pods that aggregate in a similar configuration. Table 1 provides a comparison of the IFT and UFT environments in this topology.
Table 1. Redundant Data Center Zones Summary for IFT and UFT Pods
IIO POD
IIO Zone
UIO POD
UIO Zone
Servers per POD/Zone
1120
8960
1120
8960
Server Units per POD
20
160
28
224
Ethernet Cables
4480
35840
2240
17920
Fibre-channel Cables
2240
17920
N/A
N/A
Total Cables
6720
53760
2240
17920
Ethernet TOR Switches
100
800
56
448
FC TOR Switches
40
320
N/A
N/A
Total Switch Devices
140
1120
56
448
Ethernet/Unified Fabric SW Power
30kW
240kW
30.8kW
246.4kW
FC SW Power
7kW
56kW
N/A
N/A
Power per Unit/POD
37kW
296kW
30.8kW
246.4kW
The same formulas as before are used to calculate the cost for power:
• US$0.10 per kWh
• 0.8 cooling factor
Total annual cost for power and cooling in both zones is as follows:
• IFT: Total annual cost is US$518,592.
• UFT: Total annual cost is US$431,692.
Model Summary
The Unified Fabric topology provides significant benefits related to the facilities, power, cooling, floor space, active device, and cabling infrastructure. In comparison to IFT, UFT achieves the following improvements:
• Electrical supply: 16.7 % improvement
• Cooling supply: 25.1% improvement, assuming a 1.5 burden factor
• Active switching devices: 60% fewer switches
• Cables: 66% fewer cables
The Cisco Nexus 5000 Series is a new member of the Cisco Nexus product family, which also includes the Cisco Nexus 7000 Series Switches. The Cisco Nexus 7000 Series provides the capacity to aggregate high numbers of 10-Gbps interfaces with capacities up to 15.9 terabytes per second (Tbps) of overall fabric capacity.
Conclusion
A Unified Fabric provides a range of benefits. It enhances energy efficiency and addresses a sub-set of Green considerations, but the quantifiable value of those benefits can vary widely depending on a particular use case and IT architecture. The analysis contained in this document makes some conservative assumptions based on common use cases. To determine a more accurate value of these benefits, users should apply the assumptions in this document to their specific use cases.
Many IT departments may not have the skills within their organization to perform a specific Green audit and analysis, such as operative efficiency benchmarking; hazardous materials analysis; travel-avoidance assessment; and equipment takeback, reuse, and recycling programs. If these skill sets are lacking or if vendor support is needed, Cisco can provide consultation through approved partners to help in this effort, through Cisco Advanced Services, using the Cisco customer advocacy teams. These professional services can help the user set a metric for success in bringing economic and ecologic considerations together.