OVERVIEW
THE NEED FOR NETWORK VISIBILITY
• Bandwidth use by application-A growing challenge in managing a successful broadband network is efficiently reducing operating and capital expenses. Service providers need a clear understanding of what type of applications, services, and network activities are consuming network resources, at what times, and in what percentages. By understanding usage in peak and off-peak hours, popular applications, and popular destinations, operators can develop ways to optimize network traffic, reduce cost, and improve network performance.
• Subscriber usage demographics-With the growth in broadband subscribers, the types of usage and requirements of the broadband community have grown more diverse. Whereas some subscribers are heavy bandwidth consumers, others are more casual and require less network capacity and bandwidth. Some use a wide range of applications such as gaming, voice, video, and file-sharing, whereas others use the network only for occasional browsing and e-mail. Some subscribers use their broadband connection for business, others for leisure and entertainment. Service providers need to categorize their subscriber base according to the actual use of their network in order to analyze ongoing trends and devise new service bundles.
• Peer-to-peer traffic-Peer-to-peer traffic now accounts for between 65 and 80 percent of the world's service provider traffic. Managing this traffic is a significant issue for operators, manifesting itself in poor overall broadband service and in increased costs due to increased help-desk calls, subscriber turnover, and skyrocketing peering costs for international traffic. Although U.S. service providers struggle with peer-to-peer traffic, they rarely face the financial issues encountered by providers outside of the U.S. that are mass "importers" of content. When most of the peer-to-peer content resides outside of their network boundaries, service providers quickly find themselves losing money when their subscribers download content across international lines.
• The presence of malicious traffic-There are now approximately 180,000 digital attacks worldwide each year, causing both service disruptions and financial outlays. Attacks have increased in number-by an order of magnitude over the past three years-and in speed of proliferation. It now takes less than 10 percent of the time to infect 1 million machines than it did only two years ago. Along with worms and viruses, e-mail spam has become a significant component of malicious traffic, now accounting for between 65 and 75 percent of all e-mail traffic. As with viruses and worms, spam carries with it a significant financial cost. According to the Gartner Group, spam is directly responsible for 7 percent of service provider turnover.
• Lack of visibility into services and revenue opportunities-Without visibility into subscriber traffic patterns, estimating the potential demand for new services becomes a challenge. For example, broadband voice may be an appealing service for subscribers, but how can you accurately gauge demand, and growth in this demand, if you have no insight into existing broadband voice service usage? Existing broadband voice activity data on your network could not only provide insight into the growth in demand for these services over time, but could also open the door to new revenue-sharing opportunities for these types of services. Having no visibility into network traffic makes it difficult to understand existing subscribers, let alone decide which new services to launch.
THE CISCO SERVICE CONTROL SOLUTION
Figure 1
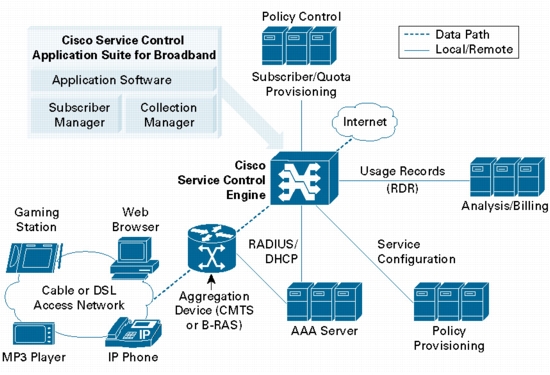
• Deep-packet inspection reconstructs traffic semantics up to Layer 7 protocol information, and classifies traffic to end application (peer-to-peer, browsing, voice over IP [VoIP], gaming, and so on) even for port-hopping or multiflow applications.
• Subscriber-aware traffic processing monitors traffic at the subscriber, group, or global level.
• Usage statistics are actionable and meaningful.
• Traffic inspection and usage data is exported for both billing and reporting purposes without any impact on existing network performance.
• Deployment is transparent in both Cisco and third-party networks. The Cisco Service Control solution can be installed inline or receive-only.
NETWORK USAGE ANALYSIS WITH THE CISCO SERVICE CONTROL SOLUTION
NETWORK BANDWIDTH AND VOLUME REPORTS
Problem
Solution
• Application activity during peak and congestion time
• Total volume of traffic and application, using transit, peering connections, and on-net traffic
• Service popularity, including popular Websites, news groups, and the relative bandwidth costs of delivering these services
Figure 2
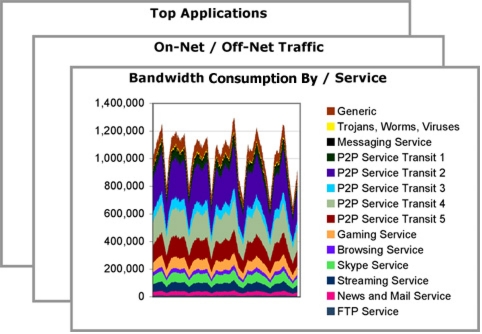
Value
• Determine traffic optimization mechanisms required to reduce congestion and peak usage
• Identify successful peering and local hosting opportunities to reduce cost and improve performance
SUBSCRIBER DEMOGRAPHICS REPORTS
Problem
Solution
• Identification of "bandwidth hogs" who consume a disproportionate amount of network resources
• Identification of "light" subscribers who use their service for Web and e-mail traffic
• Subscribers using a specific service, such as gaming, streaming, or voice
• Increasing usage of certain applications and services
Figure 3
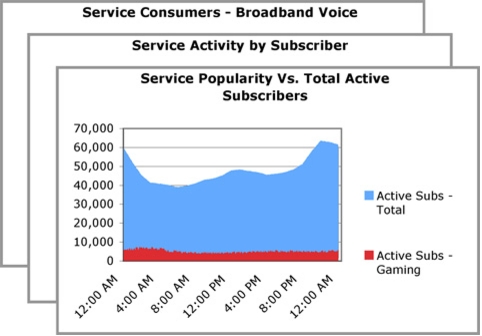
Value
• Identify the most popular protocols and services
• Evaluate enhanced service offerings that can be differentiated on the basis of service quality, such as broadband voice and gaming
• Evaluate opportunities for revenue sharing through joint service creation with online service partners, such as multimedia and content vendors that require high network quality for their service delivery
• Explore service bundles tailored for certain users, such as telecommuters or members which have subscribed to gaming services.
• Identify bandwidth hogs and devise ways to moderate their activity without affecting their overall satisfaction with the service.
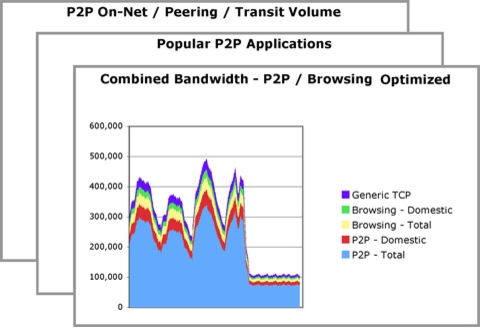
PEER-TO-PEER FILE SHARING REPORTS
Problem
Solution
• Bandwidth consumed by peer-to-peer applications
• Total volume of peer-to-peer traffic over time
• Peer-to-peer applications prioritized by popularity
• Peer-to-peer protocol popularity
Figure 4
Value
• Protect high-margin services that may be affected by the uncontrolled volume of peer-to-peer traffic, such as broadband voice gaming and other latency-sensitive applications
• Determine the traffic optimization model required to reduce congestion and peak usage, helping reduce help-desk calls and subscriber churn
• Introduce a more predictable method of capacity planning based on mechanisms within your control
• Proactively control the significant expense associated with international peering charges by managing traffic within required peak bandwidth level
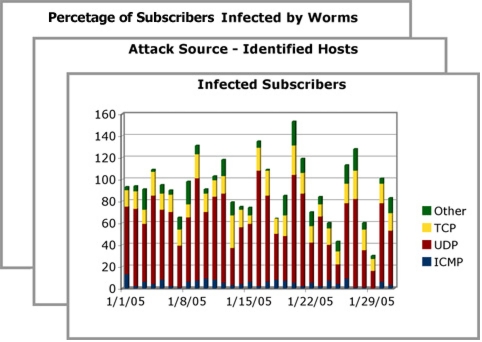
MALICIOUS NETWORK TRAFFIC REPORTS
Problem
Solution
• Infected subscribers, identified by generating abnormal traffic patterns or traffic patterns containing specific signatures
• Attack source, reported by the identified source IP address of the attack traffic
• Subscriber detail reports, indicating subscribers affected by specific types of malicious traffic, such as worms
Figure 5
Value
• Help ensure customer satisfaction by protecting subscribers from the threat of malicious traffic or assisting them with the "corrective action" needed to minimize the impact of an infection
• Quickly identify the worm outbreak and its source, allowing you to rapidly respond to mitigate its effect
• Minimize subscriber churn by maintaining a trustworthy environment for your online subscribers
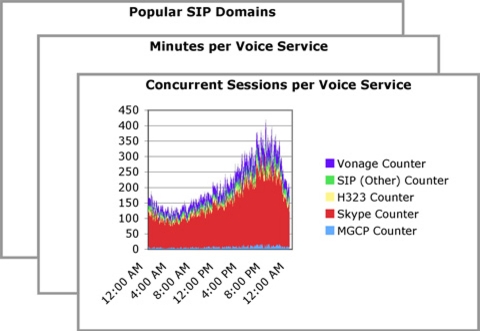
BROADBAND VOICE REPORTS
Problem
Solution
• Call minutes per broadband voice service for the selected subscriber base, showing the total minutes spent using voice service over time
• Concurrent sessions per voice service for the selected subscriber base, showing the number of concurrent voice calls
• Popular voice services based on Session Initiation Protocol (SIP) domain
Figure 6
Value
• Provide the quality of service required to ensure an acceptable voice call
• Track the call data records for each subscriber, ensuring accurate billing and accounting for the service
• Monitor popularity of third-party voice services, including number of calls and call minutes per service
CISCO SERVICE CONTROL SOLUTION-REPORTING SPECIFICATIONS
Data Collection Features
Data architecture
• Collection to standard Java Database Connectivity (JDBC)-compliant databases
• Centralized or distributed collection architecture
• Redundant collection and data storage
Data export
• Export data in comma-separated values (CSV) text format or Structured Query Language (SQL)
• Simple Network Management Protocol (SNMP)-based interface from Service Control Engines (SCEs)
• Direct usage feeds from SCE devices using Raw Data Record (RDR) data export
• Interface to billing and mediation systems
• Export reports in tabular or image format
• Ready for e-mail and Web publishing
Reporting Features
Report generation
• Interactive reporting tool
• Command-line interface for report automation
• Integration with any third-party SQL reporting tool
Report templates
• More than 100 standard reports available, including bandwidth and volume, demographic, peer-to-peer, malicious traffic, and broadband voice reports
• Ability to create custom reporting templates as dictated by traffic patterns, geography, and business model
Report filters
• Filtering by subscriber base, subscriber group, and individual subscriber
• Filtering by individual SCE device or device group
• Filtering by service, application, and protocol
• Filtering by time and date