Table Of Contents
Serviceability Reports Archive
Serviceability Reporter Service Parameters
Device Statistics Report
Server Statistics Report
Service Statistics Report
Call Activities Report
Alert Summary Report
Performance Protection Report
Serviceability Reports Archive Configuration Checklist
Where to Find More Information
Serviceability Reports Archive
The Cisco Serviceability Reporter service generates daily reports in Cisco Serviceability Administration. Each report provides a summary that comprises different charts that display the statistics for that particular report. Reporter generates reports once a day on the basis of logged information.
See the following sections for detailed information about each report that Serviceability Reporter generates:
•
Device Statistics Report
•
Server Statistics Report
•
Service Statistics Report
•
Call Activities Report
•
Alert Summary Report
•
Performance Protection Report
•
Serviceability Reports Archive Configuration Checklist
•
Where to Find More Information
Note
Because the Cisco Serviceability Reporter is only active on the Cisco CallManager on the first node, at any time, Reporter generates reports only on the first node, not the other nodes.
You can view reports from Cisco CallManager Serviceability > Tools > Serviceability Reports Archive.
The reports contain 24-hour data for the previous day. A suffix that is added to the report names shows the date for which Reporter generated them; for example, AlertRep_mm_dd_yyyy.pdf. The Serviceability Reports Archive window uses this date to display the reports for the relevant date only. The reports generate from the data that is present in the log files, with the timestamp for the previous day. The system considers log files for the current date and the previous two days for collecting data to take into account the time zone differences between the server locations.
Note
Log files can be picked up from all the Cisco CallManager nodes in the cluster while generating reports.
The time that is shown in the report reflects the first node "System Time." If the first node and subsequent node(s) are in different time zones, the first node "System Time" shows in the report.
Serviceability Reporter Service Parameters
Cisco Serviceability Reporter uses the following three service parameters:
•
RTMT Reporter Designated Node—Specifies the designated node on which RTMT Reporter runs. Because the Serviceability Reporter service is CPU intensive, Cisco recommends that you specify a non-callprocessing node. This default equals the IP address of the server on which the RTMT Reporter service is first activated.
•
Report Generation Time—The number of minutes after midnight. Reports generate at this time for the most recent day. The minimum value is 0 and the maximum value is 1439.
•
Report Deletion Age—The number of days that the report must be kept in the disk. The system deletes reports that are older than the specified age. The minimum value is 0 and the maximum value is 30.
For more information about service parameter configuration, refer to the Cisco CallManager Administration Guide.
Note
If a server gets removed completely from the network (the server should be removed from the network and also from the list of servers in Cisco CallManager Administration), Reporter does not consider this server while generating reports, even if the log file contains the data for that server.
Device Statistics Report
The Device Statistics Report provides the following line charts:
•
Number of Registered Phones per Server—A line chart displays the number of registered phones for each Cisco CallManager server and cluster. Each line in the chart represents the data for each server in the cluster (for which data is available), and one extra line displays the clusterwide data. Each data value in the chart represents the average number of phones that are registered for a 15-minute duration. In any server shows no data, Reporter does not generate the line representing that server. If no data exists for all servers, for registered phones, Reporter does not generate the chart. The message "No data for Device Statistics report available" displays.
Note
You can disable reports by setting the service parameter Report Deletion Time to a value of 0.
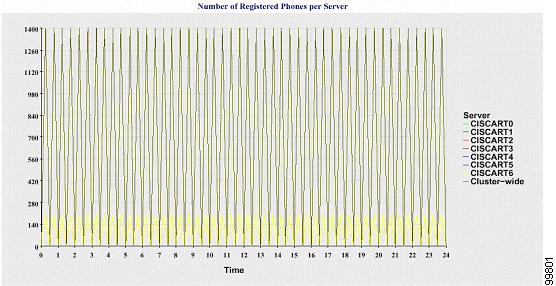
Figure 9-1 shows an example of a line chart that represents the number of registered phones per Cisco CallManager server.
Figure 9-1 Line Chart Depicting Number of Registered Phones per Server
•
Number of MGCP Gateways Registered in the Cluster—A line chart displays the number of registered MGCP FXO, FXS, PRI, and T1CAS gateways. Each line represents data only for the Cisco CallManager cluster; so, there are four lines showing clusterwide details for each gateway type. Each data value in the chart represents the average number of MGCP gateways that are registered for a 15-minute duration. If no data exists for a gateway for all the servers, Reporter does not generate the line that represents data for that particular gateway. If no data exists for all gateways for all servers, Reporter does not generate the chart.
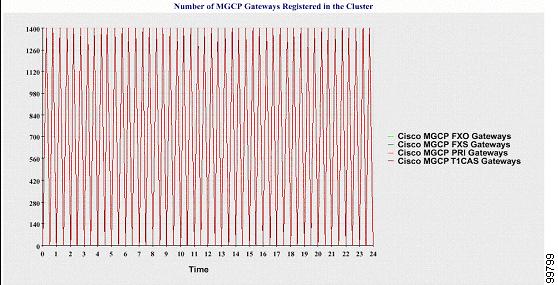
Figure 9-2 shows an example of a line chart that represents the number of registered gateways per Cisco CallManager cluster.
Figure 9-2 Line Chart Depicting Number of Registered Gateways per Cluster
•
Number of H.323 Gateways in the Cluster—A line chart displays the number of H.323 gateways. One line represents the clusterwide details of the H.323 gateways. Each data value in the chart represents the average number of H.323 gateways for a 15-minute duration. If no data exists for H.323 gateways for all servers, Reporter does not generate the chart.
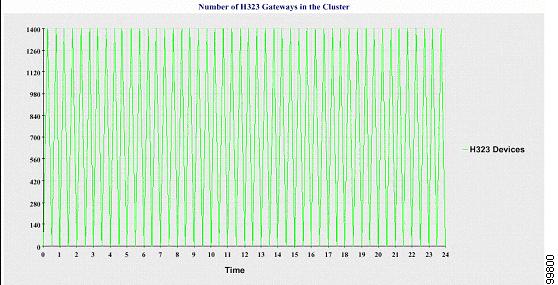
Figure 9-3 shows example line chart that represents the number of H.323 gateways per Cisco CallManager cluster.
Figure 9-3 Line Chart Depicting Number of Registered H.323 Gateways per Cluster
•
Number of Trunks in the Cluster—A line chart displays the number of H.323 and SIP trunks. Two lines represent the clusterwide details of the H.323 trunks and SIP trunks. Each data value in the chart represents the average number of H.323 and SIP trunks for a 15-minute duration. If no data exists for H.323 trunks for all servers, Reporter does not generate the line that represents data for the H.323 trunks. If no data exists for SIP trunks for all servers, Reporter does not generate the line that represents data for SIP trunks. If no data exists for trunks for all servers, Reporter does not generate the chart.
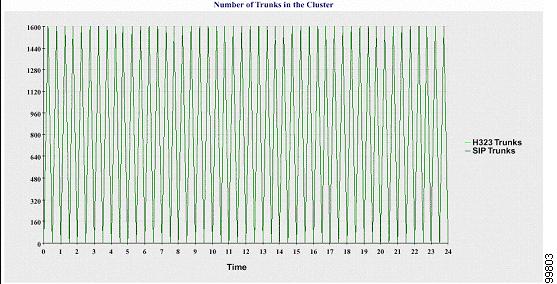
Figure 9-4 shows example line chart that represents the number of trunks per Cisco CallManager cluster.
Figure 9-4 Line Chart Depicting Number of Trunks per Cluster
You can read information from the log files from all servers in the Cisco CallManager cluster that match the file name pattern DeviceLog_mm_dd_yyyy_hh_mm.csv. The information that is read from the file for the Device Statistics report includes:
•
Number of registered phones on each server
•
Number of registered MGCP FXO, FXS, PRI, and T1CAS gateways on each server
•
Number of registered H.323 gateways on each server
•
Number of SIP trunks and H.323 trunks
Server Statistics Report
The Server Statistics Report provides the following line charts:
•
Percentage of CPU per Server—A line chart displays the percentage CPU usage per Cisco CallManager server. Each line in the chart represents the data for each server in the Cisco CallManager cluster (for which data is available). Each data value in the chart represents the average CPU Usage for a 15-minute duration. If no data exists for any one server, Reporter does not generate the line that represents that server. If no data exists for all servers, Reporter does not generate the chart. The message "No data for Server Statistics report available" displays.
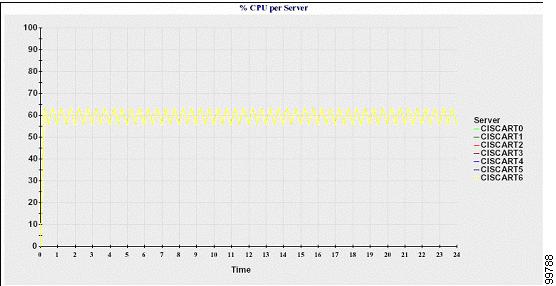
Figure 9-5 shows a line chart example that represents the percentage of CPU usage per Cisco CallManager server.
Figure 9-5 Line Chart Depicting the Percentage of CPU per Server
•
Percentage of Memory Usage per Server—A line chart displays the percentage Memory Usage per Cisco CallManager server (%MemoryInUse). Each line in the chart represents the data for each server in the Cisco CallManager cluster (for which data is available). Each data value in the chart represents the average memory usage for a 15-minute duration. If no data exists for any server, Reporter does not generate the line that represents that server. If no data exists for all servers, Reporter does not generate the chart.
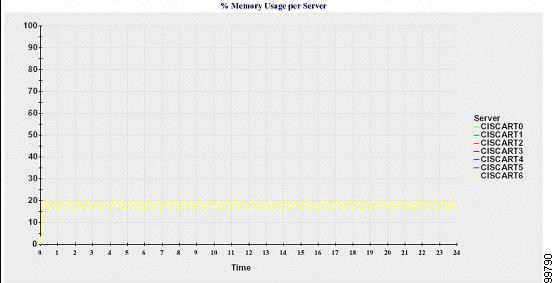
Figure 9-6 shows a line chart example that represents the percentage of memory usage per Cisco CallManager server.
Figure 9-6 Line Chart Depicting Percentage of Memory Usage per Server
•
Percentage of Hard Disk Usage of the Largest Partition per Server—A line chart displays the percentage of disk space usage for the largest partition per Cisco CallManager server (%DiskSpaceInUse). Each line in the chart represents the data for each server in the Cisco CallManager cluster (for which data is available). Each data value in the chart represents the average disk usage for a 15-minute duration. If no data exists for any one server, Reporter does not generate the line that represents that server. If no data exists for all servers, Reporter does not generate the chart.
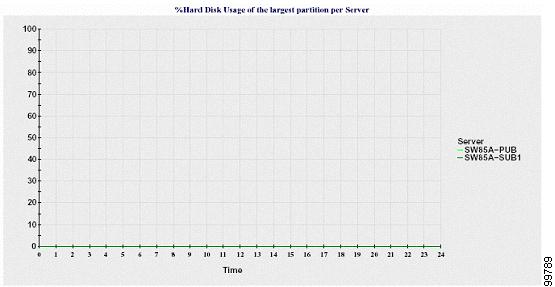
Figure 9-7 shows a line chart example that represents the percentage of hard disk usage for the largest partition per Cisco CallManager server.
Figure 9-7 Line Chart Depicting Percentage of Hard Disk Usage of the Largest Partition per Server
You can read the information from log files, from the servers in the cluster that matches the file name pattern ServerLog_mm_dd_yyyy_hh_mm.csv. The information that is read from the file for the Server Statistics report includes:
•
% CPU usage on each server
•
% Memory usage (%MemoryInUse) on each server
•
% Hard disk usage of the largest partition (%DiskSpaceInUse) on each server
Service Statistics Report
The Service Statistics Report provides the following line charts:
•
Cisco CTI Manager: Number of Open Devices—A line chart displays the number of CTI Open Devices per CTI Manager. Each line chart represents the data for each server in the Cisco CallManager cluster (on which service is activated). Each data value in the chart represents the average number of CTI open devices for a 15-minute duration. If no data exists for any one server, Reporter does not generate the line that represents that server. If no data exists for all servers, Reporter does not generate the chart. The message "No data for Service Statistics report available" displays.
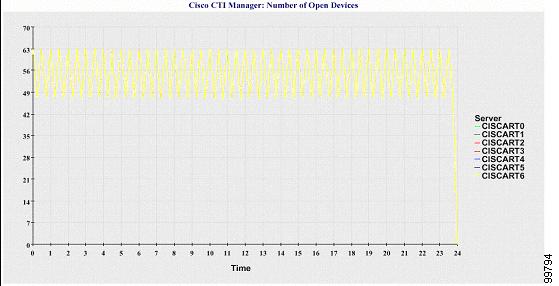
Figure 9-8 shows a line chart example that represents the number of open devices per Cisco CTI Manager.
Figure 9-8 Line Chart Depicting Cisco CTI Manager: Number of Open Devices
•
Cisco CTI Manager: Number of Open Lines—A line chart displays the number of CTI open lines per CTI Manager. Each line in the chart represents the data for each server in the Cisco CallManager cluster (on which service is activated). Each data value in the chart represents the average number of CTI open lines for a 15-minute duration. If no data exists for any one server, Reporter does not generate the line that represents that server. If no data exists for any of the servers, Reporter does not generate the chart.
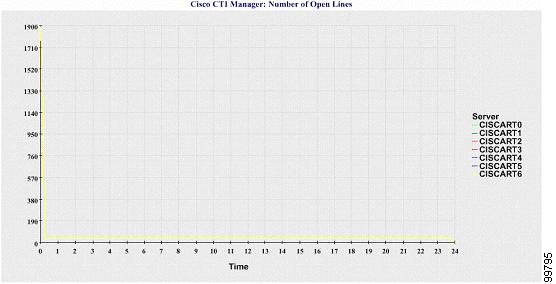
Figure 9-9 shows a line chart example that represents the number of open lines per Cisco CTI Manager.
Figure 9-9 Line Chart Depicting Cisco CTI Manager: Number of Open Lines
•
Cisco TFTP: Number of Requests—A line chart displays the number of Cisco TFTP requests per TFTP server. Each line in the chart represents the data for each server in the Cisco CallManager cluster (on which service is activated). Each data value in the chart represents the average number of TFTP requests for a 15-minute duration. If no data exists for any one server, Reporter does not generate the line that represents that server. If no data exists for any of the servers, Reporter does not generate the chart.
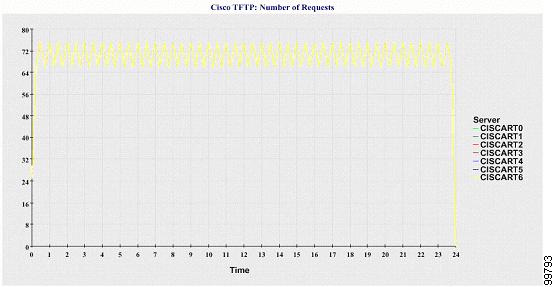
Figure 9-10 shows a line chart example that represents the number of Cisco TFTP requests per TFTP server.
Figure 9-10 Line Chart Depicting Cisco TFTP: Number of Requests
•
Cisco TFTP: Number of Aborted Requests—A line chart displays the number of Cisco TFTP Requests Aborted per TFTP server. Each line in the chart represents the data for each server in the Cisco CallManager cluster (on which service is activated). Each data value in the chart represents the average of TFTP Requests Aborted for a 15-minute duration. If no data exists for any one server, Reporter does not generate the line that represents that server. If no data exists for any of the servers, Reporter does not generate the chart.
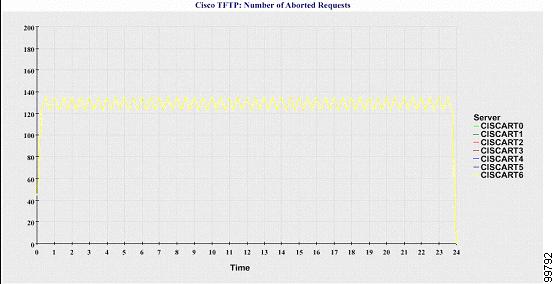
Figure 9-11 shows a line chart example that represents the number of Cisco TFTP requests that were aborted per TFTP server.
Figure 9-11 Line Chart Depicting Cisco TFTP: Number of Aborted Requests
You can read the information from log files, from all the servers of the Cisco CallManager cluster that matches the file name pattern ServiceLog_mm_dd_yyyy_hh_mm.csv. The information that is read from the file for the Service Statistics report includes:
•
For each CTI Manager - Number of open devices
•
For each CTI Manager - Number of open lines
•
For each Cisco TFTP server - TotalTftpRequests
•
For each Cisco TFTP server - TotalTftpRequestsAborted
Call Activities Report
The Call Activities Report provides the following line charts:
•
Cisco CallManager Call Activity for the Cluster—A line chart displays the number of calls that were attempted and calls that were completed for H.323 gateways for the entire Cisco CallManager cluster. The chart comprises two lines, one for the number of calls that were attempted and another for the number of calls that were completed. Each line represents the cluster value, which is the sum of the values for all the servers in the cluster (for which data is available). Each data value in the chart represents the total number of calls that were attempted or calls that were completed for a 15-minute duration. If no data exists for H.323 gateways calls completed for all the servers, then Reporter does not generate the line representing data for Calls Completed. In the case that there is no data for a Cisco CallManager calls completed for all the servers, Reporter does not generate the line that represents data for Calls Completed. If no data exists for Cisco CallManager calls that were attempted for all the servers, Reporter does not generate the line that represents data for Calls Attempted. If no data exists for Cisco CallManager call activities for all the servers, Reporter does not generate the chart. The message "No data for Call Activities report available" displays.
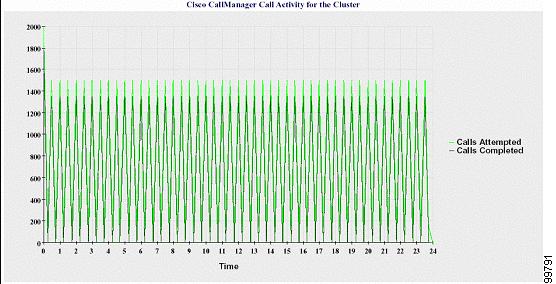
Figure 9-12 shows a line chart example that represents the number of attempted and completed calls for the Cisco CallManager cluster.
Figure 9-12 Line Chart Depicting Cisco CallManager Call Activity for the Cluster

•
H.323 Gateways Call Activity for the Cluster—A line chart displays the number of calls that were attempted and calls that were completed for H.323 gateways, for the entire Cisco CallManager cluster. The chart comprises two lines, one for the number of calls that were attempted and another for the number of calls that were completed. Each line represents the cluster value, which equals the sum of the values for all the servers in the cluster (for which data is available). Each data value in the chart represents the total number of calls that were attempted or calls that were completed for a 15-minute duration. If no data exists for H.323 gateways calls that were completed for all servers, Reporter does not generate the line that represents data for calls that were completed. If no data exists for H.323 gateways calls that were attempted for all servers, Reporter does not generate the line that represents data for calls that were attempted. If no data for H.323 gateways call activities for all servers, Reporter does not generate the chart.
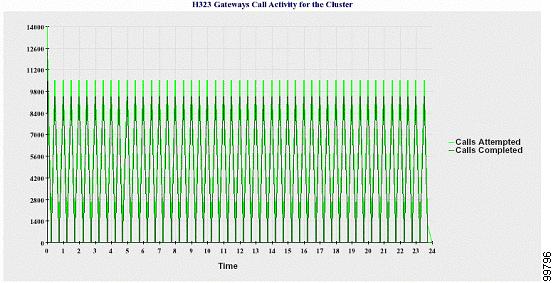
Figure 9-13 shows a line chart example that represents the H.323 gateway call activity for the Cisco CallManager cluster.
Figure 9-13 Line Chart Depicting H.323 Gateways Call Activity for the Cluster
•
MGCP Gateways Call Activity for the Cluster—A line chart displays the number of calls that were completed in an hour for MGCP FXO, FXS, PRI, and T1CAS gateways, for the entire Cisco CallManager cluster. The chart comprises four lines at the most, one for the number of calls that were completed for each of the gateway types (for which data is available). Each line represents the cluster value, which equals the sum of the values for all servers in the cluster (for which data is available). Each data value in the chart represents the total number of calls that were completed for a 15-minute duration. If no data exists for a gateway for all servers, Reporter does not generate the line that represents data for calls that were completed for a particular gateway. If no data exists for all gateways for all servers, Reporter does not generate the chart.
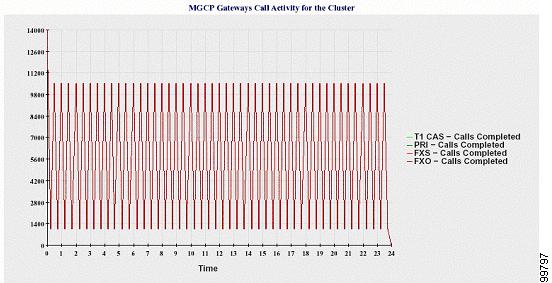
Figure 9-14 shows a line chart example that represents the MGCP gateways call activity for the Cisco CallManager cluster.
Figure 9-14 Line Chart Depicting MGCP Gateways Call Activity for the Cluster

•
MGCP Gateways—A line chart displays the number of Ports In Service and Active Ports for MGCP FXO, FXS gateways and the number of Spans In Service or Channels Active for PRI, T1CAS gateways for the entire Cisco CallManager cluster. The chart comprises eight lines, two lines each for the number of Ports In Service for MGCP FXO and FXS, and two lines each for the number of Active Ports for MGCP FXO and FXS. Four more lines for the number of Spans In Service and Channels Active for PRI and T1CAS gateways exist. Each line represents the cluster value, which is the sum of the values for all servers in the cluster (for which data is available). Each data value in the chart represents the total Number of Ports In Service, Number of Active Ports, Spans In Service or Channels Active for a 15-minute duration. If no data exists for the number of Spans In Service or the Channels Active for a gateway (MGCP PRI, T1CAS) for all servers, Reporter does not generate the line that represents data for that particular gateway.
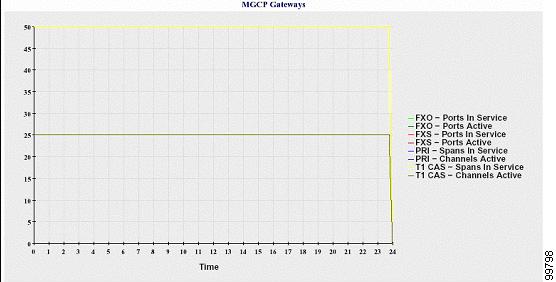
Figure 9-15 shows a line chart example that represents the MGCP gateways.
Figure 9-15 Line Chart Depicting MGCP Gateways
•
Trunk Call Activity for the Cluster—A line chart displays the number of calls that were completed and calls that were attempted in an hour for SIP Trunk and H.323 Trunk for the entire Cisco CallManager cluster. The chart comprises four lines, two for the number of calls that were completed for each SIP and H.323 trunk (for which data is available) and two for the number of calls that were attempted. Each line represents the cluster value, which is the sum of the values for all the servers in the cluster (for which data is available). Each data value in the chart represents the total Number of Calls Completed or Number of Calls Attempted for a 15-minute duration. If no data exists for a trunk for all servers, Reporter does not generate the line that represents data for Calls Completed or Calls Attempted for that particular trunk. If no data exists for both the trunks for all servers, Reporter does not generate the chart.
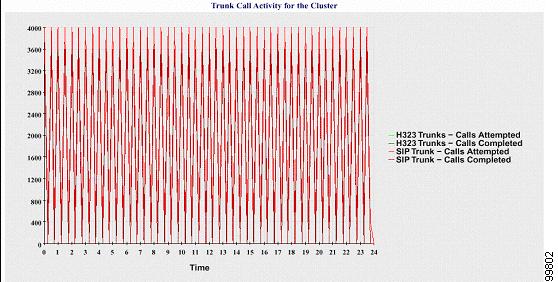
Figure 9-16 shows a line chart example that represents the trunk call activity for the cluster.
Figure 9-16 Line Chart Depicting Trunk Call Activity for the Cluster
You can read the information from log files from all servers in the cluster that matches the file name pattern CallLog_mm_dd_yyyy_hh_mm.csv. The information that is read from the file for the Call Activities report includes:
•
Calls Attempted and Calls Completed for the Cisco CallManager in each Cisco CallManager server
•
Calls Attempted and Calls Completed for the H.323 gateways in each Cisco CallManager server
•
Calls Completed for the MGCP FXO, FXS, PRI, and T1CAS gateways in each Cisco CallManager server
•
Ports In Service, Active Ports for MGCP FXO and FXS gateways and Spans In Service, Channels Active for PRI, and T1CAS gateways in each Cisco CallManager server
•
Calls Attempted and Calls Completed for H.323 Trunks and SIP Trunks
Alert Summary Report
The Alert Summary Report provides the details of alerts that are generated for a day. The Alert report comprises the following charts:
•
Number of Alerts per Server—A pie chart provides the number of alerts per Cisco CallManager server. The chart displays the server-wide details of the alerts that are generated. Each sector of the pie chart represents the number of alerts generated for a particular server in the Cisco CallManager cluster. The chart has as many number of sectors as there are servers (for which Reporter generates alerts in the day) in the cluster. If no data exists for a server, no sector in the chart that represents that server. If no data exists for all servers, Reporter does not generate the chart. The message "No alerts were generated for the day" displays.
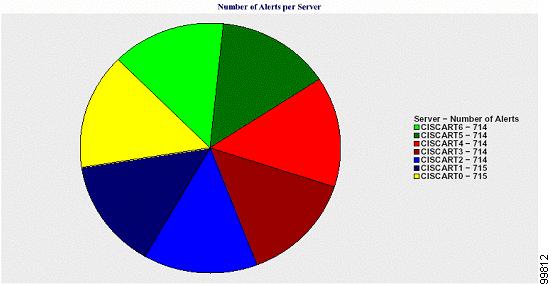
Figure 9-17 shows a pie chart example that represents the number of alerts per server.
Figure 9-17 Pie Chart Depicting Number of Alerts per Server
•
Number of Alerts per Severity for the Cluster—A pie chart displays the number of alerts per Alert Severity. The chart displays the severity details of the alerts that are generated. Each sector of the pie chart represents the number of alerts generated of a particular severity type. The chart provides as many number of sectors as there are severities (for which Reporter generates alerts in the day). If no data exists for a severity, no sector in the chart that represents that severity. If no data exists for all servers, Reporter does not generate the chart.
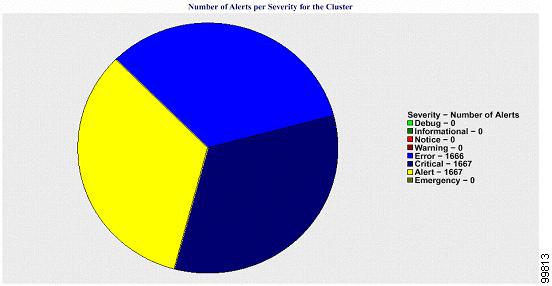
Figure 9-18 shows a pie chart example that represents the number of alerts per severity for the cluster.
Figure 9-18 Pie Chart Depicting Number of Alerts per Severity for the Cluster
•
Top 10 Alerts in the Cluster—A bar chart displays the number of alerts of a particular Alert Type. The chart displays the details of the alerts that are generated on the basis of the alert type. Each bar represents the number of alerts for an alert type. The chart displays details only for the first 10 alerts based on the highest number of alerts in descending order. If no data exists for a particular alert type, no bar represents that alert. If no data exists for any alert type, RTMT does not generate the chart.
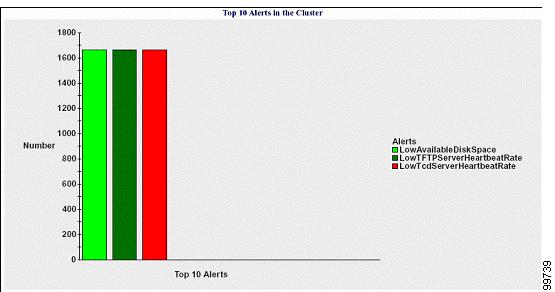
Figure 9-19 shows a bar chart example that represents the top 10 alerts in the cluster.
Figure 9-19 Bar Chart Depicting Top 10 Alerts in the Cluster
You can read the information from log files from all servers in the cluster that match the file name pattern AlertLog_mm_dd_yyyy_hh_mm.csv. The information read from the file for Alert report includes:
•
Time - Time at which the alert occurred
•
Alert Name - Descriptive name
•
Node Name - Server on which the alert occurred
•
Monitored object - The object that is monitored
•
Severity - Severity of this alert
Performance Protection Report
The Performance Protection Report provides trend analysis information on default monitoring objects that allows you to track overall system health. The report includes information for the for the last 7 days for each server.
The Performance Protection report comprises the following charts:
•
Cisco CallManager Call Activity—A line chart displays the hourly rate of increase or decrease for number of calls that were attempted and calls that were completed as the number of active calls for each Cisco CallManager server. The chart comprises three lines, one for the number of calls that were attempted, one for the calls that were completed, and one for the active calls. If no data exists for call activity, Reporter does not generate the chart.
•
Number of registered phones and MGCP gateways—A line chart displays the number of registered phones and MGCP gateways on each Cisco CallManager server. The chart comprises two lines, one for the number of registered phones and another for the number of MGCP gateways. If no data exists for phones or MGCP gateways, Reporter does not generate the chart.
•
System Resource Utilization—A line chart displays the CPU load percentage and the percentage of memory that is used (in bytes) for the Cisco CallManager servers. The chart comprises two lines, one for the CPU load and one for the memory usage. Each line represents the cluster value, which is the average of the values for all the servers in the cluster (for which data is available). If no data exists for phones or MGCP gateways, Reporter does not generate the chart.
•
Device and Dial Plan Quantities—Two tables display information from the Cisco CallManager database about the numbers of devices and number of dial plan components. The device table shows the number of IP phones, Unity connection ports, H.323 clients, H.323 gateways, MGCP gateways, MOH resources, and MTP resources. The dial plan table shows the number of directory numbers and lines, route patterns, and translation patterns.
Serviceability Reports Archive Configuration Checklist
Table 9-1 Trace Configuration and Collection Checklist
Configuration Steps
|
Related Procedures and Topics
|
Step 1
|
Activate the Cisco Serviceability Reporter service.
Note Because the Serviceability Reporter service is CPU intensive, Cisco recommends that you activate the service on a non-callprocessing server.
|
Activating and Deactivating Feature Services, Cisco CallManager Serviceability Administration Guide
|
Step 2
|
Configure the Cisco Serviceability Reporter service parameters.
|
Serviceability Reporter Service Parameters
Cisco CallManager Administration Guide
|
Step 3
|
View the reports generated by the Cisco Serviceability Reporter service.
|
Serviceability Reports Archive Configuration Checklist, Cisco CallManager Serviceability Administration Guide
|
Where to Find More Information
Related Topics
•
Real-Time Monitoring Tool
•
Real-Time Monitoring Configuration Cisco CallManager Serviceability Administration Guide
•
Serviceability Reports Archive Configuration, Cisco CallManager Serviceability Administration Guide