-
Cisco CDA Visual Quality Experience Application User Guide Release 3.7
-
Preface
-
Introduction to Cisco CDA-VQE Application
-
Inital VQE Configuration
-
Using the VQE Channel Provisioning Tool
-
Using the VQE-S AMT
-
Using the VCDS AMT
-
Troubleshooting VQE Software Components
-
Configuring VQE Server and VQE Tools
-
VQE System and Network Parameters
-
SNMP MIBs
-
VQE System Messages
-
Manual Initial VQE System Configuration
-
Configuring DHCP and DNS Servers for VCDS
-
Using the vcds_send_file Command
-
Changing the Boot Sequence to start from CD/DVD Drive
-
VQE Server Performance and Scaling Limits
-
VCPT Configuration Files
-
Using IPMI on Cisco CDE 250
-
 Feedback
Table Of Contents
Logging into and Navigating in the VQE-S AMT
Monitoring the Health of the VQE-S Processes
Viewing Channel Configuration and Status
Monitoring Unicast Retransmission and RCC
Viewing Error Repair and RCC Configuration
Viewing Error Repair and RCC Statistics
Viewing Error Repair and RCC Capacity Statistics
Using the VQE-S AMT
This chapter describes how to use Cisco VQE Server (VQE-S) Application Monitoring Tool (AMT). The tasks that you can perform with the VQE-S AMT are listed in Table 4-1.
Table 4-1 VQE-S AMT Tasks
Log in to the VQE-S AMT
Monitor the health of the VQE-S processes
View channel configuration details, status, and statistics
Monitor statistics for Unicast Retransmission and RCC1
View configuration details, status, and statistics for CDE Ethernet interfaces
View configuration details, status, and statistics for the VQE-S RTCP2 Exporter
View STUN Server statistics
Reset VQE-S counters
Restore VQE-S counters
Change VQE-S logging levels
Change VQE-S debugging levels
1 RCC = rapid channel change.
2 RTCP = Real-Time Transport Control Protocol
Note
The VQE-S AMT supports configuration capabilities for logging levels and debugging options. However, the configured values do not persist when the VQE-S AMT is restarted.
Logging into and Navigating in the VQE-S AMT
Before logging into the VQE-S AMT, you need a valid Linux username and password on the
Cisco CDE hosting the VQE-S AMT. The username does not have to belong to any special group. Creation of the username is the responsibility of the Cisco CDE system administrator.The VQE-S AMT supports two web browsers: Microsoft Internet Explorer version 6.0 or later, and Mozilla Firefox version 2.0 or later. The minimum screen resolution required for the VQE-S AMT is 1024 x 768 pixels.
The VQE-S AMT uses secure HTTPS. Access by multiple simultaneous browsers is supported.
To display the Channels Status Summary graph of active, inoperative, and inactive channels in the AMT VQE-S Status window, Adobe Flash Player must be installed on the computer that hosts the browser accessing the VQE-S AMT. Adobe Flash Player is free and can be found at this URL:
http://get.adobe.com/flashplayer/
To login to the VQE-S AMT, follow these steps:
Step 1
https://ip_addressorhttps://fully_qualified_domain_nameThe VQE-S AMT login dialog box is displayed.
Step 2
Step 3
If the username and password are valid, the AMT VQE-S Status window is displayed.
Figure 4-1 shows the VQE-S AMT navigation controls and buttons.
Figure 4-1 VQE-S AMT Navigation
The VQE-S AMT (see Figure 4-1) provides these controls and buttons for navigating and displaying VQE data:
•
–
–
•
•
•
•
•
Monitoring the Health of the VQE-S Processes
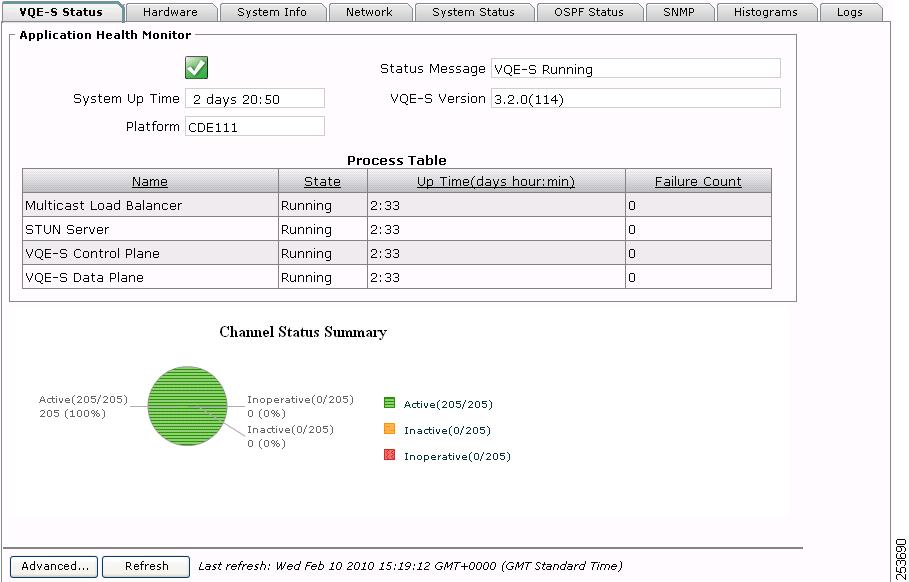
When you click the System node in the navigation tree and the VQE-S Status tab, the VQE-S AMT displays the VQE-S Status window (see Figure 4-2). The Application Health Monitor and a Channel Status Summary are displayed in the VQE-S Status window.
Figure 4-2 VQE-S Status Window
In the Application Health Monitor, a green icon with a check mark indicates that the VQE-S system is running and is healthy. A red icon with an X indicates one or more problems with the VQE-S processes.
Using the Application Health Monitor, you can view the following status information:
•
•
–
–
–
•
•
•
–
–
–
–
In the Process Table, Failure Count is the number of times the process has failed and been restarted by the VQE-S Process Monitor. The VQE-S Process Monitor is responsible for starting and monitoring the preceding processes.
The Channels Status Summary section provides the number of and a graph for active, inoperative, and inactive channels.
In addition to the VQE-S Status tab, you can get information on the VQE-S system on the eight other tabs. Table 4-2 lists the information that is available from each tab accessible from the System node.
Table 4-2 System Information
VQE-S Status
Application Health Monitor and Channel Status Summary.
Hardware
Processor and memory on the Cisco CDE that hosts the VQE-S.
Each CDE has two physical processors and four virtual processors.
System Info
Hostname, operating system version, date and time, Network Time Protocol servers, Domain Name System servers, and iptables information (trusted channel-provisioning servers).
Network
Output from the ifconfig and ip addr show lo commands.
•
•
System Status
Detailed information on host uptime, currently running processes, and file system disk space.
OSPF Status
Output from several commands that show OSPF information, including status, neighbors, interfaces, database, and routes.
SNMP
SNMP1 information on the VQE-S host taken from the snmpd.conf file.
Histograms
STB IGMP2 latency data is displayed in graphs and tables.
Logs
Most recent 300 lines from the following VQE-related log files are displayed:
•
•
•
•
•
1 SNMP = simple network management protocol.
2 IGMP = internet group management protocol.
Viewing Channel Configuration and Status
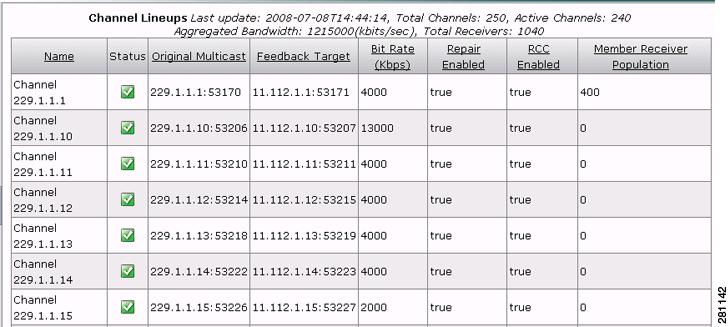
When you click the Channels node in the navigation tree, the VQE-S AMT displays the Channel Lineups window (see Figure 4-3).
Figure 4-3 Channel Lineups Window
Using the Channel Lineups window, you can do the following:
•
•
•
In Figure 4-3, the channel-lineup summary data indicates when the lineup was last updated (for example, with the VCPT) and provides totals for all channels and active channels as well as aggregated bandwidth and total receivers:
 Last update: 2007-08-06T14:15:31, Total Channels: 10, Active Channels: 9
Aggregated Bandwidth: 88000 (kbits/sec), Total Receivers: 0
The Channel Lineups window has the same information that is defined for channels using VCPT but has the following additions. For information on the other data that appears in the Channel Lineups table, see Table 3-3.
•
–
–
–
•
Viewing Channel Configuration
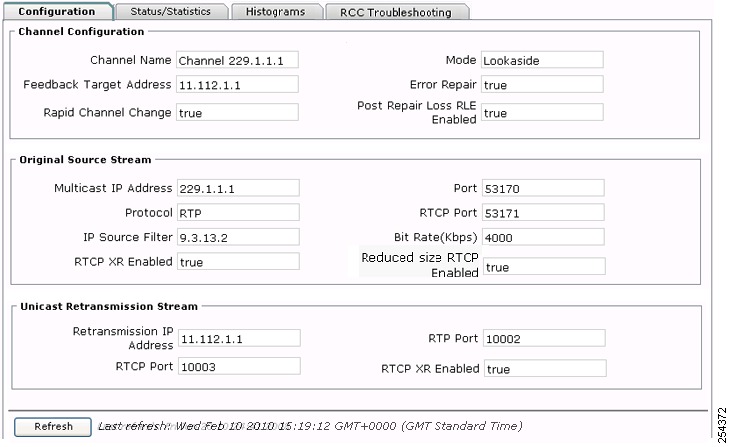
When you click a channel name in the navigation tree and then click the Configuration tab, the VQE-S AMT displays the Channel Configuration window (see Figure 4-4).
Figure 4-4 Channel Configuration Window
Table 4-3 lists the information presented in the Channel Configuration window.
Table 4-3 Channel Configuration
Channel Configuration
Channel Name
Name of the channel.
Feedback Target Address
Feedback Target IP address assigned on the VQE-S host.
RCC
•
•
Mode
Currently only Lookaside mode is supported.
Error Repair
•
•
Post Repair Loss RLE Enabled
•
•
Original Source Stream
Multicast IP Address
Multicast IP address for the channel's original source stream.
Protocol
Currently only RTP1 is supported.
IP Source Filter
Source IP address of the channel's original source stream.
RTCP XR Enabled
•
•
Port
Number of the port for the original source stream. When the protocol is RTP, this is the RTP port number.
RTCP Port
Number of the RTCP port for the original source stream.
Bit Rate (Kbps)
Bit rate configured for the original source stream.
Reduced size RTCP Enabled
•
•
Unicast Retransmission Stream
Retransmission IP Address
IP address of the Unicast Retransmission stream.
RTCP Port
Number of the RTCP port for the Unicast Retransmission stream.
RTP Port
Number of the RTP port for the Unicast Retransmission stream.
1 RTP = Real-Time Transport Protocol
Viewing Channel Statistics
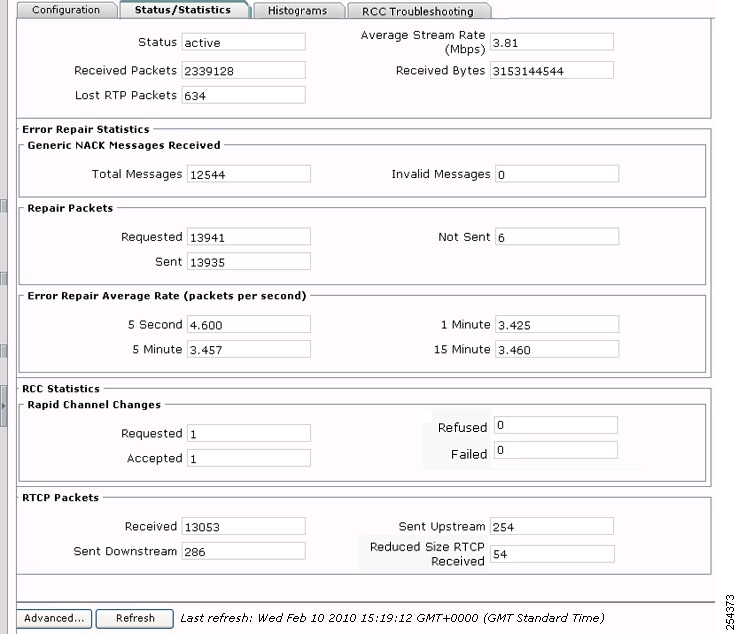
When you click a channel name in the navigation tree and then click the Statistics tab, the VQE-S AMT displays the Channel Statistics window (see Figure 4-5).
Figure 4-5 Channel Statistics Window
Table 4-4 lists the information presented in the Channel Statistics window.
Table 4-4 Channel Statistics
Channel Input Stream
Status
•
•
•
Received Packets
Number of RTP packets received by the VQE-S for this multicast stream.
This counter is resettable. For information on resetting counters, see the "Resetting VQE-S Counters" section.Lost RTP Packets
Number of RTP packets sent but not received by the VQE-S for this multicast stream. Lost RTP Packets, in general, specifies the number of missing input RTP packets for a channel, as determined by missing sequence numbers. Some lost packets can occur when a channel is first received because a few packets may be dropped internally by the VQE-S in the course of initializing the channel. After the channel has been initialized (typically less than a second delay), further increments in this counter may reflect lost packets in the network between the source of the RTP stream and the VQE-S.
This counter is resettable. For information on resetting counters, see the "Resetting VQE-S Counters" section.Average Stream Rate (Mbps)
Average megabits per second received by the VQE-S for this multicast stream.
Received Bytes
Number of bytes received by the VQE-S for this multicast stream.
This counter is resettable. For information on resetting counters, see the "Resetting VQE-S Counters" section.Error Repair Statistics—Generic NACK Messages Received
Total Messages
Number of NACK messages received by the VQE-S from VQE-C for this multicast stream.
This counter is resettable. For information on resetting counters, see the "Resetting VQE-S Counters" section.Invalid Messages
Number of invalid messages received by the VQE-S from VQE-C for this multicast stream. Invalid messages are received messages that, for example, cannot be parsed.
This counter is resettable. For information on resetting counters, see the "Resetting VQE-S Counters" section.Repair Packets
Requested
Number of RTP packets VQE-Cs have requested for ER1 for this multicast stream.
This counter is resettable. For information on resetting counters, see the "Resetting VQE-S Counters" section.Sent
Number of RTP packets sent by the VQE-S that have succeeded in repairing an error for this multicast stream.
This counter is resettable. For information on resetting counters, see the "Resetting VQE-S Counters" section.Not Sent
Number of failed RTP packets that were not repaired by the VQE-S for this multicast stream. The VQE-S may not be able to send an ER packet for the following reasons:
•
•
•
This counter is resettable. For information on resetting counters, see the "Resetting VQE-S Counters" section.
Error Repair Average Rate (packets per second)
5 second, 5 minute, 1 minute, 15 minute
The average number of packets per second that the VQE-S has sent to VQE-Cs to repair errors for this multicast stream for each time interval. Averages are calculated for ER each time interval over a period of time that is greater than the interval. For example, the 5 second calculation might be an average of 12 five-second intervals over a 1 minute period.
RCC Statistics—RCCs
Requested
Number of RCC requested for this channel.
This counter is resettable. For information on resetting counters, see the "Resetting VQE-S Counters" section.Accepted
Number of RCCs requested for this channel where the VQE-S has accepted the request and sent IPTV packets and other channel data to a VQE-C on the STB.
This counter is resettable. For information on resetting counters, see the "Resetting VQE-S Counters" section.Refused
Number of RCCs requested for this channel where the VQE-S refused the request. For example, the VQE-S may refuse an RCC request for the following reasons:
•
•
•
The Refused RCC counter is resettable. For information on resetting counters, see the "Resetting VQE-S Counters" section.
Failed
Number of RCCs that have failed. A VQE-C has made an RCC request, and the VQE-S has accepted the request and sent IPTV packets and other channel data to a VQE-C. But the RCC failed. For example, an RCC can fail if the VQE-C stops receiving the packets from the VQE-S earlier than expected.
This counter is resettable. For information on resetting counters, see the "Resetting VQE-S Counters" section.RTCP Packets
Received
Number of RTCP packets received by the VQE-S for this multicast stream.
This counter is resettable. For information on resetting counters, see the "Resetting VQE-S Counters" section.Sent Downstream
Number of RTCP packets that the VQE-S sent downstream for this multicast stream.
This counter is resettable. For information on resetting counters, see the "Resetting VQE-S Counters" section.Sent Upstream
Number of RTCP packets that the VQE-S sent upstream for this multicast stream.
This counter is resettable. For information on resetting counters, see the "Resetting VQE-S Counters" section.Reduced Size RTCP Received
Number of reduced-size RTCP NACK compound packets sent for this multicast stream.
1 ER = error repair
Viewing Channel Histograms
When you click a channel name in the navigation tree and then click the Histograms tab, the VQE-S AMT displays the Channel Histograms window (see Figure 4-6).
Note
Figure 4-6 Channel Histograms Window
In the Channel Histogram window, the Channel Change Time histogram and table are displayed. The data displayed in the histogram and table include the following:
•
•
•
•
Each time bucket in this histogram represents a subset of channel change times from 0 to 7000 ms. Any channel change times that take longer than 7000 ms are collected in the uppermost bucket.
Move the slider below the histogram to change the way in which the histogram is displayed.
Note
Viewing RCC Troubleshooting
When you click a channel name in the navigation tree and then click the RCC Troubleshooting tab, the VQE-S AMT displays the RCC Troubleshooting window (see Figure 4-7).
Figure 4-7 RCC Troubleshooting Window
The RCC Status window has the information listed in Table 4-5.
The table presents the last 20 RCC failures on this channel. To reorder the list of RCC failures, click a column heading. For example, clicking Timestamp orders the RCC failures by date and time.
Monitoring Unicast Retransmission and RCC
Note
Use the VQE-S AMT to view Error Repair and RCC statistics.
Viewing Error Repair and RCC Configuration
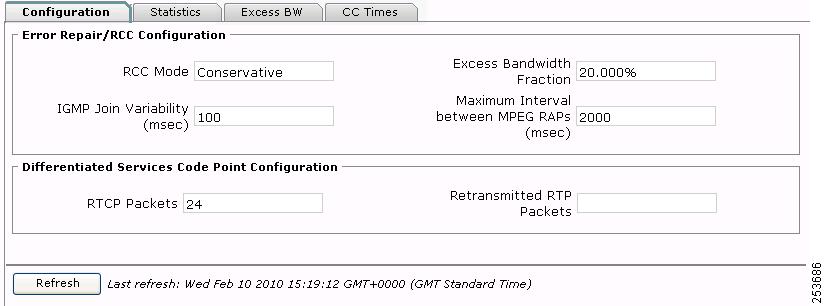
When you click Error Repair and RCC in the navigation tree and click the Configuration tab, the VQE-S AMT displays the Error Repair and RCC Configuration window (see Figure 4-8).
Figure 4-8 Error Repair and RCC Configuration Window
Table 4-6 lists the information in the Error Repair and RCC Configuration window. Each of the parameters listed in the table can be configured with the VQE Configuration Management System. For information on configuring the VQE-S, see Chapter 7 "Configuring VQE Server and VQE Tools."
Table 4-6 Error Repair and RCC Configuration
Error Repair/RCC Configuration
RCC Mode
RCC mode can be aggressive or conservative. This value is configured with the vqe.vqes.rcc_mode parameter in VCDB. For information on this parameter, see Table A-3.
IGMP Join Variability (msec)
Amount of variability (in milliseconds) between the fastest and slowest IGMP joins for RCC. This value is configured with the vqe.vqes.igmp_join_variability parameter. For information on this parameter, see Table A-3.
Excess Bandwidth Fraction
Percent of channel bandwidth that is available on the access link for Unicast Retransmission and RCC. This value is configured with the vqe.vqes.excess_bw_fraction parameter. For information on this parameter, see Table A-4.
Maximum Interval between MPEG RAPs (msec)
Maximum time interval (in milliseconds) between MPEG RAPs1 for the entire channel lineup. This value is configured with the vqe.vqes.rap_inteval parameter in VCDB. For information on this parameter, see Table A-3.
Differentiated Services Code Point Configuration
RTCP Packets
DCSP value for RTCP packets that the VQE-S sends. This value is configured with the vqe.vqes.rtcp_dscp parameter in VCDB. For information on this parameter, see Table A-1.
Retransmitted RTP Packets
DCSP value for RTP packets that the VQE-S sends. This value is configured with the vqe.vqes.rtp_trans_dscp parameter in VCDB. For information on this parameter, see Table A-1.
1 RAP = random access point.
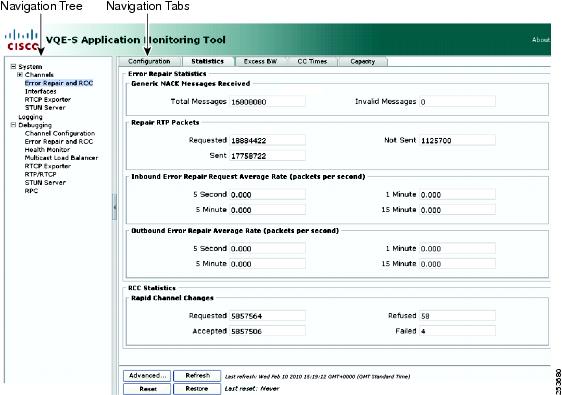
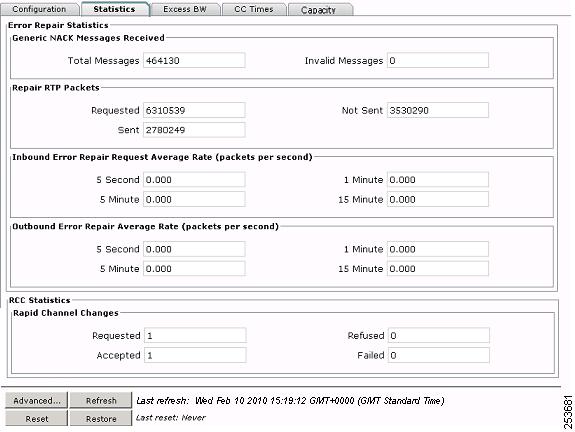
Viewing Error Repair and RCC Statistics
When you click Error Repair and RCC in the navigation tree and click the Statistics tab, the VQE-S AMT displays the Error Repair and RCC Statistics tab (see Figure 4-9). The statistics are similar to the Error Repair and RCC statistics displayed for individual channels but are for all channels in the current channel lineup.
The ER and RCC statistics are reset to 0 when the VQE-S service restarts or when the channel lineup changes.
Figure 4-9 Error Repair and RCC Statistics Tab
Table 4-7 lists the information in the Error Repair and RCC Statistics window.
Table 4-7 Error Repair and RCC Statistics
Generic NACK Messages Received
Total Messages
Number of NACK messages received by this VQE-S from the VQE-Cs.
This counter is resettable. For information on resetting counters, see the Resetting VQE-S Counters section.Invalid Messages
Number of invalid messages received by this VQE-S from VQE-Cs. Invalid messages are received messages that, for example, cannot be parsed.
This counter is resettable. For information on resetting counters, see the Resetting VQE-S Counters section.Repaired RTP Packets
Requested
Number of RTP packets VQE-Cs have requested for ER from this VQE-S.
This counter is resettable. For information on resetting counters, see the Resetting VQE-S Counters section.Sent
Number of RTP packets sent by this VQE-S that have succeeded in repairing an error.
This counter is resettable. For information on resetting counters, see the Resetting VQE-S Counters section.Not Sent
Number of failed RTP packets that were not repaired by the VQE-S. The VQE-S may not be able to send an ER packet for several reasons, among them:
•
•
•
The Repaired RTP Packets Not Sent counter is resettable. For information on resetting counters, see the Resetting VQE-S Counters section.
Inbound and Outbound Error Repair Average Rate (packets per second)
5 second, 5 minute,
1 minute, 15 minuteFor each time period, the average number of packets per second that the VQE-S has received (inbound) or sent (outbound) to VQE-Cs to repair errors (Unicast Retransmission).
RCC Statistics—Rapid Channel Changes
Requested
Number of RCCs requested for this channel.
This counter is resettable. For information on resetting counters, see the Resetting VQE-S Counters section.Accepted
Number of RCCs requested for this channel where the VQE-S has accepted the request and sent IPTV packets and other channel data to a VQE-C on the STB.
This counter is resettable. For information on resetting counters, see the Resetting VQE-S Counters section.Refused
Number of RCCs requested for this channel where the VQE-S has refused the request. For example, the VQE-S may refuse an RCC request for the following reasons:
•
•
•
This RCCs Refused counter is resettable. For information on resetting counters, see the Resetting VQE-S Counters section.
Failed
Number of RCCs that have failed. A VQE-C has made an RCC request, and the VQE-S has accepted the request and sent IPTV packets and other channel data to a VQE-C but the RCC failed. For example, an RCC can fail if the VQE-C stopped receiving RCC packets from the VQE-S earlier than was expected.
This counter is resettable. For information on resetting counters, see the Resetting VQE-S Counters section.
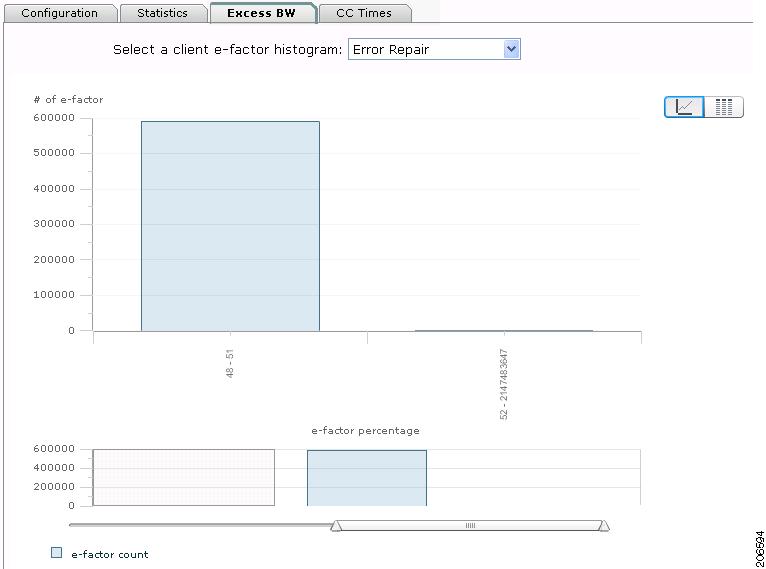
Viewing Excess Bandwidth
When you click Error Repair and RCC in the navigation tree and click the Excess BW tab, the VQE-S AMT displays the Excess BW window (see Figure 4-10).
Figure 4-10 Excess BW Window
If Error Repair or RCC is enabled and active, you can choose to display a client e-factor histogram or table by clicking the icons in the upper right corner of the window. Use the Select a client e-factor histogram drop-down menu to select Error Repair or RCC histograms.
An e-factor is an excess bandwidth fraction that determines the rate at which packets are sent during Error Repair and RCC. The data displayed in the histograms and tables include the following:
•
•
Move the slider below the histograms to change the way in which the histograms are displayed. The e-factor percentages cannot be negative values.
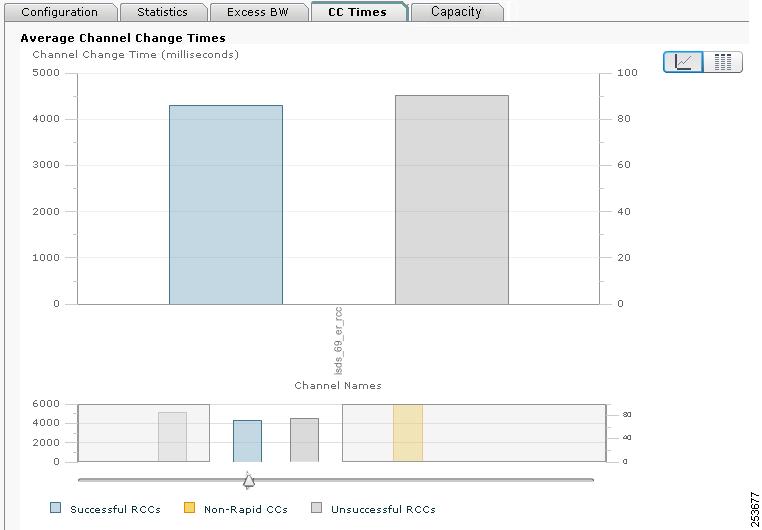
Viewing Channel Change Times
When you click Error Repair and RCC in the navigation tree and click the CC Times tab, the VQE-S AMT displays the CC Times window (see Figure 4-11).
Figure 4-11 Channel Change Times Window
In this window, the Average Channel Change Time histogram and table are displayed. The data displayed in the histogram and table includes the following:
•
–
–
–
The data displayed is based on the last 100 successful channel changes where RCC was enabled, the last 100 unsuccessful change changes where RCC was enabled, and the last 100 channel changes where RCC was disabled.
Move the slider below the histogram to change the way in which the histogram is displayed.
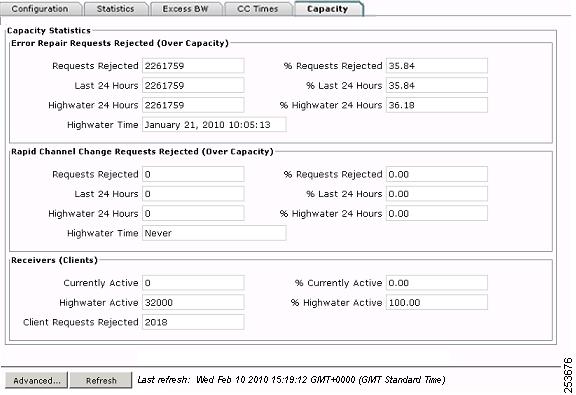
Viewing Error Repair and RCC Capacity Statistics
When you click Error Repair and RCC in the navigation tree and click the Capacity tab, the VQE-S AMT displays the Error Repair and RCC Capacity tab (Figure 4-12). The VQE-S provides capacity statistics to indicate when Unicast Retransmission and RCC capacity limits have been exceeded.
The ER and RCC capacity counters and statistics are reset to 0 when the VQE-S service restarts or when the channel lineup changes.
Figure 4-12
Error Repair and RCC Capacity Tab
Table 4-8 lists the information presented in the Error Repair and RCC Capacity tab.
Table 4-8 Error Repair and RCC Capacity Statistics
Error Repair Requests Rejected (Over Capacity)
Requests Rejected
Number of ER requests rejected due to ER capacity limits being exceeded since the VQE-S service was last started. For information on the maximum number of ER requests and the maximum number of output ER packets, see Table H-4.
This counter is resettable. For information on resetting counters, see the Resetting VQE-S Counters section.% Requests Rejected
Percentage of ER requests rejected due to ER capacity limits being exceeded out of the total number of ER requests received. For information on the maximum number of ER requests and the maximum number of output ER packets, see Table H-4.
This counter is resettable. For information on resetting counters, see the Resetting VQE-S Counters section.Last 24 Hours
Number of ER requests rejected in the last 24 hours due to ER capacity limits being exceeded. For information on the maximum number of ER requests and the maximum number of output ER packets, see Table H-4.
% Last 24 Hours
Percentage of ER requests rejected in the last 24 hours due to ER capacity limits being exceeded out of the total number of ER requests received during that same 24 hour period. For information on the maximum number of ER requests and the maximum number of output ER packets, see Table H-4.
Highwater 24 Hours
Highest number of ER requests rejected during any 24 hour period due to ER capacity limits being exceeded. For information on the maximum number of ER requests and the maximum number of output ER packets, see Table H-4.
% Highwater 24 Hours
Percentage of ER requests rejected during the highest 24 hour period due to ER capacity limits being exceeded out of the total number of ER requests received during that same 24 hour period. For information on the maximum number of ER requests and the maximum number of output ER packets, see Table H-4.
Highwater Time
Date and time when the highwater mark was reached.
RCC Requests Rejected (Over Capacity)
Requests Rejected
Number of RCC requests rejected due to RCC capacity limits being exceeded since the VQE-S service was last started. For information on the allocation of egress bandwidth to servicing RCC requests, see the "Scaling and Performance Summary" section.
This counter is resettable. For information on resetting counters, see the Resetting VQE-S Counters section.% Requests Rejected
Percentage of RCC requests rejected due to RCC capacity limits being exceeded out of the total number of RCC requests received. For information on the allocation of egress bandwidth to servicing RCC requests, see the "Scaling and Performance Summary" section.
This counter is resettable. For information on resetting counters, see the Resetting VQE-S Counters section.Last 24 Hours
Number of RCC requests rejected in the last 24 hours due to RCC capacity limits being exceeded. For information on the allocation of egress bandwidth to servicing RCC requests, see the "Scaling and Performance Summary" section.
% Last 24 Hours
Percentage of RCC requests rejected in the last 24 hours due to RCC capacity limits being exceeded out of the total number of RCC requests received during that same 24 hour period. For information on the allocation of egress bandwidth to servicing RCC requests, see the "Scaling and Performance Summary" section.
Highwater 24 Hours
Highest number of RCC requests rejected during any 24 hour period due to RCC capacity limits being exceeded. For information on the allocation of egress bandwidth to servicing RCC requests, see the "Scaling and Performance Summary" section.
% Highwater 24 Hours
Percentage of RCC requests rejected during the highest 24 hour period due to RCC capacity limits being exceeded out of the total number of RCC requests received during that same 24 hour period. For information on the allocation of egress bandwidth to servicing RCC requests, see the "Scaling and Performance Summary" section.
Highwater Time
Date and time when the highwater mark was reached.
Receivers (Clients)
Currently Active
Number of receivers currently active on the VQE-S.
% Currently Active
Percentage of receivers currently active on the VQE-S out of the total number of allowed receivers. For information on the maximum number of simultaneous receivers, see Table H-4.
Highwater Active
Highest number of receivers simultaneously active on the VQE-S.
% Highwater Active
Percentage of receivers simultaneously active at the highwater mark out of the total number of allowed receivers. For information on the maximum number of simultaneous receivers, see Table H-4.
Client Requests Rejected
Number of client requests rejected due to the maximum number of simultaneous receivers being exceeded. For information on the maximum number of simultaneous receivers, see Table H-4.
This counter is resettable. For information on resetting counters, see the Resetting VQE-S Counters section.
Monitoring Interfaces
When you click Interfaces in the navigation tree, the VQE-S AMT displays three tables associated with the CDE Ethernet and bond interfaces: the Interface Summary Table, the Input Bandwidth Table, and the Multicast Group Table. Figure 4-13 shows these tables. (In Figure 4-13, some channels in the Multicast Group Table have been omitted.)
Figure 4-13 Interface-related Tables
Table 4-9 lists the information presented in the Interface Summary Table (shown in Figure 4-13). The information is about the Ethernet and bond interfaces on the Cisco CDE that are currently configured for the VQE-S ingest and services traffic.
Table 4-9 Interface Summary Table
I/F Name
Name that is assigned to the Ethernet interface or bond interface by Linux. For information on these names, see "Configuring the Linux Operating System for the VQE-S" section.
IP Address
IP address of one of the following interfaces:
•
•
•
Status
Interface is either up or down.
Role
One or more of the following:
•
•
•
•
Max BW (Mbps)
Maximum speed of the interface.
Table 4-10 lists information about the Input Bandwidth Table shown in Figure 4-13. The table provides information on the Ethernet interfaces or bond interfaces currently being used for VQE-S ingest traffic. The interfaces listed in this table are currently under the control of the VQE-S Multicast Load Balancer.
Multicast Load Balancer distributes traffic for incoming multicast streams over the Ethernet interfaces that are configured for ingest. If a bond interface is used for ingest traffic, the Multicast Load Balancer distributes traffic over the Ethernet interfaces that are members of the bond interface. The interfaces must be correctly configured and operational (up) to participate in this load balancing. The Multicast Load Balancer determines the best interface on which to join or leave the multicast group, distributing the joins across available interfaces to avoid oversubscription. It also monitors the status of these interfaces, moving the streams to other interfaces in case of interface failure.
Table 4-11 lists the information about the Multicast Group Table shown in Figure 4-13. The table provides information about the multicast streams currently being received by this VQE-S.
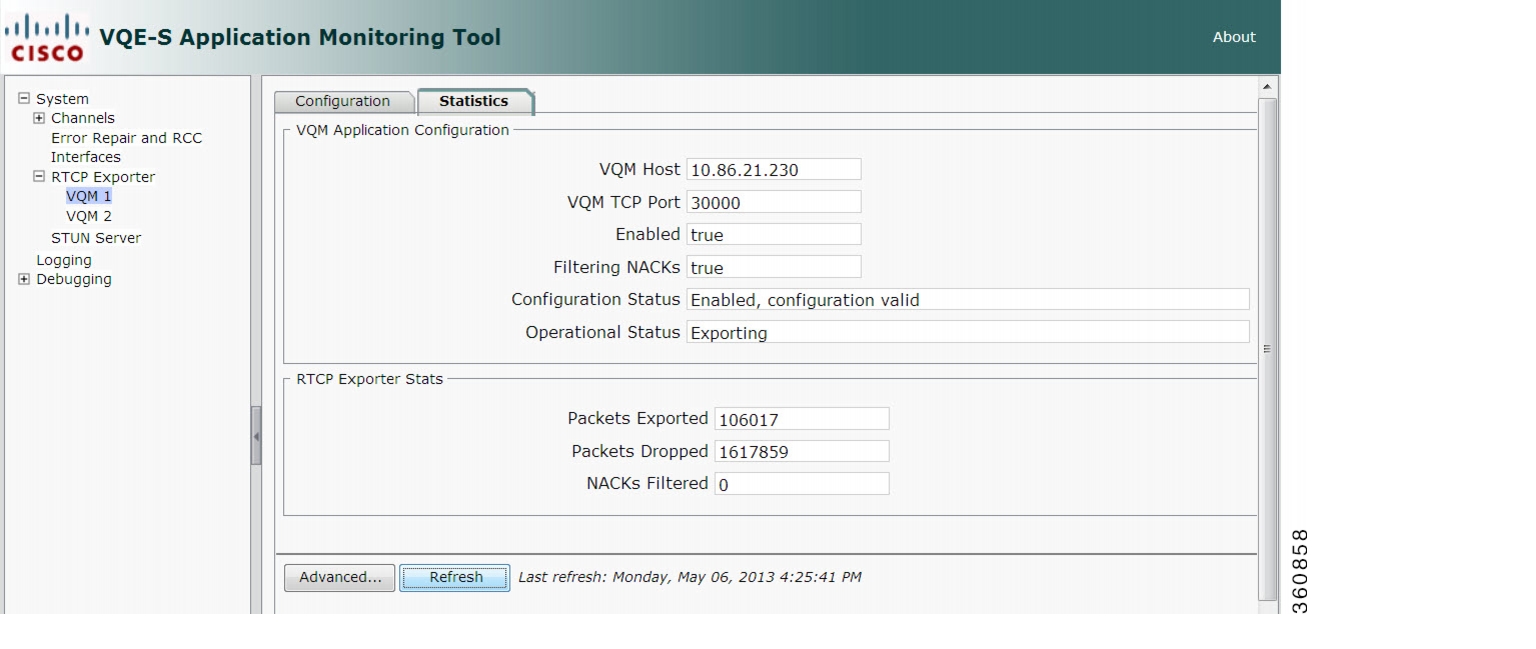
Monitoring RTCP Exporter
When you click RTCP Exporter > VQM in the navigation tree and click the Configuration tab, the VQE-S AMT displays the VQE-S RTCP Exporter parameters for the corresponding VQM. RTCP Exporter currently has no parameters that can be configured with the VQE-S AMT, and the parameters are for viewing only. For information on configuring RTCP Exporter, see the "Configuring the VQE-S RTCP Exporter" section.
When you click RTCP Exporter > VQM in the navigation tree and click the Statistics tab, the VQE-S AMT displays the RTCP Exporter Statistics window for the corresponding VQM (see Figure 4-14).
Note
Figure 4-14 RTCP Exporter Statistics Window
Table 4-12 lists the information presented in the RTCP Exporter Statistics window.
For information on RTCP Exporter and the video-quality monitoring application, see the "VQE-S RTCP Exporter for Video-Quality Monitoring" section.
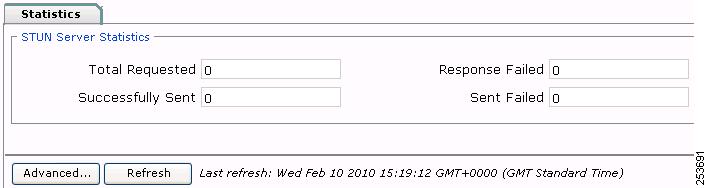
Monitoring the STUN Server
When you click STUN Server in the navigation tree, the VQE-S AMT displays the STUN Server Statistics window (see Figure 4-15).
Figure 4-15 STUN Server Statistics Window
Table 4-13 lists information displayed in the STUN Server Statistics window.
Resetting VQE-S Counters
The VQE-S maintains a set of counters for debugging purposes. A subset of counters can be manually reset from the VQE-S AMT GUI. The results of this action are visible to all AMT users, even those in separate AMT browser sessions. The Reset button is located on the Statistics tab of the Error Repair and RCC window, and resets all counters displayed in Table 4-14 to zero.
Note
To reset counters, do the following:
Step 1
The Configuration tab is displayed on the Error Repair and RCC window.
Step 2
The Reset button is displayed on the Statistics tab.
Step 3
The values of all counters listed in Table 4-13 are reset to zero. The last reset timestamp is updated to display the current time.
Restoring VQE-S Counters
Following a reset of the subset of counters listed in Table 4-14, you can restore counters from the VQE-S AMT GUI to display their cumulative value since the last start of the VQE-S service.
Note
To reset counters, do the following:
Step 1
The Configuation tab is displayed on the Error Repair and RCC window.
Step 2
The Restore button is displayed on the Statistics tab.
Step 3
All counters that were reset now display their cumulative value. The last reset timestamp is updated to display the text never.
Change VQE-S Logging
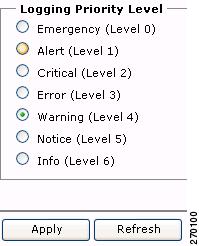
When you click Logging in the navigation tree, the VQE-S AMT displays the logging priority levels (Figure 4-16) for the VQE-S. The priority levels allow you to control the logging level for system messages for all VQE-S processes (Process Monitor, Control Plane, Data Plane, and Multicast Load Balancer). By default, all VQE-S system messages are written to the file /var/log/vqe/vqe.log. In addition, you can send system messages to remote servers for centralized logging. For information on configuring remote syslog servers, see the "Remote Syslog Hosts" section.
Figure 4-16 Logging Priority Levels
To change a VQE-S logging priority level, click the button next to the appropriate level and click Apply.
In VQE-S AMT, the logging priority levels are listed from least verbose to most verbose. The Emergency level generates the smallest number of messages, and the Info level generates the greatest number of messages. The default value is Warning.
When you select a logging level, log messages are generated for the levels below that level. For example, when the level is set to Error, messages are generated for Emergency, Alert, Critical, and Error.
The selected logging priority level does not persist when the VQE-S is stopped. When the VQE-S restarts, the logging priority level goes back to the default (Warning). To set a logging priority level that does persist, use the VQE-S parameter vqe.vqes.log_priority. For information on this parameter, see Table A-1.
Change VQE-S Debugging
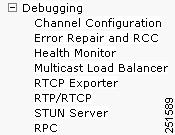
When you click Debugging in the navigation tree and click a debug component, the debugging options for that component are displayed. Figure 4-17 shows the debug components. The options allow you to control the types of debugging messages that are written to the syslog file. By default, debug messages are written to the file /var/log/vqe/vqe.log.
Figure 4-17 Debug Components
To change VQE-S debugging, follow these steps:
Step 1
The debug flags and filters for that component are displayed.
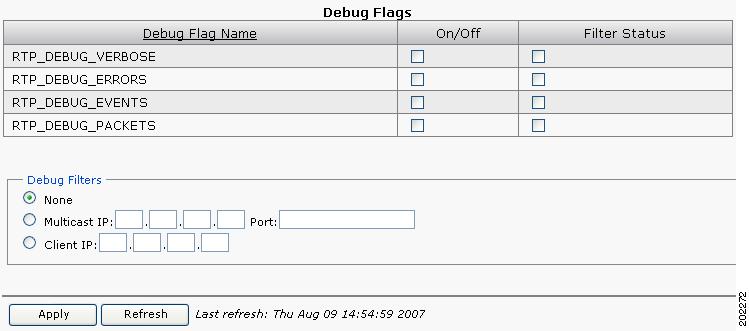
For example, Figure 4-18 shows the flags and filters for the RTP/RTCP category.
Figure 4-18 RTP/RTCP Flags and Filters
Note
Step 2
Note
Step 3
a.
b.
•
•
Step 4
The selected debugging options are enabled.
The selected debugging options do not persist when the VQE-S is stopped. When the VQE-S restarts, debugging goes back to the default—no options are enabled.