-
Cisco CPT Configuration Guide–CTC and Documentation Release 9.3 and Cisco IOS Release 15.1(01)SA
-
Preface
-
Understanding the Carrier Packet Transport System
-
Hardware
-
Configuring Ethernet Virtual Circuit
-
Configuring Multiprotocol Label Switching
-
Configuring MPLS–Transport Profile
-
Configuring Pseudowire
-
Configuring Quality of Service
-
Configuring High Availability
-
Configuring Resilient Ethernet Protocol
-
Configuring Link Aggregation Group and Link Aggregation Control Protocol
-
Configuring MAC Learning
-
Configuring Multicast VLAN Registration
-
Configuring IGMP Snooping
-
Configuring Performance Monitoring, RMON, OTN, and Port Provisioning
-
Configuring Local Authentication
-
Configuring Cisco Discovery Protocol
-
Alarm Troubleshooting
-
SNMP
-
CPT Error Messages
-
Network Element Defaults
-
Index
-
 Feedback
Contents
- Configuring Performance Monitoring, RMON, OTN, and Port Provisioning
- Understanding Performance Monitoring
- Understanding Threshold Performance Monitoring
- Performance Monitoring, RMON, OTN, and Port Provisioning Procedures
- NTP-J23 Change the PM Display Using CTC
- DLP-J61 Refresh PM Counts at 15–Minute Intervals Using CTC
- DLP-J62 Refresh PM Counts at One–Day Intervals Using CTC
- DLP-J63 View Near–End PM Counts Using CTC
- DLP-J64 View Far-End PM Counts Using CTC
- DLP-J65 Reset Current PM Counts Using CTC
- DLP-J66 Clear Selected PM Counts Using CTC
- DLP-J67 Clear All PM Thresholds Using CTC
- DLP-J68 Set the Auto–Refresh Interval for Displayed PM Counts Using CTC
- NTP-J24 Monitor Performance Using CTC
- DLP-J72 Display Performance Monitoring Parameters Using Cisco IOS Commands
- DLP-J69 Provision PPM and Port Using CTC
- DLP-J70 View Optics PM Parameters Using CTC
- DLP-J71 View Payload PM Parameters Using CTC
- Understanding RMON
- NTP-J25 Configure RMON Settings
- DLP-J74 Configure RMON Settings Using Cisco IOS Commands
- Display RMON Status Using Cisco IOS Commands
- DLP-J73 Change the RMON Thresholds Using CTC
- Understanding OTN
- NTP-J26 Configure OTN Settings
- DLP-J75 Change the Optical Transport Network Settings Using CTC
- DLP-J76 View OTN PM Parameters Using CTC
- NTP-J27 Modify the Ethernet Settings and Alarm Thresholds
- DLP-J77 Provision Alarm and TCA Thresholds Using CTC
- Carrier Delay
- DLP-J78 Change the Port and Ethernet Settings Using CTC
Configuring Performance Monitoring, RMON, OTN, and Port Provisioning
This chapter describes performance monitoring, RMON, and OTN, port provisioning and the configuration procedures.
- Understanding Performance Monitoring
- Understanding Threshold Performance Monitoring
- Performance Monitoring, RMON, OTN, and Port Provisioning Procedures
- NTP-J23 Change the PM Display Using CTC
- NTP-J24 Monitor Performance Using CTC
- Understanding RMON
- Understanding OTN
- NTP-J27 Modify the Ethernet Settings and Alarm Thresholds
Understanding Performance Monitoring
Performance monitoring (PM) parameters are used by service providers to gather, store, set thresholds, and report performance data for early detection of problems. In this chapter, PM parameters and concepts are defined for the fabric card, line card, and CPT 50 panel.
NoteFor additional information regarding PM parameters, see the ITU G.826, ITU-T G.8021, ITU G.709, Telcordia documents GR-1230-CORE, GR-820-CORE, GR-499-CORE, and GR-253-CORE, and the ANSI T1.231 document entitled Digital Hierarchy - Layer 1 In-Service Digital Transmission Performance Monitoring.
NoteIn CPT IOS, performance monitoring statistics are provided only for 15 minute and 1 day intervals. Historical counts are not maintained in CPT IOS.
Understanding Threshold Performance Monitoring
Thresholds are used to set error levels for each PM parameter. You can set individual PM threshold values from the card view in the Provisioning tab in CTC.
Each monitored performance parameter has corresponding threshold values for the current time period. If the value of the counter exceeds the threshold value for a particular 15-minute interval, a threshold crossing alert (TCA) is raised. The number represents the counter value for each specific PM parameter.
TCAs provide early detection of performance degradation. When a threshold is crossed, the node continues to count the errors during a given accumulation period. If zero is entered as the threshold value, generation of TCAs is disabled but performance monitoring continues.
Change the threshold value if the default value does not meet your error monitoring needs. For example, customers with a critical OC192/STM64 transponder installed for 911 calls must guarantee the best quality of service on the line; therefore, they lower all thresholds on the client side so that the slightest error raises a TCA.
Performance Monitoring, RMON, OTN, and Port Provisioning Procedures
The following procedures can be performed using Cisco IOS commands to configure performance monitoring, RMON, OTN, and port provisioning:
- DLP-J72 Display Performance Monitoring Parameters Using Cisco IOS Commands
- DLP-J74 Configure RMON Settings Using Cisco IOS Commands
- Display RMON Status Using Cisco IOS Commands
The following procedures can be performed using CTC to configure performance monitoring, RMON, OTN, and port provisioning:
NTP-J23 Change the PM Display Using CTC
Procedure
Step 1 Complete the NTP-J22 Log into CTC procedure at a node where you want to change the appearance of PM counts. Step 2 As needed, use the following procedures to change the display of PM counts:
- DLP-J61 Refresh PM Counts at 15–Minute Intervals Using CTC
- DLP-J62 Refresh PM Counts at One–Day Intervals Using CTC
- DLP-J63 View Near–End PM Counts Using CTC
- DLP-J64 View Far-End PM Counts Using CTC
- DLP-J65 Reset Current PM Counts Using CTC
- DLP-J66 Clear Selected PM Counts Using CTC
- DLP-J67 Clear All PM Thresholds Using CTC
- DLP-J68 Set the Auto–Refresh Interval for Displayed PM Counts Using CTC
Stop. You have completed this procedure.
DLP-J61 Refresh PM Counts at 15–Minute Intervals Using CTC
Procedure
Step 1 Complete the NTP-J22 Log into CTC procedure at a node where you want to change the window view to display PM counts in 15–minute intervals. Step 2 In node view, right-click the fabric or line card and choose Open Packet Transport System View. The Packet Transport System View dialog box appears. Step 3 Double-click a fabric card, line card, or CPT50 panel. Step 4 Click the Performance tab. Step 5 To change the PM interval to 15 minutes for a subtab, click the relevant subtabs.
Note Performance subtabs vary depending on the card. Step 6 To change the PM interval to 15 minutes for a specific port, select the port from the Ports drop-down list (when available). Step 7 Click the 15 min radio button. Step 8 Click Refresh. PM parameters appear in 15-minute intervals synchronized with the time of day. Step 9 View the Curr column to find PM counts for the current 15-minute interval. Each monitored performance parameter has corresponding threshold values for the current time period. If the value of the counter exceeds the threshold value for a particular 15-minute interval, a TCA is raised. The number represents the counter value for each specific PM parameter.
Step 10 View the Prev-n columns to find PM counts for the previous 15-minute intervals.
Note If a complete 15-minute interval count is not possible, the value appears with a yellow background. An incomplete or incorrect count can be caused by monitoring for less than 15 minutes after the counter started, changing the node timing settings, changing the time zone settings, replacing a card, resetting a card, or changing port service states. When the problem is corrected, the subsequent 15-minute interval appears with a white background. Step 11 Return to your originating procedure (NTP).
DLP-J62 Refresh PM Counts at One–Day Intervals Using CTC
Procedure
Step 1 Complete the NTP-J22 Log into CTC procedure at a node where you want to change the PM count display interval. Step 2 In node view, right-click the fabric or line card and choose Open Packet Transport System View. The Packet Transport System View dialog box appears. Step 3 Double-click a fabric card, line card, or CPT50 panel. Step 4 Click the Performance tab. Step 5 To change the PM interval to one day for a subtab, click the relevant subtabs.
Note Performance subtabs vary depending on the card. Step 6 To change the PM interval to one day for a specific port, select the port from the Ports drop-down list (when available). Step 7 Click the 1 day radio button. Step 8 Click Refresh. PM parameters appear in one day intervals synchronized with the time of day. Step 9 View the Curr column to find PM counts for the current one day interval. Each monitored performance parameter has corresponding threshold values for the current time period. If the value of the counter exceeds the threshold value for a particular one day interval, a TCA is raised. The number represents the counter value for each specific PM parameter.
Step 10 View the Prev-n columns to find PM counts for the previous one day intervals.
Note If a complete count over a one day interval is not possible, the value appears with a yellow background. An incomplete or incorrect count can be caused by monitoring for less than 24 hours after the counter started, changing the node timing settings, changing the time zone settings, replacing a card, resetting a card, or changing port service states. When the problem is corrected, the subsequent one day interval appears with a white background. Step 11 Return to your originating procedure (NTP).
DLP-J63 View Near–End PM Counts Using CTC
Procedure
Purpose This procedure displays the near–end PM counts for the selected card and port using CTC.
Tools/Equipment None Prerequisite Procedures None Required/As Needed As needed Onsite/Remote Onsite or remote Security Level Provisioning or higher
NoteNear-end PM parameters are available only for OTN.
Step 1 Complete the NTP-J22 Log into CTC procedure at a node where you want to view the near-end PM counts. Step 2 In node view, right-click the fabric or line card and choose Open Packet Transport System View. The Packet Transport System View dialog box appears. Step 3 Double-click a fabric card, line card, or CPT50 panel. Step 4 Click the Performance tab. Step 5 To view the near-end PM counts for a subtab, click the relevant subtabs.
Note Performance subtabs vary depending on the card. Step 6 To view near-end PM counts for a specific port, select the port from the Ports drop-down list (when available). Step 7 Click the Near End radio button (when available). Viewing near-end PM counts is not available on some tabs. Step 8 Click Refresh. All the current PM parameters for the selected card on the incoming signal appear. Step 9 View the Curr column to find PM counts for the current time interval. Step 10 View the Prev-n columns to find PM counts for the previous time intervals. Step 11 Return to your originating procedure (NTP).
DLP-J64 View Far-End PM Counts Using CTC
Procedure
Purpose This procedure displays the far-end PM parameters for the selected card and port using CTC.
Tools/Equipment None Prerequisite Procedures None Required/As Needed As needed Onsite/Remote Onsite or remote Security Level Provisioning or higher
NoteFar-end PM parameters are available only for OTN.
Step 1 Complete the NTP-J22 Log into CTC procedure at a node where you want to view the far-end PM counts. Step 2 In node view, right-click the fabric or line card and choose Open Packet Transport System View. The Packet Transport System View dialog box appears. Step 3 Double-click a fabric card, line card, or CPT50 panel. Step 4 Click the Performance tab. Step 5 To view the far-end PM counts for a subtab, click the relevant subtabs.
Note Performance subtabs vary depending on the card. Step 6 To view the far-end PM counts for a specific port, select the port from the Ports drop-down list (when available). Step 7 Click the Far End radio button (when available). Viewing far-end PM counts is not available on some tabs. Step 8 Click Refresh. All the PM parameters recorded by the far-end node for the selected card on the outgoing signal appear. Step 9 View the Curr column to find PM counts for the current time interval. Step 10 View the Prev-n columns to find PM counts for the previous time intervals. Step 11 Return to your originating procedure (NTP).
DLP-J65 Reset Current PM Counts Using CTC
Procedure
Step 1 Complete the NTP-J22 Log into CTC procedure at a node where you want to reset the current PM counts. Step 2 In node view, right-click the fabric or line card and choose Open Packet Transport System View. The Packet Transport System View dialog box appears. Step 3 Double-click a fabric card, line card, or CPT50 panel. Step 4 Click the Performance tab. Step 5 To reset the PM counts for a subtab, click the relevant subtabs.
Note Performance subtabs vary depending on the card. Step 6 To reset the PM counts for a specific port, select the port from the Ports drop-down list (when available). Step 7 Click Baseline.
Note The Baseline button clears the PM counts that appear in the current time interval but does not clear the PM counts on the card. When the current time interval expires or the window view changes, the total number of PM counts on the card and in the window appears in the appropriate column. The baseline values are discarded if you change views to a different window and then return to the Performance window. Step 8 In the Baseline Statistics dialog box, click one of the following radio buttons:
- All statistics for port x—Resets all the PM counts associated with all the combinations of the statistics on the selected port from the card and the window. This means that all time intervals, directions, and signal type counts are reset from the card and the window.
- All statistics for card—Resets all the PM counts for all the ports from the card and the window.
Step 9 In the Baseline Statistics dialog box, click Set Baseline to reset the selected statistics. Step 10 View the current statistics columns to observe changes to PM counts for the current time interval. Step 11 Return to your originating procedure (NTP).
DLP-J66 Clear Selected PM Counts Using CTC
Procedure
Purpose This procedure clears the selected PM counts using CTC.
Tools/Equipment None Prerequisite Procedures None Required/As Needed As needed Onsite/Remote Onsite or remote Security Level Provisioning or higher
Caution
Clicking the Clear button can mask problems if used incorrectly. This button is commonly used for testing purposes. After clicking this button, the current count is marked invalid. Also note that the unavailable seconds (UAS) count is not cleared if you were counting UAS; therefore, this count could be unreliable when you click Clear.
NoteThe CTC and IOS interface counters are mutually exclusive. When you clear the counters through CTC (Card view -> Performance or Card view -> Performance -> Payload PM), the IOS counters are not cleared. When you clear the counters through IOS using the clear count command, the CTC counters are not cleared. The baseline is maintained separately for both the CTC and IOS counters. The user must not view the IOS counters if the configuration mode is in CTC mode and vice versa.
Step 1 Complete the NTP-J22 Log into CTC procedure at a node where you want to clear the selected PM counts. Step 2 In node view, right-click the fabric or line card and choose Open Packet Transport System View. The Packet Transport System View dialog box appears. Step 3 Double-click a fabric card, line card, or CPT50 panel. Step 4 Click the Performance tab. Step 5 To clear the selected PM counts for a subtab, click the relevant subtabs and click Clear.
Note Performance subtabs vary depending on the card. Step 6 To clear the selected PM counts for a specific port, select the OTN subtab or port from the Ports drop-down list (when available). Step 7 Click Clear. Step 8 In the Clear Statistics dialog box, click one of the following radio buttons:
- All statistics for port x—Clears all the statistics for port x by erasing all the PM counts associated with all the combinations of the statistics on the selected port from the card and the window. This means that all time intervals, directions, and signal type counts are erased from the card and the window.
- All statistics for card—Clears all the statistics for the card by erasing all the PM counts for all the ports from the card and the window.
Step 9 In the Clear Statistics dialog box, click OK to clear the selected statistics. Click Yes to confirm the change. Step 10 Verify that the selected PM counts have been cleared. Step 11 Return to your originating procedure (NTP).
DLP-J67 Clear All PM Thresholds Using CTC
Procedure
Purpose This procedure clears all the PM thresholds using CTC.
Tools/Equipment None Prerequisite Procedures None Required/As Needed As needed Onsite/Remote Onsite or remote Security Level Provisioning or higher
Caution
Clicking the Reset button can mask problems if used incorrectly. This button is commonly used for testing purposes.
Step 1 Complete the NTP-J22 Log into CTC procedure at a node where you want to clear all the PM thresholds. Step 2 In node view, right-click the fabric or line card and choose Open Packet Transport System View. The Packet Transport System View dialog box appears. Step 3 Double-click a fabric card, line card, or CPT50 panel. Step 4 Click the Provisioning tab. Step 5 Click the Thresholds subtabs. The subtab names vary depending on the selected card. Step 6 Click Reset to Default. Step 7 Click Yes in the Reset to Default dialog box. Step 8 Verify that the PM thresholds have been reset. Step 9 Return to your originating procedure (NTP).
DLP-J68 Set the Auto–Refresh Interval for Displayed PM Counts Using CTC
Procedure
Step 1 Complete the NTP-J22 Log into CTC procedure at a node where you want to set the auto-refresh interval for displayed PM counts. Step 2 In node view, right-click the fabric or line card and choose Open Packet Transport System View. The Packet Transport System View dialog box appears. Step 3 Double-click a fabric card, line card, or CPT50 panel. Step 4 Click the Performance tab. Step 5 To set the PM auto-refresh interval for a subtab, click the relevant subtabs.
Note Performance subtabs vary depending on the card. Step 6 To set the PM auto-refresh interval for a specific port, select the port from the Ports drop-down list (when available). Step 7 From the Auto-refresh drop-down list, choose one of the following options:
- None: Disables the auto-refresh feature.
- 15 Seconds—This option sets the window auto-refresh at 15-seconds time interval.
- 30 Seconds—Sets the window auto-refresh at 30-seconds time interval.
- 1 Minute—Sets the window auto-refresh at one minute time interval.
- 3 Minutes—Sets the window auto-refresh at three minutes time interval.
- 5 Minutes—Sets the window auto-refresh at five minutes time interval.
Step 8 Click Refresh. The PM counts for the newly selected auto-refresh time interval appear. Depending on the selected auto-refresh interval, the displayed PM counts automatically update when each refresh interval completes. If the auto-refresh interval is set to None, the PM counts that appear are not updated unless you click Refresh.
Step 9 Return to your originating procedure (NTP).
NTP-J24 Monitor Performance Using CTC
Procedure
Purpose This procedure monitors the near-end or far-end performance of the node for selected time intervals on the fabric and line cards.
Tools/Equipment None Prerequisite Procedures Ensure you have created the appropriate circuits and provisioned the card according to your specifications. Required/As Needed As needed Onsite/Remote Onsite or remote Security Level Provisioning or higher
Step 1 Complete the NTP-J22 Log into CTC procedure at the node that you want to monitor the performance. Step 2 Complete the following procedures as needed to view the PM parameters for the fabric, line card, or CPT 50 shelf:
Note To refresh, reset, or clear PM counts, see the NTP-J23 Change the PM Display Using CTC procedure.
Stop. You have completed this procedure.
DLP-J72 Display Performance Monitoring Parameters Using Cisco IOS Commands
Procedure
Purpose This procedure displays the performance monitoring parameters using Cisco IOS commands.
Tools/Equipment None Prerequisite Procedures None Required/As Needed As needed Onsite/Remote Onsite or remote Security Level Provisioning or higher
NoteIn CPT IOS, performance monitoring statistics are provided only for 15 minute and 1 day intervals. Historical counts are not maintained in CPT IOS. FEC, optical transport network (OTN), alarm, and TCA thresholds are not provided through CPT IOS.
DLP-J69 Provision PPM and Port Using CTC
Procedure
Step 1 Complete the NTP-J22 Log into CTC procedure at a node where you want to provision a PPM and port. Step 2 In the node view, right-click the fabric or line card and choose Open Packet Transport System View. The Packet Transport System View dialog box appears. Step 3 In the Packet Transport System View dialog box, double-click a fabric card, line card, or CPT50 panel. Step 4 Click the Provisioning > Pluggable Port Modules tabs. Step 5 In the Pluggable Port Modules area, click Create. The Create PPM dialog box appears. Step 6 In the Create PPM dialog box, complete the following: Step 7 Click OK. The newly created PPM appears in the Pluggable Port Modules area. The row in the Pluggable Port Modules area becomes white when the PPM is inserted and the Actual Equipment Type column lists the name of the PPM. Step 8 In the Pluggable Ports area, click Create. The Create Port dialog box appears. Step 9 In the Create Port dialog box, complete the following:
- Port—Choose the port you want to configure from the Port drop-down list.
- Port Type—(for fabric and line cards) Choose the port type, such as TEN-GE from the Port Type drop-down list.
- Port Type—(for CPT 50 panel) Choose the port type, such as ONE-GE, FE, or TEN-GE from the Port Type drop-down list.
Note CPT 50 panel supports ONE-GE and FE for ports 1 to 44. CPT 50 panel supports TEN-GE for ports 45 to 48. Step 10 Click OK. The newly created port appears in the Pluggable Ports area. The port type you provisioned is listed in the Rate column. Step 11 Repeat Steps DLP-J69 Provision PPM and Port Using CTC through DLP-J69 Provision PPM and Port Using CTC to provision another PPM and port. Step 12 Return to your originating procedure (NTP).
DLP-J70 View Optics PM Parameters Using CTC
Procedure
Step 1 Complete the NTP-J22 Log into CTC procedure at a node where you want to view the optics PM parameters. Step 2 In node view, right-click the fabric or line card and choose Open Packet Transport System View. The Packet Transport System View dialog box appears. Step 3 Double-click a fabric card, line card, or CPT50 panel. Step 4 Click the Performance > Optics PM > Current Values tabs. Step 5 View the current PM parameter names that appear in the Param column. Step 6 Click the Historical PM tab. Step 7 View the PM parameter names that appear in the Param column. The PM parameter values appear in the Curr (current) and Prev-n (previous) columns. Table 1 describes the settings for the optics PM parameters.
Table 1 Optics PM Parameters Optics PM Parameters Definition Laser Bias (Min,%) Minimum laser bias current (Laser Bias Min) is the minimum percentage of laser bias current during the PM time interval.
Laser Bias (Avg,%) Average laser bias current (Laser Bias Avg) is the average percentage of laser bias current during the PM time interval.
Laser Bias (Max,%) Maximum laser bias current (Laser Bias Max) is the maximum percentage of laser bias current during the PM time interval.
Rx Optical Pwr (Min,dBm) Minimum receive optical power (Rx Optical Pwr Min, dBm) is the minimum optical power received during the PM time interval. Rx Optical Pwr (Avg,dBm) Average receive optical power (Rx Optical Pwr Avg, dBm) is the average optical power received during the PM time interval. Rx Optical Pwr (Max,dBm) Maximum receive optical power (Rx Optical Pwr Max, dBm) is the maximum optical power received during the PM time interval. Tx Optical Pwr (Min,dBm) Minimum transmit optical power (Tx Optical Pwr Min, dBm) is the minimum optical power transmitted during the PM time interval. Tx Optical Pwr (Avg,dBm) Average transmit optical power (Tx Optical Pwr Avg, dBm) is the average optical power transmitted during the PM time interval. Tx Optical Pwr (Max,dBm) Maximum transmit optical power (Tx Optical Pwr Max, dBm) is the maximum optical power transmitted during the PM time interval. Step 8 Return to your originating procedure (NTP).
DLP-J71 View Payload PM Parameters Using CTC
Procedure
Purpose This procedure displays the payload PM parameters using CTC.
Tools/Equipment None Prerequisite Procedures DLP-J69 Provision PPM and Port Using CTC Required/As Needed As needed Onsite/Remote Onsite or remote Security Level Provisioning or higher
Step 1 Complete the NTP-J22 Log into CTC procedure at a node where you want to view the payload PM parameters. Step 2 In node view, right-click the fabric or line card and choose Open Packet Transport System View. The Packet Transport System View dialog box appears. Step 3 Double-click a fabric card, line card, or CPT50 panel. Step 4 Click the Performance > Payload PM > Statistics tabs. Step 5 Click Refresh. PM statistics appear for each port on the card. Step 6 View the PM parameter names that appear in the Param column. The current PM parameter values appear in the Port # columns. Payload PM parameters are as follows:
Step 7 Click the Performance > Payload PM > Utilization tabs. Step 8 Click Refresh. PM utilization values appear for each port on the card. Step 9 View the appropriate row for the port you want to monitor. The transmit (Tx) and receive (Rx) bandwidth utilization values for the previous time intervals appear in the Prev-n columns. Step 10 Click the Performance > Payload PM > History tabs. Step 11 From the Port drop-down list, choose the desired port. Step 12 Click Refresh. PM statistics appear for the selected port. Step 13 View the PM parameter names that appear in the Param column. The PM parameter values appear in the Prev-n columns. Step 14 Return to your originating procedure (NTP).
Understanding RMON
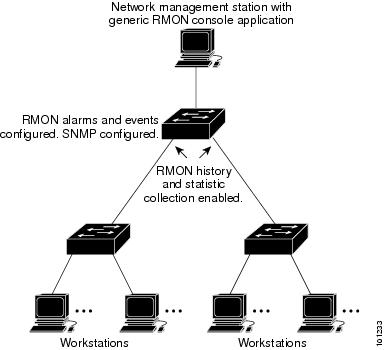
Remote Network Monitoring (RMON) is a standard monitoring feature that allows various network agents and console systems to exchange network monitoring data. RMON provides you with comprehensive network-fault diagnosis, planning, and performance-tuning information. You can use the RMON feature with the Simple Network Management Protocol (SNMP) agent in the switch to monitor all the traffic flowing among switches on all connected LAN segments as shown in Figure 1.
- NTP-J25 Configure RMON Settings
- DLP-J74 Configure RMON Settings Using Cisco IOS Commands
- Display RMON Status Using Cisco IOS Commands
- DLP-J73 Change the RMON Thresholds Using CTC
NTP-J25 Configure RMON Settings
Procedure
- DLP-J74 Configure RMON Settings Using Cisco IOS Commands
- DLP-J73 Change the RMON Thresholds Using CTC
Stop. You have completed this procedure.
DLP-J74 Configure RMON Settings Using Cisco IOS Commands
ProcedureDisplay RMON Status Using Cisco IOS Commands
To display the current RMON agent status on the router, use one or more of the privileged EXEC commands described in Table 1.
Table 2 Commands for Displaying RMON Status Command Purpose show rmon
or
show rmon task
Displays general RMON statistics. show rmon alarms Displays the RMON alarm table. show rmon capture Displays the RMON buffer capture table and current configuration. show rmon events Displays the RMON event table. show rmon filter Displays the RMON filter table. show rmon history Displays the RMON history table. show rmon hosts Displays the RMON hosts table. show rmon matrix Displays the RMON matrix table and values associated with RMON variables. show rmon statistics Displays the RMON statistics table. show rmon topn Displays the RMON top-n hosts table. For examples on show rmon command, see the Cisco CPT Command Reference Guide.
DLP-J73 Change the RMON Thresholds Using CTC
Procedure
Purpose This procedure changes the RMON threshold settings using CTC.
Tools/Equipment None Prerequisite Procedures DLP-J69 Provision PPM and Port Using CTC Required/As Needed As needed Onsite/Remote Onsite or remote Security Level Provisioning or higher
Step 1 Complete the NTP-J22 Log into CTC procedure at a node where you want to change the RMON thresholds. Step 2 In node view, right-click the fabric or line card and choose Open Packet Transport System View. The Packet Transport System View dialog box appears. Step 3 Double-click a fabric card, line card, or CPT50 panel. Step 4 Click the Provisioning > RMON Thresholds tabs. Step 5 Click Create. The Create Threshold dialog box appears. Step 6 From the Port drop-down list, choose an individual port, or choose All to provision RMON thresholds for all the ports. Step 7 From the Variable drop-down list, choose an appropriate Ethernet variable. Table 1 lists the available Ethernet RMON variables.
Table 3 RMON Variables Variable Description ifInOctets Total number of octets received on the interface, including framing characters. rxTotalPkts Total number of received packets.
ifInUcastPkts The number of packets, delivered by this sub-layer to a higher sub-layer, which were not addressed to a multicast or broadcast address at this sub-layer. ifInMulticastPkts The number of packets, delivered by this sub-layer to a higher sub-layer, which were addressed to a multicast address at this sub-layer. For a MAC layer protocol, this includes both group and functional addresses.
ifInDiscards The number of inbound packets that were chosen to be discarded even though no errors had been detected to prevent them from being delivered to a higher-layer protocol. One possible reason for discarding such a packet could be to free up buffer space. IfInErrors Number of inbound packets that contained errors preventing them from being delivered to a higher-layer protocol. ifOutOctets Total number of octets transmitted out of the interface, including framing characters. txTotalPkts Total number of transmitted packets. ifOutUcastPkts The number of packets transmitted by a port that are addressed to a unicast address. ifOutMulticastPkts The total number of packets that higher-level protocols requested be transmitted, and which were addressed to a multicast address at this sub-layer, including those that were discarded or not sent. For a MAC layer protocol, this includes both group and functional addresses.
ifOutDiscards The number of outbound packets that were chosen to be discarded even though no errors had been detected to prevent them from being transmitted. One possible reason for discarding such a packet could be to free up buffer space. IfOutErrors Number of outbound packets or transmission units that could not be transmitted because of errors. Step 8 From the Alarm Type drop-down list, indicate whether the event will be triggered by the rising threshold, the falling threshold, or both the rising and falling thresholds. Step 9 From the Sample Type drop-down list, choose either Relative or Absolute. Relative restricts the threshold to use the number of occurrences in the user-set sample period. Absolute sets the threshold to use the total number of occurrences, regardless of time period. Step 10 Enter the appropriate number of seconds for the sample period in the Sample Period field. Step 11 Enter the appropriate number of occurrences for the rising threshold in the Rising Threshold field. For a rising type of alarm, the measured value must move from below the falling threshold to above the rising threshold. For example, if a network is running below a rising threshold of 1000 collisions every 15 seconds and a problem causes 1001 collisions in 15 seconds, the excess occurrences trigger an alarm.
Step 12 Enter the appropriate number of occurrences in the Falling Threshold field. In most cases a falling threshold is set lower than the rising threshold. A falling threshold is the counterpart to a rising threshold. When the number of occurrences is above the rising threshold and then drops below a falling threshold, it resets the rising threshold. For example, when the network problem that caused 1001 collisions in 15 seconds subsides and creates only 799 collisions in 15 seconds, occurrences fall below a falling threshold of 800 collisions. This resets the rising threshold so that if the network collisions again spike over a 1000 per 15-second period, an event triggers when the rising threshold is crossed. An event is triggered only for the first time when a rising threshold is exceeded (otherwise, a single network problem might cause a rising threshold to be exceeded multiple times and cause a flood of events).
Step 13 Click OK. Step 14 To view all the RMON thresholds, click Show All RMON thresholds. Step 15 Return to your originating procedure (NTP).
Understanding OTN
The Optical Transport Network (OTN) protocol is specified in ITU-T G.709. This standard combines the benefits of SONET/SDH technology with the multiwavelength networks of DWDM. It also provides forward error correction (FEC) that reduces network costs by reducing the number of regenerators used.
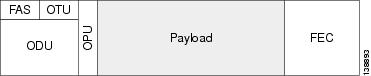
To enable multiservice transport, OTN uses the concept of a wrapped overhead (OH). To illustrate this structure:
- Optical channel payload unit (OPU) OH information is added to the information payload to form the OPU. The OPU OH includes information to support the adaptation of client signals.
- Optical channel data unit (ODU) OH is added to the OPU to create the ODU. The ODU OH includes information for maintenance and operational functions to support optical channels.
- Optical channel transport unit (OTU) OH together with the FEC is added to form the OTU. The OTU OH includes information for operational functions to support the transport by way of one or more optical channel connections.
- Optical channel (OCH) OH is added to form the OCH. The OCH provides the OTN management functionality and contains four subparts: the OPU, ODU, OTU, and frame alignment signal (FAS). See Figure 1.
OTN has the following advantages:
- Stronger forward error correction
- More levels of Tandem Connection Monitoring (TCM)
- Transparent transport of signals
- Switching scalability
NoteThe OTN parameters can be changed only through CTC.
- NTP-J26 Configure OTN Settings
- DLP-J75 Change the Optical Transport Network Settings Using CTC
- DLP-J76 View OTN PM Parameters Using CTC
NTP-J26 Configure OTN Settings
Procedure
- DLP-J75 Change the Optical Transport Network Settings Using CTC
- DLP-J76 View OTN PM Parameters Using CTC
Stop. You have completed this procedure.
DLP-J75 Change the Optical Transport Network Settings Using CTC
Procedure
Purpose This procedure changes the OTN settings for the fabric, line card, or CPT 50 shelf using CTC.
Tools/Equipment None Prerequisite Procedures None Required/As Needed As needed Onsite/Remote Onsite or remote Security Level Provisioning or higher This procedure applies only to the XFP ports of the fabric card (port 3 and port 4).
Step 1 Complete the NTP-J22 Log into CTC procedure at a node where you want to change the OTN settings. Step 2 In node view, right-click the fabric card and choose Open Packet Transport System View. The Packet Transport System View dialog box appears. Step 3 Double-click a fabric card. Step 4 Click the Provisioning > OTN tabs. Step 5 Choose one of the following subtabs— OTN Lines, ITU-T G.709 Thresholds, FEC Thresholds, Trail Trace Identifier. Step 6 Modify any of the settings described in Table 1 to Table 4.
Note You must modify Near End and Far End; 15 Min and 1 Day; and SM and PM independently. To do so, choose the appropriate radio button and click Refresh. Table 1 describes the values on the Provisioning > OTN > OTN Lines tab.
Table 4 OTN Line Settings Parameter Description Options Port (Display only) Displays the port number and description. 3 (Trunk) and 4 (Trunk) ITU-T G.709 OTN Sets the OTN lines according to ITU-T G.709. FEC Sets the OTN lines to FEC. Enhanced FEC mode can be enabled to provide greater range and lower bit error rate.
SF BER (Display only) Displays the signal fail bit error rate. SD BER Sets the signal degrade bit error rate. Table 2 describes the values on the Provisioning > OTN > ITU-T G.709 Thresholds tab.
Table 5 ITU-T G.709 Threshold Settings Parameter Description Options Port (Display only) Displays the port number and optional name. 3 (Trunk) and 4 (Trunk) ES Errored seconds. Numeric. Threshold display options include: Choose an option in each category and click Refresh.
Note SM (OTUk) is the ITU-T G.709 optical channel transport unit order of k overhead frame used for management and performance monitoring. PM (ODUk) is the ITU-T G.709 optical channel data unit order of k overhead frame unit used for path performance monitoring.
SES Severely errored seconds Numeric. Threshold display options include: Choose an option in each category and click Refresh. UAS Unavailable seconds Numeric. Threshold display options include: Choose an option in each category and click Refresh. BBE Background block errors Numeric. Threshold display options include: Choose an option in each category and click Refresh. FC Failure counter Numeric. Threshold display options include: Choose an option in each category and click Refresh. Table 3 describes the values on the Provisioning > OTN > FEC Thresholds tab.
Table 6 FEC Threshold Settings Parameter Description Options Port (Display only) Displays the port number and optional name. 3 (Trunk) and 4 (Trunk) Bit Errors Corrected (Display only) Displays the number of bit errors corrected during the selected time period. Numeric display. Can be set for 15-minute or one-day intervals. Uncorrectable Words (Display only) Displays the number of uncorrectable words in the selected time period. Numeric display. Can be set for 15-minute or one-day intervals. Table 4 describes the values on the Provisioning > OTN > Trail Trace Identifier tab.
Table 7 Trail Trace Identifier Settings Parameter Description Options Port (Display only) Displays the port number.
3 (Trunk) and 4 (Trunk) Level Sets the level of monitoring. Received Trace Mode Sets the trace mode. Transmit Displays and sets a transmit string. You can click the button on the right to change the display. Its title changes, based on the current display mode. Click Hex to change the display to hexadecimal (button changes to ASCII); click ASCII to change the display to ASCII (button changes to Hex). String of trace string size Disable FDI on TTIM If a Trace Identifier Mismatch (TTIM) on Section overhead alarm arises because of a overhead string mismatch, no Forward Defect Indication (FDI) signal is sent to the downstream nodes if this box is checked. Expected Displays and sets a expected string. You can click the button on the right to change the display. Its title changes, based on the current display mode. Click Hex to change the display to hexadecimal (button changes to ASCII); click ASCII to change the display to ASCII (button changes to Hex). String of trace string size Received (Display only) Displays the current received string. You can click Refresh to manually refresh this display, or check the Auto-refresh every 5 sec check box to keep this panel updated. String of trace string size Auto-refresh If checked, automatically refreshes the display every 5 minutes. Step 7 Return to your originating procedure (NTP).
DLP-J76 View OTN PM Parameters Using CTC
Procedure
Step 1 Complete the NTP-J22 Log into CTC procedure at a node where you want to view the near-end or far-end OTN PM parameters for the selected time intervals. Step 2 In node view, right-click the fabric or line card and choose Open Packet Transport System View. The Packet Transport System View dialog box appears. Step 3 Double-click a fabric card. Step 4 Click the Performance > OTN PM > ITU-T G.709 PM tabs. Step 5 View the PM parameter names that appear in the Param column. The PM parameter values appear in the Curr (current) and Prev-n (previous) columns. Table 1 describes the settings for ITU G.709 PM definitions.
Table 8 ITU G.709 Section Monitoring and Path Monitoring PM Definitions Parameter Definition BBE-SM Background Block Errors Section Monitoring (BBE-SM) shows the number of background block errors recorded in the OTN section during the PM time interval. ES-SM Errored Seconds Section Monitoring (ES-SM) shows the errored seconds recorded in the OTN section during the PM time interval. SES-SM Severely Errored Seconds Section Monitoring (SES-SM) shows the severely errored seconds recorded in the OTN section during the PM time interval. UAS-SM Unavailable Seconds Section Monitoring (UAS-SM) shows the unavailable seconds recorded in the OTN section during the PM time interval.
FC-SM Failure Counts Section Monitoring (FC-SM) shows the failure counts recorded in the OTN section during the PM time interval. ESR-SM Errored Seconds Ratio Section Monitoring (ESR-SM) shows the severely errored seconds ratio recorded in the OTN section during the PM time interval. SESR-SM Severely Errored Seconds Ratio Section Monitoring (SESR-SM) shows the severely errored seconds ratio recorded in the OTN section during the PM time interval. BBER-PM Background Block Errors Ratio Path Monitoring (BBER-PM) shows the background block errors ratio recorded in the OTN path during the PM time interval.
BBE-PM Background Block Errors Path Monitoring (BBE-PM) shows the number of background block errors recorded in the OTN path during the PM time interval.
ES-PM Errored Seconds Path Monitoring (ES-PM) shows the errored seconds recorded in the OTN path during the PM time interval.
SES-PM Severely Errored Seconds Path Monitoring (SES-PM) shows the severely errored seconds recorded in the OTN path during the PM time interval. UAS-PM Unavailable Seconds Path Monitoring (UAS-PM) shows the unavailable seconds recorded in the OTN path during the PM time interval. FC-PM Failure Counts Path Monitoring (FC-PM) shows the failure counts recorded in the OTN path during the PM time interval. ESR-PM Errored Seconds Ratio Path Monitoring (ESR-PM) shows the severely errored seconds ratio recorded in the OTN path during the PM time interval. Step 6 Click the FEC PM tab. Step 7 View the PM parameter names that appear in the Param column. The PM parameter values appear in the Curr (current) and Prev-n (previous) columns. Table 2 describes the settings for FEC PM definitions.
Table 9 FEC PM Definitions Parameter Definition Bit Errors Bit errors are the number of bit errors corrected. Uncorrectable words Uncorrectable words occur when FEC detects and corrects errors to deliver a 7 to 8 dB improvement in the signal-to-noise ratio (also called margin). For ITU G.709, the FEC code used is Reed-Solomon RS (255, 239). Step 8 Return to your originating procedure (NTP).
NTP-J27 Modify the Ethernet Settings and Alarm Thresholds
Procedure
- DLP-J77 Provision Alarm and TCA Thresholds Using CTC
- DLP-J78 Change the Port and Ethernet Settings Using CTC
Stop. You have completed this procedure.
DLP-J77 Provision Alarm and TCA Thresholds Using CTC
Procedure
Step 1 Complete the NTP-J22 Log into CTC procedure at a node where you want to provision alarm and TCA thresholds. Step 2 In node view, right-click the fabric or line card and choose Open Packet Transport System View. The Packet Transport System View dialog box appears. Step 3 Double-click a fabric card, line card, or CPT50 panel. Step 4 Click the Provisioning > Optics Thresholds tabs.
Note You must modify 15 Min and 1 Day independently. To do so, choose the appropriate radio button and click Refresh. Step 5 If TCA is not selected, click TCA and then click Refresh.
Note Do not modify the Laser Bias parameters. Step 6 Verify the provisioned TCA threshold values in the Warning Thresholds table. To provision new thresholds as needed, click the threshold value you want to change, delete it, enter a new value, and press Enter. Step 7 Under Types, click the Alarm radio button and click Refresh.
Note Do not modify the Laser Bias parameters. Step 8 Verify the provisioned alarm threshold values in the Alarm Thresholds table. To provision new thresholds as needed, click the threshold value you want to change, delete it, enter a new value, and press Enter. Step 9 Click Apply. Step 10 Return to your originating procedure (NTP).
Carrier Delay
Carrier delay is the soak period before link failure is communicated to higher protocols.
Default Carrier Delay Duration
This table lists the default duration for carrier delay.
Table 10 Default Carrier Delay Duration Card/Port Default Time Ports on the fabric card 2 seconds Ports on the line card 200 milliseconds Ports on the CPT 50 panel 200 milliseconds The range of carrier delay is from 0 to 60. The higher carrier delay affects the switch times for protocols such as LAG and REP. See DLP-J78 Change the Port and Ethernet Settings Using CTC to change the carrier delay time.
Carrier Delay Limitations
When Ethernet services are configured, set the carrier delay time to greater than or equal to 2 seconds for fabric cards and CPT 50 panels attached to fabric cards. When MPLS services are configured, set the carrier delay time to less than 2 seconds, for fabric cards and CPT 50 panels attached to fabric cards. However, this time limit does not apply to line cards and CPT 50 panels attached to line cards. The carrier delay time of 2 seconds in fabric cards can cause traffic drops on SSO.
DLP-J78 Change the Port and Ethernet Settings Using CTC
Procedure
Step 1 Complete the NTP-J22 Log into CTC procedure at a node where you want to change the port and Ethernet settings. Step 2 In node view, right-click the fabric or line card and choose Open Packet Transport System View. The Packet Transport System View dialog box appears. Step 3 Double-click a fabric card, line card, or CPT50 panel. Step 4 Click the Provisioning > Ether Ports > Ethernet tabs. Step 5 Modify any of the settings for the Ethernet tab as described in Table 1. Step 6 Click the Provisioning > Ether Ports > Port tabs. Step 7 Modify any of the settings for the Port tab as described in Table 2.
Table 12 Port Settings Parameter Description Options Port (Display only) Displays the port number. — Port Name Sets the port name for a port. User-defined. Name can be up to 32 alphanumeric or special characters or both. Blank by default. Admin State Sets the port service state. Service State (Display only) Displays the autonomously generated state that gives the overall condition of the port. Service states appear in the format—Primary State-Primary State Qualifier, Secondary State. AINS Soak Sets the automatic in-service soak period. Double-click the time and use the up and down arrows to change settings. Reach Sets the optical reach distance of the ports The Reach options depend on the traffic type that has been selected. Wavelength Sets the wavelength of the ports. Step 8 Click Apply. Step 9 Return to your originating procedure (NTP).