Table Of Contents
Configuring MPLS-TP Using the CPT System
13.1 Understanding Common Terms
13.1.1 What Is MPLS?
13.1.2 What Is MPLS-TP?
13.1.3 What Is the CPT System?
13.1.4 What Is Pseudowire?
13.1.5 What Is an EVC?
13.1.6 What Is CPT System QoS?
13.1.7 What Is an LSP?
13.1.8 What Is BFD?
13.1.9 What Is an EFP?
13.1.10 What Is a Bridge Domain?
13.1.11 What Is IGMP Snooping?
13.1.12 What Is MVR?
13.1.13 What Is LACP?
13.2 Understanding User Privileges and Tasks
13.3 Unsupported Features
13.4 MPLS-TP Tunnels
13.4.1 How Do I Create an MPLS-TP Tunnel?
13.4.2 Understanding the TP Tunnel Service Table
13.4.3 How Do I View or Modify an MPLS-TP Tunnel?
13.4.4 How Do I Delete an MPLS-TP Tunnel?
13.4.5 How Do I Trace an MPLS-TP Tunnel?
13.4.6 How Do I Launch the Pseudowire Service Table from the TP Tunnel Service Table?
13.5 Pseudowires
13.5.1 How Do I Create a Pseudowire?
13.5.2 Understanding the PW Service Table
13.5.3 How Do I View or Modify a Pseudowire?
13.5.4 How Do I Delete a Pseudowire?
13.5.5 How Do I Trace a Pseudowire?
13.6 EVCs
13.6.1 How Do I Create an EVC?
13.6.2 Understanding the EVC Service Table
13.6.3 How Do I View or Modify an EVC?
13.6.4 How Do I Delete an EVC?
13.6.5 How Do I Trace an EVC?
13.7 Understanding Advanced Troubleshooting Options
13.7.1 Understanding the MPLS-TP Tunnel Cross-Connections Table
13.7.2 Understanding the Pseudowire Cross-Connections Table
13.7.3 Understanding the EVC Cross-Connections Table
13.7.4 Understanding the Refresh L2 Service Data Discovery Option
13.8 CPT System QoS
13.8.1 How Do I Create and Manage QoS Objects?
13.8.2 How Do I Provision QoS Objects in the CPT System?
13.9 CPT System
13.9.1 Understanding CPT Cards
13.9.2 Overview of the CPT System Property Sheet
13.9.3 Understanding the CPT System Alarms
Configuring MPLS-TP Using the CPT System
This chapter describes how to configure Multiprotocol Label Switching Transport Profile (MPLS-TP) services using the Carrier Packet Transport (CPT) System. It contains the following sections:
•
Understanding Common Terms
•
Understanding User Privileges and Tasks
•
Unsupported Features
•
MPLS-TP Tunnels
–
How Do I Create an MPLS-TP Tunnel?
–
Understanding the TP Tunnel Service Table
–
How Do I View or Modify an MPLS-TP Tunnel?
–
How Do I Delete an MPLS-TP Tunnel?
–
How Do I Trace an MPLS-TP Tunnel?
•
Pseudowires
–
How Do I Create a Pseudowire?
–
Understanding the PW Service Table
–
How Do I View or Modify a Pseudowire?
–
How Do I Delete a Pseudowire?
–
How Do I Trace a Pseudowire?
•
EVCs
–
How Do I Create an EVC?
–
Understanding the EVC Service Table
–
How Do I View or Modify an EVC?
–
How Do I Delete an EVC?
–
How Do I Trace an EVC?
•
Understanding Advanced Troubleshooting Options
–
Understanding the MPLS-TP Tunnel Cross-Connections Table
–
Understanding the Pseudowire Cross-Connections Table
–
Understanding the EVC Cross-Connections Table
–
Understanding the Refresh L2 Service Data Discovery Option
•
CPT System QoS
–
How Do I Create and Manage QoS Objects?
–
How Do I Provision QoS Objects in the CPT System?
•
CPT System
–
Understanding CPT Cards
–
Overview of the CPT System Property Sheet
–
Understanding the CPT System Alarms
13.1 Understanding Common Terms
This section describes the common terms used in MPLS-TP and the CPT System. It includes:
•
What Is MPLS?
•
What Is MPLS-TP?
•
What Is the CPT System?
•
What Is Pseudowire?
•
What Is an EVC?
•
What Is CPT System QoS?
•
What Is an LSP?
•
What Is BFD?
•
What Is an EFP?
•
What Is a Bridge Domain?
•
What Is IGMP Snooping?
•
What Is MVR?
•
What Is LACP?
13.1.1 What Is MPLS?
Multiprotocol Label Switching (MPLS) is the technology that scales IP networks for service providers. MPLS is a technique that allows the forwarding of packets based on labels. In a normal IP network, the packets are switched based on the destination IP address. In an MPLS network, the packets are switched based on labels.
MPLS provides mechanisms for IP Quality of Service (QoS) and IP traffic engineering (TE). MPLS is the industry standard on which label switching is based. The label identifies where to forward the packets and instructs the routers and switches in the network. Forwarding of MPLS packets is based on pre-established IP routing information.
MPLS enables service providers to offer additional services, including VPNs, improved TE, QoS, Layer 2 tunneling, and multiprotocol support, to their enterprise customers. There are two ways to set up an MPLS infrastructure:
•
LDP
•
MPLS-TE
LDP differs from MPLS-TE in terms of the protocol used to distribute the labels along the path. LDP uses Label Distribution Protocol (LDP) whereas MPLS-TE uses Resource Reservation Protocol-Traffic Engineering (RSVP-TE) to distribute the labels. LDP and RSVP-TE uses Open Shortest Path First (OSPF) as the routing protocol.
13.1.2 What Is MPLS-TP?
MPLS-TP is a carrier-grade packet transport technology that enables the move from SONET and SDH time-division multiplexing (TDM) to packet switching. MPLS-TP enables MPLS to be deployed in a transport network and to operate similarly to existing transport technologies. MPLS-TP enables MPLS to support packet transport services with a degree of predictability that is similar to the existing transport networks.
The goal of MPLS-TP is to provide connection-oriented transport for packet and TDM services over optical networks leveraging the widely deployed MPLS technology. Operations, administration, and maintenance (OAM) and resiliency features are defined and implemented in MPLS-TP to ensure:
•
Scalable operations
•
High availability
•
Performance monitoring
•
Multidomain support
•
Carrier-grade packet transport networks
MPLS-TP can be carried over the existing transport network infrastructure. MPLS-TP defines a profile of MPLS targeted at transport applications and networks. This profile specifies the MPLS characteristics and extensions required to meet the transport requirements.
The following topics describe related Prime Optical features and options:
•
How Do I Create an MPLS-TP Tunnel?
•
Understanding the TP Tunnel Service Table
•
How Do I View or Modify an MPLS-TP Tunnel?
•
How Do I Delete an MPLS-TP Tunnel?
•
How Do I Trace an MPLS-TP Tunnel?
•
How Do I Launch the Pseudowire Service Table from the TP Tunnel Service Table?
•
Understanding the MPLS-TP Tunnel Cross-Connections Table
13.1.3 What Is the CPT System?
The CPT System is the first Packet-Optical Transport System (P-OTS) built on standards-based MPLS-TP technology. The CPT System unifies both packet and transport technologies, giving a strong foundation for next-generation transport. The CPT System is designed to support transport applications so that service providers can continue to offer existing transport services while enabling new packet services.
The existing transport networks must be migrated from TDM networks to packet transport networks because the packet-based services dominate the overall network traffic. Next-generation transport networks enable and support new mesh, multipoint, and multidirectional services. By deploying packet transport networks, you can benefit from:
•
Statistical multiplexing
•
Dynamic bandwidth allocation
•
QoS
Note
CPT System is displayed as "PT System" in the Prime Optical user interface.
The CPT System provides the following benefits:
•
Ensures a smooth and efficient transition from TDM networks to packet transport networks
•
Enables you to deploy new packet transport networks
•
Provides architectural flexibility with support for:
–
MPLS-TP
–
IP/MPLS
–
Carrier Ethernet transport
•
Provides data plane and control plane flexibility in network deployments
•
Enables service providers to provide the following for residential and business customers:
–
Mobile back-haul
–
Ethernet services
–
TDM services
The following topics describe related Prime Optical features and options:
•
Understanding CPT Cards
•
Overview of the CPT System Property Sheet
•
Understanding the CPT System Alarms
13.1.4 What Is Pseudowire?
A pseudowire (PW) is an emulation of a Layer 2 point-to-point, connection-oriented service over a packet-switching network (PSN).
Cisco Prime Optical 9.3.1 supports only the forwarding of the Ethernet frames from customer networks under Any Transport over MPLS (AToM).
Pseudowire is the technique used to transport these types of frames. It is the emulation of a native service over the MPLS network.
The following topics describe related Prime Optical features and options:
•
How Do I Create a Pseudowire?
•
Understanding the PW Service Table
•
How Do I View or Modify a Pseudowire?
•
How Do I Delete a Pseudowire?
•
How Do I Trace a Pseudowire?
•
Understanding the Pseudowire Cross-Connections Table
13.1.4.1 What Is an L2VPN Pseudowire?
A Layer 2 VPN (L2VPN) pseudowire is a tunnel established between two provider edge (PE) routers across the core carrying the Layer 2 payload encapsulated as MPLS data, as shown in Figure 13-1. This architecture helps the carriers migrate from Layer 2 networks such as Ethernet over MPLS (EoMPLS) to an MPLS core.
Dual-homed pseudowire is a pseudowire-protected circuit on which the destination point is split into two different nodes.
Figure 13-1 L2VPN Pseudowire
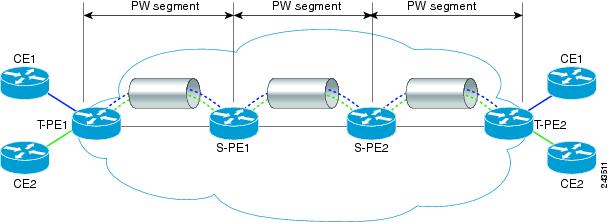
13.1.4.2 What Is L2VPN Multisegment Pseudowire?
An L2VPN multisegment pseudowire (MS-PW) is a collection of two or more PW segments that function as a single PW. It is also known as switched pseudowire. MS-PWs span multiple cores or autonomous systems of the same or different carrier networks. An L2VPN MS-PW can include up to 254 PW segments.
The L2VPN MS-PWs feature enables you to configure two or more Layer 2 pseudowire segments that function as a single pseudowire. The end routers are called terminating provider edge routers (T-PEs) and the switching routers are called switching provider edge routers (S-PEs). The S-PE router terminates the tunnels of the preceding and succeeding PW segments in an MS-PW. The S-PE router can switch the control and data planes of the preceding and succeeding PW segments of the MS-PW. An MS-PW is declared to be up when all single-segment PWs are up.
Figure 13-2 Multisegment Pseudowire
13.1.5 What Is an EVC?
An Ethernet Virtual Circuit (EVC) is a logical relationship between Ethernet User-Network Interfaces (UNIs) in a provider-based Ethernet service. An EVC is the service offered and is carried through the service provider network. Each EVC is configured by its unique name across the service provider network.
An EVC is an end-to-end representation of a single instance of a Layer 2 service that a service provider offers and represents the different parameters based on which the service is offered. An EVC prevents data transfer between sites that are not part of the same EVC. The instance of a specific EVC service on the physical interface of each network device through which the EVC passes is called an Ethernet Flow Point (EFP).
An EVC is the A-Z circuit that enables you to pass customer VLANs from one port on a node to another port on another node in the network. In the CPT System, an EVC represents a Carrier Ethernet service and is an entity that provides an end-to-end connection between two or more customer endpoints.
The global EVC attributes are:
•
EVC ID—EVC ID is the associated EVC which the EFP is part of.
•
EVC Type—E-Line, E-LAN, or E-Tree.
•
List of associated EFPs that belong to an EVC.
The following topics describe related Prime Optical features and options:
•
How Do I Create an EVC?
•
Understanding the EVC Service Table
•
How Do I View or Modify an EVC?
•
How Do I Delete an EVC?
•
How Do I Trace an EVC?
•
Understanding the EVC Cross-Connections Table
13.1.6 What Is CPT System QoS?
CPT System QoS classifies each packet in the network based on one of the following:
•
Ethernet Class of Service (CoS)
•
IP precedence
•
IP Differentiated Services Code Point (DSCP)
•
MPLS experiment (MPLS EXP) bits.
After the packets are classified into class flows, additional QoS functions can be applied to each packet as it traverses the CPT System.
Policing provided by the CPT System ensures that the attached equipment does not submit more than a predefined amount of bandwidth into the network. The policing feature can be used to enforce the committed information rate (CIR) and the peak information rate (PIR) available to a customer at an interface. The policing action is applied per classification.
Marking can set the Ethernet CoS, IP precedence, or IP DSCP bits when packets enter the CPT System. For MPLS traffic, marking sets MPLS EXP bits when the packets leave the system. The marking feature operates on the outer IEEE 802.1p tag, IP precedence, or IP DSCP bits and provides a mechanism for tagging packets at the ingress. The subsequent NEs can provide QoS based only on this QoS indicator.
Per-class queuing allows various queuing applications to support service-level agreements. The CPT System uses a combination of Strict Priority Queuing (SPQ) and Weighted Round Robin (WRR) scheduling to guarantee throughput and latency requirements and to provide fair access to excess network bandwidth.
The following topics describe related Prime Optical features and options:
•
How Do I Create and Manage QoS Objects?
•
How Do I Provision QoS Objects in the CPT System?
13.1.7 What Is an LSP?
A Label Switched Path (LSP) is the path that a label takes to pass through a network. An LSP consists of a unidirectional sequence of hops in which a packet travels from one network device to another by means of label switching mechanisms. LSPs can be established statically and dynamically.
In Prime Optical 9.6.3, only static LSP can be established.
The following topics describe related Prime Optical features and options:
•
How Do I Create an MPLS-TP Tunnel?
•
Understanding the TP Tunnel Service Table
•
How Do I Add an LSP?
•
How Do I Modify an LSP?
•
How Do I Trace an LSP?
13.1.8 What Is BFD?
Bidirectional Forwarding Detection (BFD) is a path-failure detection protocol that provides a low-overhead, short-duration method of detecting failures in the forwarding path between two adjacent routers. BFD is enabled at the interface level; it detects failures on interfaces, data links, and forwarding planes and notifies the MPLS-TP server. Prime Optical supports BFD asynchronous mode, which depends on sending BFD control packets between two systems to activate and maintain BFD neighbor sessions between routers.
To create a BFD session, you must configure BFD on both systems (or BFD peers). After you enable BFD on the interfaces:
•
A BFD session is created.
•
BFD timers are negotiated.
•
BFD peers begin sending BFD control packets to each other at the negotiated interval.
BFD provides continuity checks to enable MPLS-TP LSPs to detect forwarding failures between two adjacent routers. When BFD is enabled on the MPLS-TP tunnel interface, the MPLS-TP client creates separate BFD sessions for working and protect LSPs. A single set of BFD timers is configured on the tunnel that applies to both the working and protect LSPs.
The following topics describe related Prime Optical features and options:
•
How Do I Create an MPLS-TP Tunnel?
•
Pseudowire Class
13.1.9 What Is an EFP?
Traffic for a service must pass through several switches in the service provider network to connect customer sites across that network. An instance of a specific EVC service on the physical interface of each network device through which the EVC passes is called an Ethernet Flow Point (EFP). An EFP is a logical demarcation point of an EVC within a node on an interface, and it can be associated with a bridge domain.
The main purpose of configuring an EFP is to recognize the traffic belonging to a specific EVC on an interface. Configuring the EFP also applies forwarding behavior and features specific to that EVC, because multiple EVCs can pass through one physical interface.
The CPT System can have EFPs on all ports of the PTF_10GE_4 card, PT_10GE_4 card, or PTSA_GE panel. The EFP administrative state (Up or Down) maps to the EFP administrative state in the Cisco IOS Software.
The key attributes of an EFP are:
•
Encapsulation string—Defines the classification criteria for an incoming packet.
•
Forwarding operation—Defines the forwarding operation to be applied on frames that belong to the EFP.
•
Ingress rewrite operation—Defines the rewrites to be performed on the frames that belong to the EFP before proceeding with the forwarding operation.
•
Egress rewrite operation (outgoing encapsulation)—Defines the rewrites to be performed on the frames being transmitted out of the EFP.
The following topics describe related Prime Optical features and options:
•
How Do I Create a Pseudowire?
•
How Do I Configure an EFP?
•
How Do I Create an EVC?
•
How Do I View or Modify an EVC?
•
How Do I Add a Drop?
13.1.10 What Is a Bridge Domain?
A bridge domain is an Ethernet broadcast domain internal to a device. The bridge domain enables you to decouple a VLAN from a broadcast domain. The bridge domain has one-to-many mapping with EFPs. All EFPs in a node for a specific EVC are grouped using the bridge domain. If EFPs belong to the same bridge domain and have the same bridge domain number, the EFPs receive traffic even if they have different VLAN numbers.
The bridge domain number is local to the node. Different nodes of an EVC can have the same or a different bridge domain number. However, the bridge domain number is unique for an EVC within a node. For an EVC, the bridge domain number range is from 1 to 16384.
The following topic describes related Prime Optical features and options:
•
How Do I View or Modify an EVC?
13.1.11 What Is IGMP Snooping?
As networks increase in size, multicast routing becomes critically important as a means to determine which segments require multicast traffic and which do not. IP multicasting enables IP traffic to be propagated from one source to a number of destinations or from many sources to many destinations. Rather than one packet being sent to each destination, one packet is sent to the multicast group identified by a single IP destination group address.
Internet Group Management Protocol (IGMP) snooping restricts flooding of multicast traffic by sending multicast traffic only to the interfaces that are subscribed to a particular multicast group. The CPT System can use IGMP snooping to constrain the flooding of multicast traffic by dynamically configuring Layer 2 interfaces, so that multicast traffic is forwarded to only those interfaces associated with the IP multicast devices. IGMP snooping requires the CPT System to snoop on the IGMP transmissions between the host and the router and to keep track of multicast groups and member ports.
When the CPT System receives an IGMP report from a host for a particular multicast group, the CPT System adds the host port number to the forwarding table entry. When it receives an IGMP leave group message from a host, it removes the host port from the table entry. It also periodically deletes entries if it does not receive IGMP membership reports from the multicast clients.
The CPT System forwards periodic general queries received from the multicast router in the bridge domain where IGMP snooping is enabled. All hosts interested in this multicast group send join requests and are added to the forwarding table entry. The CPT System creates one entry per bridge domain in the IGMP snooping IP multicast forwarding table for each group from which it receives an IGMP join request.
The IP multicast groups learned through IGMP snooping are dynamic. If a port interface, EFP, or bridge domain state changes, the IGMP snooping-learned multicast groups from this port, EFP, or bridge domain are deleted.
The following topic describes related Prime Optical features and options:
•
How Do I View or Modify an EVC?
13.1.12 What Is MVR?
Multicast VLAN Registration (MVR) is a Layer 2 IP network protocol that enables multicast traffic from a source VLAN to be shared with subscriber VLANs. MVR is designed for applications using wide-scale deployment of multicast traffic across an Ethernet ring-based service provider network; for example, the broadcast of multiple television channels over a service provider network. MVR allows a subscriber on a port to subscribe to (and unsubscribe from) a multicast stream on a network-wide multicast bridge domain. It allows the single multicast bridge domain to be shared over the network while subscribers remain in separate bridge domains.
MVR provides the ability to continuously send multicast streams to subscribers on the multicast bridge domain. It also isolates the streams from the subscriber bridge domains for bandwidth and security reasons. MVR assumes that the subscriber ports subscribe (join) and unsubscribe (leave) these multicast streams by sending out IGMP join and leave messages. These messages can originate from an IGMP version 1-, version 2-, or version 3-compatible host with an Ethernet connection. Although MVR operates on the underlying mechanism of IGMP snooping, the two features operate independently of each other. One feature can be enabled or disabled without affecting the behavior of the other feature. However, if IGMP snooping and MVR are both enabled, MVR reacts only to join and leave messages from multicast groups configured under MVR. IGMP snooping manages join and leave messages from all other multicast groups.
The CPT System identifies the MVR IP multicast streams and their associated IP multicast group in the forwarding table. It intercepts the IGMP messages and modifies the forwarding table to include or exclude the subscriber as a receiver of the multicast stream, even though the receivers might be in a different bridge domain from the source. This forwarding behavior selectively allows traffic to cross between different bridge domains.
The CPT System supports the dynamic mode of MVR operation. In the dynamic mode, multicast data received by MVR source EFPs on the CPT System is forwarded only to those MVR receiver EFPs that have joined through IGMP reports. You must configure EFPs as MVR receiver and source EFPs. Receiver EFPs and source EFPs can be on different CPT cards. Multicast data sent on the multicast bridge domain is forwarded to all MVR receiver EFPs across the CPT System. By default, a CPT System has no source or receiver EFP. If a CPT card fails or is removed, only those receiver EFPs belonging to that CPT card will not receive the multicast data. All other receiver EFPs on other CPT cards continue to receive the multicast data.
The following topic describes related Prime Optical features and options:
•
How Do I View or Modify an EVC?
13.1.13 What Is LACP?
Link Aggregation Control Protocol (LACP) is a control protocol over link aggregation (LAG) that enables checking for LAG misconfigurations. LACP is part of the IEEE 802.3ad standard that enables you to bundle several physical ports together to form a single logical channel. LACP enables a network device, such as a switch, to negotiate an automatic bundling of links by sending LACP packets to the peer device.
LACP enables you to form a single Layer 2 link automatically from two or more Ethernet links. This protocol ensures that both ends of the Ethernet link are functional and agree to be members of the aggregation group. To be operational, LACP must be enabled at both ends of the link.
The following topics describe related Prime Optical features and options:
•
Channel Groups
•
How Do I Configure Channel Group Using LACP?
13.2 Understanding User Privileges and Tasks
This section describes the user privileges and the MPLS-TP and the CPT System tasks and new UI options.
The following table describes the Prime Optical default user profiles and the privileges associated with each profile.
Table 13-1 User Privileges
Role
|
Privileges
|
SuperUser
|
• Tasks—Allowed to perform all the tasks listed in Table 13-2.
• UI Options—All the UI options are visible.
|
NetworkAdmin
|
• Tasks—Allowed to perform all the tasks listed in Table 13-2.
• UI Options—All the UI options are visible.
|
SysAdmin
|
• Tasks—Cannot perform any of the tasks listed in Table 13-2.
• UI Options—None of the UI options are visible.
|
Provisioner
|
• Tasks—Cannot perform the advanced troubleshooting tasks, but can perform the other tasks listed in Table 13-2.
• UI Options—The Advanced Troubleshooting options are not visible.
|
Operator
|
• Tasks—Allowed to perform only the following tasks:
– View Layer 2 services from the TP Tunnel Service table, PW Service table, and EVC Service table.
– Trace Layer 2 services from the TP Tunnel Service table, PW Service table, and EVC Service table.
• UI Options—Only the View and Trace options are visible. Other UI options are either disabled or not visible.
|
The following table describes the MPLS-TP and the CPT System tasks and UI options.
Note
CPT System is displayed as "PT System" in the Prime Optical user interface.
13.3 Unsupported Features
The CPT 200 and CPT 600 NEs do not support the following:
•
Creating a server trail
•
Managing VLANs
•
Creating and managing BLSR
•
ML cards
•
Creating and managing SVLANs
•
Viewing the IOS Users table
•
Launching the L2 Topology table from the NE Explorer
13.4 MPLS-TP Tunnels
This section describes the following:
•
How Do I Create an MPLS-TP Tunnel?
•
Understanding the TP Tunnel Service Table
•
How Do I View or Modify an MPLS-TP Tunnel?
•
How Do I Delete an MPLS-TP Tunnel?
•
How Do I Trace an MPLS-TP Tunnel?
13.4.1 How Do I Create an MPLS-TP Tunnel?
For descriptions of MPLS-TP, BFD, and LSP, see the following sections:
•
What Is MPLS-TP?
•
What Is BFD?
•
What Is an LSP?
MPLS-TP tunnels are provisioned manually at their endpoints across the network. An MPLS-TP tunnel consists of a pair of unidirectional tunnels providing a bidirectional LSP. Each unidirectional tunnel can be protected with a protect LSP that activates automatically upon failure.
Create an MPLS-TP tunnel using the Create MPLS-TP Tunnel Circuit wizard. The following table describes the launch points and the expected behavior for the Create MPLS-TP Tunnel Circuit wizard.
Table 13-3 Create MPLS-TP Tunnel Circuit Wizard Launch Points and Expected Behavior
Launch Points
|
Expected Behavior
|
Source NE node in the Domain Explorer or Subnetwork Explorer
|
Select the source ONS 15454 NE in the Domain Explorer or Subnetwork Explorer and choose Configuration > PT System > Provision > Create TP Tunnel. The Create MPLS-TP Tunnel Circuit wizard opens. The source NE is preset to the selected source.
|
Source and destination NE nodes in the Domain Explorer or Subnetwork Explorer
|
Select the source ONS 15454 NE in the Domain Explorer or Subnetwork Explorer, right-click the NE, and choose Create L2 Service > Create TP Tunnel. The pointer changes to a plus (+) symbol; select the destination NE. The destination NE must be in the same network partition as the source. The Create MPLS-TP Tunnel Circuit wizard opens. Source and destination NEs are preset to the selected source and destination.
Note If you press the Esc key while the plus symbol is enabled, the operation is canceled and the plus symbol returns to a pointer.
|
Source and destination NE nodes in the Network Map
|
Select Layer 2 as the layer rate from the drop-down list in the Network Map toolbar. Select the source ONS 15454 NE in the Network Map, right-click the NE, and choose Create L2 Service > Create TP Tunnel. The pointer displays a line extending from the source NE; select the destination NE. The Create MPLS-TP Tunnel Circuit wizard opens. Source and destination NEs are preset to the selected source and destination NE nodes in the Network Map.
|
To create an MPLS-TP tunnel:
Step 1
Select a node for which to create an MPLS-TP tunnel and open the Create MPLS-TP Tunnel Circuit wizard. For an explanation of wizard launch points, see Table 13-3.
Step 2
In the Info View pane:
a.
In the Tunnel Details area, do the following:
•
In the TP Tunnel Name field, enter the TP tunnel name. The TP tunnel name is a free-format string of up to 48 ASCII characters.
•
In the TP Tunnel Description field, enter a TP tunnel description of up to 48 characters.
•
From the State drop-down list, select a state to apply: Up and Down.
•
Check the Protection check box if you want the TP tunnel path to be protected.
b.
In the Bandwidth area, do the following:
•
In the Bandwidth Tx field, enter the bandwidth to be transmitted and click the appropriate radio button.
•
In the Bandwidth Rx field, enter the bandwidth to be received and click the appropriate radio button.
c.
Click Next.
Step 3
In the Source pane:
a.
Node—Displays a list of available NEs. From the drop-down list, select the source NE.
b.
Shelf—Displays the shelf number, which is automatically retrieved from the NE. This field is enabled only if one or more possible options are available.
c.
Slot—Displays the slot number, which is automatically retrieved from the NE. This field is enabled only if one or more possible options are available.
d.
BFD—Displays the BFD template, which is automatically retrieved from the NE. From the drop-down list, select None to provision the TP tunnel without a BFD template.
e.
Node ID—Display only. Displays the node ID.
f.
Tunnel Number—A free number; however, the number you enter must not be used by any other tunnel on the specified node. By default, the first available free number is displayed. Valid values are from 0 to 999.
g.
Working LSP—Displays the working LSP number. The default value is 0. Valid values are 0 or a number from 2 to 65535.
h.
Protected LSP—Enabled only if you checked the Protection check box in the Info View pane. This field displays the protect LSP number. The default value is 1. Valid values are from 1 to 65535.
i.
Click Next.
Step 4
In the Destination pane:
a.
Node—Displays a list of available NEs. From the drop-down list, select the destination NE.
b.
Shelf—Displays the shelf number, which is automatically retrieved from the NE. This field is enabled only if one or more possible options are available.
c.
Slot—Displays the slot number, which is automatically retrieved from the NE. This field is enabled only if one or more possible options are available.
d.
BFD—Displays the BFD template, which is automatically retrieved from the NE. From the drop-down list, select None to provision the TP tunnel without a BFD template.
e.
Node ID—Display only. Displays the node ID.
f.
Tunnel Number—A free number; however the number you enter must not be used by any other tunnel on the specified node. By default, the first available free number is displayed. Valid values are from 0 to 999.
g.
Working LSP—Displays the working LSP number. The default value is 0. Valid values are 0 or a number from 2 to 65535.
h.
Protected LSP—Enabled only if you checked the Protection check box in the Info View pane. This field displays the protect LSP number. The default value is 1. Valid values are from 1 to 65535.
i.
Click Next.
Step 5
In the Routing Preferences pane:
a.
In the Routing Details area, confirm the details and perform actions where allowed:
Note
The Automatic Routing and Use Required Nodes/Spans options are mutually exclusive.
•
Check the Automatic Routing check box if you want the route to be calculated by the system.
•
Check the Use Required Nodes/Spans check box to manually select the route. Include or exclude NEs and links from the path.
•
Display only. By default, the Review Labels check box is checked.
•
Display only. If you checked the Protection check box in the Info View pane, the Protected Path check box is checked. If you unchecked the Protection check box in the Info View pane, the Protected Path check box is unchecked.
b.
Select one of the following radio buttons from the Node and Link Diversity Options area if the path is protected and if you want the working LSPs and protect LSPs to be routed using paths that traverse different NEs:
•
Node Diversity Required—Select if the working LSPs and protect LSPs must be routed on different nodes.
•
Node Diversity Desired—Select if you prefer the working LSPs and protect LSPs to be routed on different nodes.
•
Link Diversity Only—Select if you want the working LSPs and protect LSPs to be routed on different links.
c.
Click Next.
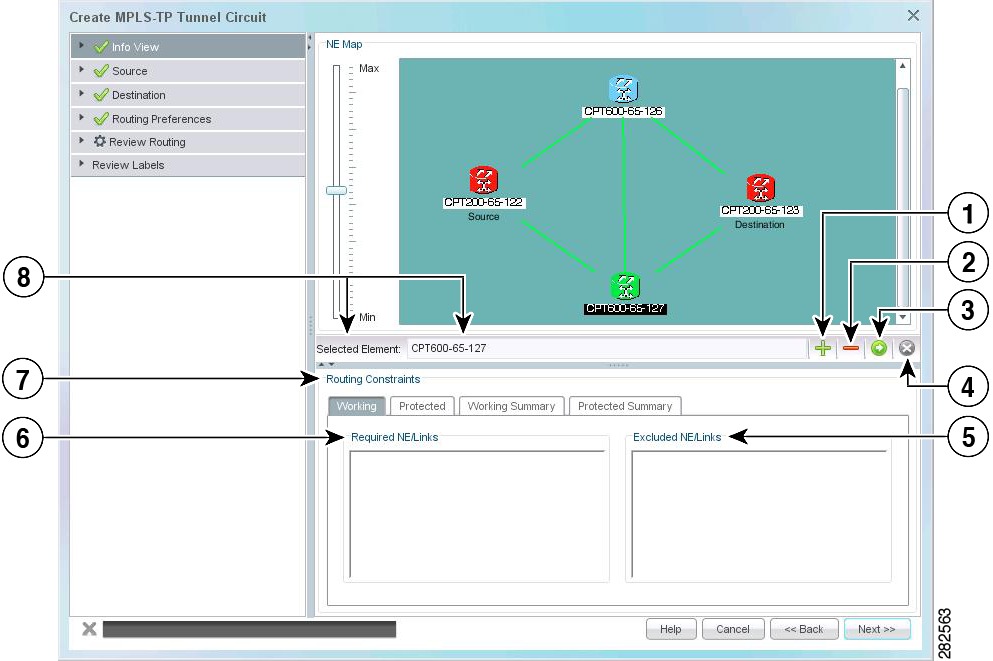
If you checked the Automatic Routing check box in the Routing Preferences pane, go to Step 6. If you checked the Use Required Nodes/Spans check box in the Routing Preferences pane, go to Step 7.
Step 6
In the Review Routing pane, confirm the details and perform actions where allowed:
Figure 13-3 Automatic Routing Review
1
|
Working LSPs
|
2
|
Protect LSPs
|
3
|
Routing Constraints area
|
a.
NE Map—Displays the working LSPs (blue links) and protect LSPs (purple links).
b.
Routing Constraints—The Routing Constraints area has two tabs:
•
Working—Displays the working spans and provides a summary of the links and ports used by the Layer 2 service.
•
Protected—Displays the protected spans and provides a summary of the links and ports used by the Layer 2 service.
c.
Click Next. Go to Step 8.
Step 7
In the Review Routing pane, confirm the details and perform actions where allowed:
Figure 13-4 Manual Routing Review
1
|
Insert Node/Link option
|
2
|
Exclude Node/Link option
|
3
|
Calculate Routing option
|
4
|
Clear Routing Constraints option
|
5
|
Excluded NE/Links area
|
6
|
Required NE/Links area
|
7
|
Routing Constraints area
|
8
|
Selected NE
|
a.
NE Map—Displays the working LSPs and protect LSPs. Add and remove NEs and links using the following options:
•
Insert Node/Link—Select the NE or link from the NE map and click Insert Node/Link. The selected NE or link is added and displayed in the Required NE/Links section.
•
Exclude Node/Link—Select the NE or link from the NE map and click Exclude Node/Link. The selected NE or link is excluded and displayed in the Excluded NE/Links section.
•
Calculate Routing—The working LSPs and protect LSPs have independent routing constraints. Click Calculate Routing to calculate the routing.
•
Clear—Click Clear to clear the routing constraints.
b.
Routing Constraints—The Routing Constraints area has four tabs:
•
Working—Displays the working NEs and links added using the Insert Node/Link option and the working NEs and links excluded using the Exclude Node/Link option. To delete an NE or link, right-click the NE or link and click Delete.
•
Protected—Displays the protected NEs and links added using the Insert Node/Link option and the protected NEs and links excluded using the Exclude Node/Link option. To delete an NE or link, right-click the NE or link and click Delete.
•
Working Summary—Displays the working spans and provides a summary of the links and ports used by the Layer 2 service.
•
Protected Summary—Displays the protected spans and provides a summary of the links and ports used by the Layer 2 service.
c.
Click Next.
Step 8
In the Review Labels pane, review or modify the label settings that are automatically calculated by the system. The following details are displayed in a table:
•
NE—Display only. Displays the NE ID.
•
Endpoint—Display only. Displays the following details of the endpoint:
–
Shelf number
–
Slot number
–
Port number
•
Link Number—Display only. Displays the link number.
•
LSP Number—Display only. Displays the LSP number.
•
Local Label—Displays the local label number assigned to the LSP. Click the cell to edit the value and click Apply to save the changes.
•
Out Label—Displays the out label number assigned to the LSP. Click the cell to edit the value and click Apply to save the changes.
•
Path—Display only. Displays the path, which can be Forward Path or Reverse Path, depending on the tunnel protection.
Step 9
Click Provision. An MPLS-TP tunnel is created and the details are displayed in the TP Tunnel Service table. If the details are not displayed in the TP Tunnel Service table, refresh the table.
For more information about the TP Tunnel Service table, see Understanding the TP Tunnel Service Table. For more information about troubleshooting MPLS-TP tunnels, see Understanding the MPLS-TP Tunnel Cross-Connections Table.
13.4.2 Understanding the TP Tunnel Service Table
For a description of MPLS-TP, see What Is MPLS-TP?.
Manage MPLS-TP tunnels from the TP Tunnel Service table, which lists the MPLS-TP tunnels created. To launch the table, select an NE or a group and choose Configuration > PT System > Display > TP Tunnel Table.
The following topics describe what you can do in the TP Tunnel Service table:
•
How Do I View or Modify an MPLS-TP Tunnel?
•
How Do I Delete an MPLS-TP Tunnel?
•
How Do I Trace an MPLS-TP Tunnel?
•
How Do I Launch the Pseudowire Service Table from the TP Tunnel Service Table?
The following table describes the fields in the TP Tunnel Service table.
Table 13-4 Field Descriptions for the TP Tunnel Service Table
Field
|
Description
|
Name
|
Displays the name of the MPLS-TP tunnel.
|
Description
|
Displays the description of the MPLS-TP tunnel.
|
Discovery State
|
Displays the result of the Prime Optical consistency check. There are two discovery states:
• Discovered—The Layer 2 service is marked as Discovered if the Prime Optical consistency check is successful.
• Incomplete—The Layer 2 service is marked as Incomplete if the Prime Optical consistency check fails. The MPLS-TP tunnel is not an end-to-end connection.
|
Tunnel Key
|
Displays the tunnel key of the MPLS-TP tunnel. Tunnel key is the service identifier and consists of the following details:
• Source node ID
• Source tunnel number
• Destination node ID
• Destination tunnel number
|
Protection
|
Displays the protection status of the MPLS-TP tunnel: Protected or Unprotected.
|
Bandwidth Tx (Kbps)
|
Displays the bandwidth transmitted.
|
Bandwidth Rx (Kbps)
|
Displays the bandwidth received.
|
13.4.3 How Do I View or Modify an MPLS-TP Tunnel?
For descriptions of MPLS-TP and LSP, see the following sections:
•
What Is MPLS-TP?
•
What Is an LSP?
View or modify MPLS-TP tunnels using the Modify TP Tunnel wizard.
Note
Some of the fields in the Modify TP Tunnel wizard are not editable.
Note
When updated data is available, an information bar appears. Click Refresh Data to retrieve updated data.
To view or modify an MPLS-TP tunnel:
Step 1
From the TP Tunnel Service table, select the MPLS-TP tunnel that you want to view or modify. The row you select is highlighted in gray.
Step 2
In the TP Tunnel Service table, choose Edit > View/Modify (or click View/Modify in the toolbar). The Modify TP Tunnel wizard opens.
Step 3
In the General tab, there are two areas:
a.
In the General area, view or modify the following fields:
Note
If even one of the NEs forming the MPLS-TP tunnel is not in service or not reachable, you cannot modify the Name and Description fields.
•
Name—Displays the name of the MPLS-TP tunnel. To modify the name, delete the previous entry. In the Name field, enter the new name.
•
Circuit Status—Display only. Displays the circuit status: Discovered or Incomplete.
•
State—Display only. Displays the operational state: Up or Down.
•
Protection—Display only. Displays the protection status: Protected or Unprotected.
•
Description—Displays the description of the MPLS-TP tunnel. To modify the description, delete the previous entry. In the Description field, enter the new description.
•
Monitoring—Display only. Displays the monitoring status of the service:
Monitored—All NEs involved are in service and reachable.
Not monitored—All the NEs involved are out of service or unreachable.
Partially monitored—The NEs involved are in a mixed status (some NEs are reachable and others are not).
•
Service ID—Display only. Displays the service ID.
•
Tunnel Key—Display only. Displays the tunnel key.
•
Tx Bandwidth—Display only. Displays the bandwidth transmitted.
•
Rx Bandwidth—Display only. Displays the bandwidth received.
b.
In the Endpoints area, view or modify the following fields:
•
Set Admin State on all Endpoints—From the drop-down list, select the admin state to be applied on all endpoints: Up and Down.
•
Node—Display only. Displays the NE ID.
•
Tunnel No.—Display only. Displays the tunnel number.
•
Admin State—Displays the admin state. Click the cell to enable the drop-down list. From the drop-down list, select the admin state.
•
Oper. State—Display only. Displays the operational state.
•
BFD—Displays the BFD template. Click the cell to enable the drop-down list. From the drop-down list, select the BFD template.
c.
(Optional) Click Reset to clear the changes made in the General tab.
d.
Click Apply to apply the changes made in the General tab.
Step 4
In the LSP tab, do any of the following:
•
Add LSP—Select an endpoint from the table and click the Add LSP button to add an LSP. You can add only two LSPs. See How Do I Add an LSP?.
•
Edit LSP—Select an endpoint from the table and click the Edit LSP button to modify the LSP. See How Do I Modify an LSP?.
•
Trace LSP—Select an endpoint from the table and click the Trace LSP button to open the Trace LSP window. See How Do I Trace an LSP?.
•
Delete LSP—This Delete LSP button is enabled only if there are two LSPs. Select an endpoint from the table and click the Delete LSP button to delete the LSP.
a.
In the LSP tab, confirm the following details that are displayed in the table:
•
Endpoints
•
LSP number
•
Service ID
•
Direction
•
Span number
b.
(Optional) Click Reset to clear the changes made in the LSP tab.
c.
Click Apply to apply the changes made in the LSP tab.
Step 5
In the Protection tab, confirm the details and perform actions where allowed:
Note
The Protection tab is read-only if the protection status is Unprotected.
•
Force lockout of—The working LSP or protect LSP can be locked out. Only one LSP can be locked out at a time. From the Force lockout of drop-down list, select an LSP. The options are Working LSP and Protect LSP.
•
In the Protection tab, view or modify the following details:
–
LSP—Display only. Displays the LSP number.
–
Role—Display only. Displays the role of the LSP: Working or Protect.
–
State—Display only. Displays the state of the LSP.
–
Switch State—Displays the switch state of the LSP and nodes. Click the cell to enable the drop-down list. From the drop-down list, select the switch state.
a.
(Optional) Click Reset to clear the changes made in the Protection tab.
b.
Click Apply to apply the changes made in the Protection tab.
Step 6
In the Alarm tab, do the following:
•
Click the Sync Alarms button to synchronize the alarms.
•
Click the Toggle Filter button to filter the data displayed in the table.
13.4.4 How Do I Delete an MPLS-TP Tunnel?
Note
If a topology change is made on the network (for example, if a new CPT node is added to the network using CTC), the state of one or more patchcords changes to invalid state in the Link table. To enable the correct TP tunnel discovery, you must delete all patchcords that change to the invalid state.
To delete an MPLS-TP tunnel:
Step 1
From the TP Tunnel Service table, select the MPLS-TP tunnel that you want to delete. The row you select is highlighted in gray.
Step 2
In the toolbar, click Delete.
Step 3
Click OK in the confirmation message box.
If one or more NEs forming the MPLS-TP tunnel are not in service or not reachable, the corresponding cross-connections are not deleted and an error message is displayed. However, the cross-connections on the reachable NEs are deleted.
13.4.5 How Do I Trace an MPLS-TP Tunnel?
Note
When updated data is available, an information bar appears. Click Refresh Data to retrieve updated data.
To view a high-level trace or detailed trace for an MPLS-TP tunnel:
Step 1
From the TP Tunnel Service table, select the MPLS-TP tunnel for which you want to view a high-level trace or detailed trace. The row you select is highlighted in gray.
Step 2
Choose Configuration > Trace (or click the Trace tool). The TP Tunnel Trace window opens.
Step 3
From the TP Tunnel Trace window, do any of the following:
•
Save—Choose File > Save to save your settings. Your settings become a custom map that does not affect the default map for the nodes currently displayed in the Network Map. Users who have not saved their custom map will still see the default map for those nodes.
•
Save As Default—Choose File > Save As Default to save your settings (map background, node icons, and x and y coordinates) as the default settings. Your settings become the default map for the nodes currently displayed in the Network Map, and this default map is seen by users who have not saved their custom map for those nodes. There can be only one default setting per group of nodes in the Network Map.
•
Exit—Choose File > Exit to close the TP Tunnel Trace window.
•
Refresh Data—Choose View > Refresh Data (or click the Refresh Data tool) to refresh the data displayed in the TP Tunnel Trace window.
•
Toggle Trace Level—Choose View > Toggle Trace Level (or click the Switch Between High-Level and Detailed Trace tool) to switch between high-level trace and detailed trace.
•
Zoom In—Choose Edit > Zoom In (or click the Zoom In tool) to zoom in on an object in the map view. This tool increases the size of all of the graphic objects on the map.
•
Zoom Out—Choose Edit > Zoom Out (or click the Zoom Out tool) to zoom out on the map view. This tool decreases the size of all of the graphic objects on the map.
•
Zoom Area—Choose Edit > Zoom Area (or click the Zoom Area tool) to pan and zoom the view to a different region of the map. Hold down the left mouse button and use the Zoom Area box to highlight an area on the map. When you release the left mouse button, the zoom is applied on the selected area of the map.
Step 4
In high-level trace mode and detailed trace mode, do any of the following from the node:
•
Right-click the node and click Open NE Explorer to open the NE explorer.
•
Right-click the node and click Open IOS Console to launch the Cisco IOS CLI window.
•
Right-click the node and click Filter Alarm Table to enable node-level filtering in the Alarm tab.
Step 5
To enable link-level filtering in the Alarm tab, right-click the link and click Filter Alarm Table.
Step 6
In detailed trace mode, do any of the following from the port:
•
Right-click the port and click Open Port to open the property sheet for the corresponding card.
•
Right-click the port and click Filter Alarm Table to enable port-level filtering in the Alarm tab.
Step 7
To view or modify an MPLS-TP tunnel, see How Do I View or Modify an MPLS-TP Tunnel?.
13.4.6 How Do I Launch the Pseudowire Service Table from the TP Tunnel Service Table?
To launch the Pseudowire Service table from the TP Tunnel Service table:
Step 1
From the TP Tunnel Service table, select the TP tunnel.
Step 2
Choose Configuration > Pseudowire Table (or click Open Pseudowire Table in the toolbar). The Pseudowire Service table opens for the corresponding TP tunnel.
13.4.6.1 How Do I Add an LSP?
For a description of LSP, see What Is an LSP?.
Add an LSP using the Add LSP wizard.
To add an LSP:
Step 1
In the TP Tunnel Service table, select an MPLS-TP tunnel and choose Edit > View/Modify (or click View/Modify in the toolbar). The Modify TP Tunnel wizard opens.
Step 2
In the Modify TP Tunnel wizard, go to the LSP tab.
Step 3
Select an endpoint from the table in the LSP tab and click the Add LSP button. The Add LSP wizard opens.
Step 4
In the Routing Preferences pane:
a.
In the LSP Number area, enter the LSP number in the LSP field. By default, an incremental value is displayed. For example, if the previous LSP number was 245, the new LSP number is will be 246.
b.
In the Routing Details area, confirm the details and perform actions where allowed:
Note
The Automatic Routing and Use Required Nodes/Spans options are mutually exclusive.
•
Check the Automatic Routing check box if you want the route to be calculated by the system.
•
Check the Use Required Nodes/Spans check box if you want to manually select the route. Include or exclude NEs and links from the path.
•
Review Labels—Display only. By default, this check box is checked.
•
Protected Path—The Protected Path check box is disabled because when you add an LSP to an existing TP tunnel, the unprotected TP tunnel is automatically upgraded to a protected TP tunnel.
c.
In the Node and Link Diversity Options area, choose one of the following radio buttons if the path is protected and if you want the working LSPs and protect LSPs to be routed using paths that traverse different NEs:
•
Node Diversity Required—Select if the working LSPs and protect LSPs must be routed on different nodes.
•
Node Diversity Desired—Select if you prefer the working LSPs and protect LSPs to be routed on different nodes.
•
Link Diversity Only—Select if you want to route the working LSPs and protect LSPs on different links.
d.
Click Next.
If you checked the Automatic Routing check box, go to Step 5. If you checked the Use Required Nodes/Spans check box, go to Step 6.
Step 5
In the Review Routing pane, the route calculated by the system is displayed. There are two areas:
a.
In the NE Map area, the following details are displayed:
•
Blue links are the working LSPs.
•
Green link is the existing LSP.
•
Red dotted link is the new LSP.
b.
In the Routing Constraints area, the following details are displayed:
•
Working—Displays the working spans and provides a summary of the links and ports used by the Layer 2 service.
•
Protected—Displays the protected spans and provides a summary of the links and ports used by the Layer 2 service.
c.
Click Next.
Step 6
If you chose to manually route, confirm the details and perform actions where allowed in the Review Routing pane:
a.
NE Map—Do any of the following:
•
Insert Node/Link—Select the NE or link from the NE map and click the Insert Node/Link button. The selected NE or link is added and is displayed in the Required NE/Links section.
•
Exclude Node/Link—Select the NE or link from the NE map and click the Exclude Node/Link button. The selected NE or link is excluded and is displayed in the Excluded NE/Links section.
•
Calculate Routing—The working LSPs and protect LSPs have independent routing constraints. Click Calculate Routing to calculate the routing.
•
Clear—Click Clear to clear the routing constraints.
b.
Routing Constraints—Confirm the details:
•
LSP Constraints—Displays the LSP constraints.
•
LSP Routing Summary—Displays the working spans and provides a summary of the LSPs used by the Layer 2 service.
c.
Click Next.
Step 7
In the Review Labels pane, review the label settings that are automatically calculated by the system and click Provision. A new LSP is created and the details are displayed in a table in the LSP tab.
13.4.6.2 How Do I Modify an LSP?
For a description of LSP, see What Is an LSP?.
Modify an LSP using the Modify LSP wizard.
Note
Some of the fields in the Modify LSP wizard are not editable.
To modify an LSP:
Step 1
In the TP Tunnel Service table, select an MPLS-TP tunnel and choose Edit > View/Modify (or click View/Modify in the toolbar). The Modify TP Tunnel wizard opens.
Step 2
In the Modify TP Tunnel wizard, go to the LSP tab.
Step 3
Select an endpoint from the table in the LSP tab and click the Edit LSP button. The Modify LSP wizard opens.
Step 4
In the LSP tab, view or modify the following:
Note
If even one of the NEs forming the LSP is not in service or not reachable, you cannot modify the Local Label and Out Label fields.
•
LSP No.—Display only. Displays the LSP number.
•
Role—Display only. Displays the role of the LSP: Working or Protected.
•
Monitoring—Display only. Displays the monitoring status of the service:
–
Monitored—All NEs involved are in service and reachable.
–
Not monitored—All the NEs involved are out of service or unreachable.
–
Partially monitored—The NEs involved are in a mixed status (some NEs are reachable and others are not).
•
In the Labels table, view or modify the following details:
–
Port—Display only. Displays the port number.
–
Link No.—Display only. Displays the number of the MPLS link used.
–
Local Label—Displays the local label number. Double-click the cell to edit the local label.
–
Out Label—Displays the out label number. Double-click the cell to edit the out label.
–
Path—Display only. Displays the path: Forward or Reverse.
a.
(Optional) Click Reset to clear the changes made in the LSP tab.
b.
Click Apply to apply the changes made in the LSP tab.
Step 5
In the Alarm tab, do any of the following:
•
Click the Sync Alarms button to synchronize the alarms.
•
Click the Toggle Filter button to filter the data displayed in the table.
13.4.6.3 How Do I Trace an LSP?
For a description of LSP, see What Is an LSP?.
To view a high-level trace or detailed trace of an LSP:
Step 1
In the TP Tunnel Service table, select an MPLS-TP tunnel and choose Edit > View/Modify (or click View/Modify in the toolbar). The Modify TP Tunnel wizard opens.
Step 2
In the Modify TP Tunnel wizard, go to the LSP tab.
Step 3
From the table, select an endpoint and click the Trace LSP button. The Trace LSP window opens.
Step 4
From the Trace LSP window, do any of the following:
•
Save—Choose File > Save to save your settings. Your settings become a custom map that does not affect the default map for the nodes currently displayed in the Network Map. Users who have not saved their custom map will still see the default map for those nodes.
•
Save As Default—Choose File > Save As Default to save your settings (map background, node icons, and x and y coordinates) as the default settings. Your settings become the default map for the nodes currently displayed in the Network Map and this default map is seen by users who have not saved their custom map for those nodes. There can be only one default setting per group of nodes in the Network Map.
•
Exit—Choose File > Exit to close the Trace LSP window.
•
Refresh Data—Choose View > Refresh Data (or click the Refresh Data tool) to refresh the data displayed in the Trace LSP window
•
Toggle Trace Level—Choose View > Toggle Trace Level (or click the Switch Between High-Level and Detailed Trace tool) to switch between high-level trace and detailed trace.
•
Zoom In—Choose Edit > Zoom In (or click the Zoom In tool) to zoom in on an object in the map view. This tool increases the size of all of the graphic objects on the map.
•
Zoom Out—Choose Edit > Zoom Out (or click the Zoom Out tool) to zoom out on the map view. This tool decreases the size of all of the graphic objects on the map.
•
Zoom Area—Choose Edit > Zoom Area (or click the Zoom Area tool) to pan and zoom the view to a different region of the map. Hold down the left mouse button and use the Zoom Area box to highlight an area on the map. When you release the left mouse button, the zoom is applied on the selected area of the map.
Step 5
In high-level trace mode and detailed trace mode, do any of the following from the node:
•
Right-click the node and click Open NE Explorer to open the NE explorer.
•
Right-click the node and click Open IOS Console to launch the Cisco IOS CLI window.
•
Right-click the node and click Filter Alarm Table to enable node-level filtering in the Alarm tab.
Step 6
To enable link-level filtering in the Alarm tab, right-click the link and click Filter Alarm Table.
Step 7
In detailed trace mode, do any of the following from the port:
•
Right-click the port and click Open Port to open the property sheet for the corresponding card.
•
Right-click the port and click Filter Alarm Table to enable port-level filtering in the Alarm tab.
Step 8
To modify an LSP, see How Do I Modify an LSP?.
13.5 Pseudowires
This section describes the following:
•
How Do I Create a Pseudowire?
•
Understanding the PW Service Table
•
How Do I View or Modify a Pseudowire?
•
How Do I Delete a Pseudowire?
•
How Do I Trace a Pseudowire?
13.5.1 How Do I Create a Pseudowire?
For a description of pseudowire, see What Is Pseudowire?.
Create a pseudowire using the Create Pseudowire Circuit wizard. The following table describes the launch points and the expected behavior for the Create Pseudowire Circuit wizard.
Table 13-5 Create Pseudowire Circuit Wizard Launch Points and Expected Behavior
Launch Points
|
Expected Behavior
|
Source NE node in the Domain Explorer or Subnetwork Explorer
|
Select the source ONS 15454 NE in the Domain Explorer or Subnetwork Explorer and choose Configuration > PT System > Provision > Create Pseudowire. The Create Pseudowire Circuit wizard opens. The source NE is preset to the selected source.
|
Source and destination NE nodes in the Domain Explorer or Subnetwork Explorer
|
Select the source ONS 15454 NE in the Domain Explorer or Subnetwork Explorer, right-click the NE, and choose Create L2 Service > Create Pseudowire. The pointer changes to a plus (+) symbol; select the destination NE. The destination NE must be in the same network partition as the source. The Create Pseudowire Circuit wizard opens. Source and destination NEs are preset to the selected source and destination.
Note If you press the Esc key while the plus symbol is enabled, the operation is canceled and the plus symbol returns to a pointer.
|
Source and destination NE nodes in the Network Map
|
Select Layer 2 as the layer rate from the drop-down list in the Network Map toolbar. Select the source ONS 15454 NE in the Network Map, right-click the NE, and choose Create L2 Service > Create Pseudowire. The pointer displays a line extending from the source NE; select the destination NE. The Create Pseudowire Circuit wizard opens. Source and destination NEs are preset to the selected source and destination NE nodes in the Network Map.
|
To create a pseudowire:
Step 1
Select a node for which to create a pseudowire and open the Create Pseudowire Circuit wizard. For an explanation of wizard launch points, see Table 13-5.
Step 2
In the PW Circuit Attribute pane:
a.
In the AC Global Attribute area, do the following:
•
Enter the pseudowire name in the PW Name field.
•
Enter a description for the pseudowire in the PW Description field.
•
Select the pseudowire type from the PW Type drop-down list. The options are Ethernet and VLAN. The pseudowire type depends on the configuration of the node.
•
Click the Up or Down radio button to select the pseudowire status.
b.
In the Redundancy area, do the following:
•
Check the Enabled check box to enable pseudowire redundancy, and then follow the subsequent steps. If you do not enable redundancy, go to c.
•
Check the Dual Homed Peer check box to create a special case of pseudowire protection. If you check the Dual Homed Peer check box, the pseudowire will have an additional endpoint (T-PE3).
•
In the Enable Delay field, enter the number of seconds that the backup pseudowire must wait to take over after the primary pseudowire goes down. The range is from 0 to 180 seconds.
•
Click the Delay radio button. In the Delay field, enter the number of seconds that the primary pseudowire must wait after it becomes active to take over from the backup pseudowire. The range is from 0 to 180 seconds.
•
Click the Never radio button to specify that the primary pseudowire never takes over from the backup pseudowire.
c.
In the Bandwidth area, do the following:
•
Enter the bandwidth in the Value field. Bandwidth determines the quality of service for the pseudowire.
•
Click the appropriate radio button: Kbps, Mbps, or Gbps.
d.
Click Next.
Step 3
(For unidirectional tunnels) In the PW Source TP pane, check the Unmanaged check box if the destination node is not a CPT node. In the Router ID field, enter the IP address of the unmanaged router.
Step 4
In the AC Endpoint area, identify the attachment circuit (AC) with the exact endpoint of the CPT System:
a.
To choose a port to serve as an endpoint for the pseudowire, do the following:
•
From the Shelf drop-down list, select the shelf.
•
From the Slot drop-down list, select the slot.
•
From the Port drop-down list, select the port.
b.
To choose a channel group to serve as an endpoint for the pseudowire, do the following:
•
Check the Channel Group check box.
•
From the Channel Group drop-down list, select the channel group to serve as an endpoint.
•
Click Manual Load Balancing to configure manual load balancing on the ports of the channel group. The Manual Load Balancing dialog box appears.
•
In the Primary Load-Balanced Link area, select a port from the Primary drop-down list.
•
In the Backup Load-Balanced Link area, select the required ports from the Available Ports list and click the right arrow button to move the ports to the Selected Ports list.
•
Click Apply.
Step 5
In the AC Attributes area, select the AC type. From the drop-down list, select Port Based or VLAN Based. If you select VLAN Based as the AC type, the Configure EFP and Configure QoS buttons are enabled. You must complete the following steps before proceeding to Step 6:
•
Configure EFP—See How Do I Configure an EFP?.
•
Configure QoS—See How Do I Configure QoS?.
Step 6
In the PW Attributes area, do the following:
a.
From the PW Class drop-down list, select the pseudowire class.
b.
In the VC ID field, enter the VC ID used by the pseudowire.
c.
Check the Local Label check box to specify that the pseudowire segment starting from T-PE1 is static. In the Local Label field, enter an unused static label. Otherwise, the pseudowire segment is dynamic.
If redundancy is not enabled, go to Step 8.
Step 7
In the PW Backup Attributes area, do the following:
a.
From the PW Class drop-down list, select the backup pseudowire class.
b.
In the VC ID field, enter the VC ID used by the backup pseudowire.
c.
Check the Local Label check box to specify that the backup pseudowire segment starting from T-PE1 is static. In the Local Label field, enter an unused static label. Otherwise, the backup pseudowire segment is dynamic.
Step 8
Click Next.
Step 9
In the PW Destination TP pane:
a.
From the Node drop-down list, select the destination node for the pseudowire and complete Step 3 to Step 8, as appropriate.
b.
Click Next.
Step 10
In the PW Secondary Destination TP pane:
a.
From the Node drop-down list, select the secondary destination node for the pseudowire and complete Step 3 to Step 8, as appropriate.
b.
Click Next.
Step 11
In the PW Circuit Path pane, confirm the following details:
•
NE Map—Displays the network topology. The blue link is the TP tunnel link used for routing.
•
Spans—Displays the working spans in the Spans tab.
Step 12
In the PW Circuit Path pane, go to the Working S-PEs tab. The S-PE Nodes area is displayed.
Step 13
Click Add. The Add Node dialog box opens. Do the following:
a.
(For unidirectional tunnels) Check the Unmanaged check box. In the Router ID field, enter the IP address of the unmanaged router.
b.
(For bidirectional tunnels) From the Node drop-down list, select the node.
c.
Click Apply. The node is added and is displayed in the SPE Nodes box.
d.
(Optional) Select the node and click Up to move the selected node to the top of the SPE Nodes box.
e.
(Optional) Select the node and click Down to move the selected node to the bottom of the SPE Nodes box.
f.
(Optional) Select the node and click Remove to remove the node.
Step 14
In the Segment: 1 area, do the following:
a.
In the Neighbor ID field, enter the neighbor ID.
b.
From the PW Class drop-down list, select the PW class.
c.
In the VC ID field, enter the VC ID.
d.
(For static pseudowire segments) In the Local Label field, enter an unused static label.
e.
Click Advanced Configuration. The Advanced Configuration dialog box opens. Do the following:
•
(For dynamic pseudowire segments) In the MTU field, enter the MTU value.
•
(For static pseudowire segments) Check the Requested check box and in the VLAN field, enter the VLAN ID.
•
(For dynamic pseudowire segments) In the Interface Description field, enter the interface description.
•
From the VCCV Flags drop-down list, select the VCCV flag.
•
Click Apply to save the advanced configuration for Segment: 1.
Step 15
In the Segment: 2 area, do the following:
a.
In the Neighbor ID field, enter the neighbor ID.
b.
From the PW Class drop-down list, select the PW class.
c.
In the VC ID field, enter the VC ID.
d.
(For static pseudowire segments) In the Local Label field, enter an unused static label.
e.
Click Advanced Configuration. The Advanced Configuration dialog box opens. Do the following:
•
(For dynamic pseudowire segments) In the MTU field, enter the MTU value.
•
(For static pseudowire segments) Check the Requested check box. In the VLAN field, enter the VLAN ID.
•
(For dynamic pseudowire segments) In the Interface Description field, enter the interface description.
•
From the VCCV Flags drop-down list, select the VCCV flag.
•
Click Apply to save the advanced configuration for Segment: 2.
Step 16
Click Provision. A pseudowire service is created and the details are displayed in the PW Service table. If the details are not displayed in the PW Service table, refresh the table.
For more information about the PW Service table, see Understanding the PW Service Table. For more information about troubleshooting pseudowires, see Understanding the Pseudowire Cross-Connections Table.
13.5.1.1 How Do I Configure an EFP?
For a description of an EFP, see What Is an EFP?.
Configure EFP using the EFP Configuration wizard.
To configure EFP:
Step 1
In the Outer VLAN Configuration area, do the following:
a.
Select the type of VLAN tagging by clicking the appropriate radio button. The options are Double Tagged, Single Tagged, Untagged, Default, and Any.
b.
From the TP ID drop-down list, select the TP ID. The options are dot1q, dot1ad, 0x9100, and 0x9200.
c.
In the VLAN Tag field, enter the VLAN tag.
d.
The Exact check box is enabled only if you select Single Tagged as the VLAN tagging type. Check the Exact check box if the EFP must match the exact VLAN tag.
Step 2
In the Inner VLAN Configuration area, do the following:
a.
From the TP ID drop-down list, select the TP ID. The options are dot1q, dot1ad, 0x9100, and 0x9200.
b.
In the VLAN Tag field, enter the VLAN tag.
Step 3
In the Rewrite Ingress Operation area, do the following:
a.
From the Operation drop-down list, select the rewrite operation. The options are PUSH 1, PUSH 2, POP 1, POP 2, Translate 1-to-1, Translate 1-to-2, and Translate 2-to-1.
b.
From the Outer VLAN TP ID drop-down list, select the outer VLAN TP ID. The options are dot1q, dot1ad, 0x9100, and 0x9200.
c.
In the Outer VLAN Tag field, enter the outer VLAN tag.
d.
From the Inner VLAN TP ID drop-down list, select the inner VLAN TP ID. The options are dot1q, dot1ad, 0x9100, and 0x9200.
e.
In the Inner VLAN Tag field, enter the inner VLAN tag.
f.
Check the Symmetric check box to enable the symmetric rewrite operation.
Step 4
In the Miscellaneous Configuration area, do the following in the Statistics area:
•
In Prime Optical 9.6.3, the Ingress check box is checked by default and you cannot modify it.
•
Check the Egress check box to enable egress statistics collection.
Step 5
Click Apply to save the EFP configuration.
13.5.1.2 How Do I Configure QoS?
Configure QoS using the QoS Configuration wizard.
To configure QoS:
Step 1
From the Table Map drop-down list, select the table map.
Step 2
From the Ingress drop-down list, select the ingress policy.
Step 3
From the Egress drop-down list, select the egress policy.
Step 4
Click Apply to apply the QoS configuration.
Step 5
(Optional) Click Close to the exit the QoS Configuration wizard.
13.5.2 Understanding the PW Service Table
For a description of pseudowire, see What Is Pseudowire?.
View or modify a pseudowire using the PW Service table. The PW Service table lists the pseudowires created. To launch the table, select an NE or a group and choose Configuration > PT System > Display > Pseudowire Table.
The following topics describe what you can do in the PW Service table:
•
How Do I View or Modify a Pseudowire?
•
How Do I Delete a Pseudowire?
•
How Do I Trace a Pseudowire?
The following table describes the fields in the PW Service table.
Table 13-6 Field Descriptions for the PW Service Table
Field
|
Description
|
Name
|
Displays the name of the pseudowire.
|
Description
|
Displays the description of the pseudowire.
|
Discovery State
|
Displays the result of the Prime Optical consistency check. There are two discovery states:
• Discovered—The Layer 2 service is marked as Discovered if the Prime Optical consistency check is successful.
• Incomplete—The Layer 2 service is marked as Incomplete if the Prime Optical consistency check fails. The pseudowire is not an end-to-end connection.
|
Protection
|
Displays the protection status of the pseudowire: Protected or Unprotected.
|
Bandwidth (Kbps)
|
Displays the bandwidth.
|
13.5.3 How Do I View or Modify a Pseudowire?
For a description of pseudowire, see What Is Pseudowire?.
View or modify pseudowire using the Modify PW Circuit wizard.
Note
Some of the fields in the Modify PW Circuit wizard are not editable.
Note
When updated data is available, an information bar appears. Click Refresh Data to retrieve updated data.
To view or modify a pseudowire:
Step 1
From the PW Service table, select the pseudowire that you want to view or modify. The row is highlighted in gray.
Step 2
In the PW Service table, choose Edit > View/Modify (or click View/Modify in the toolbar). The Modify PW Circuit wizard opens.
Step 3
In the General tab, view or modify the following fields:
Note
If even one of the NEs forming the pseudowire is not in service or not reachable, you cannot modify the Name and Description fields.
a.
Name—Displays the name of the pseudowire. To modify the name:
•
Delete the previous entry.
•
In the Name field, enter the new name.
b.
Circuit Status—Display only. Displays the circuit status: Discovered or Incomplete.
c.
State—Display only. Displays the state: Up or Down.
d.
Description—Displays the description of the pseudowire. To modify the description:
•
Delete the previous entry.
•
In the Description field, enter the new description.
e.
Monitoring—Display only. Displays the monitoring status of the service:
•
Monitored—All NEs involved are in service and reachable.
•
Not monitored—All the NEs involved are out of service or unreachable.
•
Partially monitored—The NEs involved are in a mixed status (some NEs are reachable and others are not).
f.
Type—Display only. Displays the type of the pseudowire: Ethernet or VLAN.
g.
Service ID—Display only. Displays the service ID.
h.
No. of Spans—Display only. Displays the number of spans.
i.
Redundancy—Display only. Displays whether redundancy is enabled or disabled.
j.
Bandwidth (Kbps)—Display only. Displays the bandwidth.
k.
(Optional) Click Reset to clear the changes made in the General tab.
l.
Click Apply to apply the changes made in the General tab.
Step 4
In the T-PE Nodes tab, view or modify the following fields:
a.
Set Admin State on all Endpoints—From the drop-down list, select the admin state to be applied on all endpoints: Up and Down.
b.
Node—Display only. Displays the node ID.
c.
Router ID—Display only. Displays the router ID.
d.
Admin State—Displays the admin state. Click the cell to modify the admin state.
e.
Oper. State—Display only. Displays the operational state.
f.
(Optional) Click Reset to clear the changes made in the T-PE Nodes tab.
g.
Click Apply to apply the changes made in the T-PE Nodes tab.
Step 5
In the AC Attributes tab (which is display only), confirm the following details that are displayed in a table:
•
Node ID—Click the right arrow to expand the node ID row. You can view the following details:
–
Outer—Displays the outer VLAN tagging type.
–
Inner—Displays the inner VLAN tagging type.
–
Rewrite Ingress operation—Click the right arrow to expand the rewrite ingress operation row. You can view the Outer (symmetric) and Inner rows.
–
Statistics—Displays whether statistics collection is enabled or disabled.
•
TP ID—Displays the TP ID.
•
VLAN Tag—Displays the VLAN tag details.
Step 6
In the PW Attributes tab (which is display only), confirm the following details that are displayed in the table:
•
Node—Displays the node details.
•
Peer ID—Displays the IP address of the peer.
•
PW Class—Displays the pseudowire class.
•
VC ID—Displays the VC ID.
•
Local Label—Displays the local label.
•
Remote Label—Displays the remote label.
Step 7
In the QoS tab, view or modify the following fields:
a.
Node—Display only. Displays the node details.
b.
Table Map—Double-click the cell to modify the table map.
c.
Ingress Policy—Double-click the cell to modify the ingress policy.
d.
Egress Policy—Double-click the cell to modify the egress policy.
e.
(Optional) Click Reset to clear the changes made in the QoS tab.
f.
Click Apply to apply the changes made in the QoS tab.
Step 8
In the Alarm tab, do the following:
•
Click the Sync Alarms button to synchronize the alarms.
•
Click the Toggle Filter button to filter the data displayed in the table.
13.5.4 How Do I Delete a Pseudowire?
To delete a pseudowire:
Step 1
From the PW Service table, select the pseudowire that you want to delete. The row that you select is highlighted in gray.
Step 2
In the toolbar, click Delete.
Step 3
Click OK in the confirmation message box.
If one or more NEs forming the pseudowire are not in service or not reachable, the corresponding cross-connections are not deleted and an error message is displayed. However, the cross-connections on the reachable NEs are deleted.
13.5.5 How Do I Trace a Pseudowire?
Note
When updated data is available, an information bar appears. Click Refresh Data to retrieve updated data.
To view a high-level trace or detailed trace for a pseudowire:
Step 1
From the PW Service table, select the pseudowire for which you want to view a high-level trace or detailed trace. The row you select is highlighted in gray.
Step 2
Choose Configuration > Trace (or click the Trace tool). The PW Circuit Trace window opens.
Step 3
From the PW Circuit Trace window, do any of the following:
•
Save—Choose File > Save to save your settings. Your settings become a custom map that does not affect the default map for the nodes currently displayed in the Network Map. Users who have not saved their custom map will still see the default map for those nodes.
•
Save As Default—Choose File > Save As Default to save your settings (map background, node icons, and x and y coordinates) as the default settings. Your settings become the default map for the nodes currently displayed in the Network Map, and this default map is seen by users who have not saved their custom map for those nodes. There can be only one default setting per group of nodes in the Network Map.
•
Exit—Choose File > Exit to close the PW Circuit Trace window.
•
Refresh Data—Choose View > Refresh Data (or click the Refresh Data tool) to refresh the data displayed in the PW Circuit Trace window.
•
Toggle Trace Level—Choose View > Toggle Trace Level (or click the Switch Between High-Level and Detailed Trace tool) to switch between high-level trace and detailed trace.
•
Zoom In—Choose Edit > Zoom In (or click the Zoom In tool) to zoom in on an object in the map view. This tool increases the size of all of the graphic objects on the map.
•
Zoom Out—Choose Edit > Zoom Out (or click the Zoom Out tool) to zoom out on the map view. This tool decreases the size of all of the graphic objects on the map.
•
Zoom Area—Choose Edit > Zoom Area (or click the Zoom Area tool) to pan and zoom the view to a different region of the map. Hold down the left mouse button and use the Zoom Area box to highlight an area on the map. When you release the left mouse button, the zoom is applied on the selected area of the map.
Step 4
In high-level trace mode and detailed trace mode, do any of the following from the node:
•
Right-click the node and click Open NE Explorer to open the NE explorer.
•
Right-click the node and click Open IOS Console to launch the IOS CLI window.
•
Right-click the node and click Filter Alarm Table to enable node-level filtering in the Alarm tab.
Step 5
To enable link-level filtering in the Alarm tab, right-click the link and click Filter Alarm Table.
Step 6
In detailed trace mode, do any of the following from the port:
•
Right-click the port and click Open Port to open the property sheet for the corresponding card.
•
Right-click the port and click Filter Alarm Table to enable port-level filtering in the Alarm tab.
Step 7
To view or modify a pseudowire, see How Do I View or Modify a Pseudowire?.
13.6 EVCs
This section describes the following:
•
How Do I Create an EVC?
•
Understanding the EVC Service Table
•
How Do I View or Modify an EVC?
•
How Do I Delete an EVC?
•
How Do I Trace an EVC?
13.6.1 How Do I Create an EVC?
For a description of EVC, see What Is an EVC?.
Create an EVC using the Create EVC Circuit wizard. The following table describes the launch points and the expected behavior for the Create EVC Circuit wizard.
Table 13-7 Create EVC Circuit Wizard Launch Points and Expected Behavior
Launch Points
|
Expected Behavior
|
Source NE node in the Domain Explorer or Subnetwork Explorer
|
Select the source ONS 15454 NE in the Domain Explorer or Subnetwork Explorer and choose Configuration > PT System > Provision > Create EVC. The Create EVC Circuit wizard opens. The source NE is preset to the selected source.
|
Source and destination NE nodes in the Domain Explorer or Subnetwork Explorer
|
Select the source ONS 15454 NE in the Domain Explorer or Subnetwork Explorer, right-click the NE, and choose Create L2 Service > Create EVC. The pointer changes to a plus (+) symbol; select the destination NE. The destination NE must be in the same network partition as the source. The Create EVC Circuit wizard opens. Source and destination NEs are preset to the selected source and destination.
Note If you press the Esc key while the plus symbol is enabled, the operation is canceled and the plus symbol returns to a pointer.
|
Source and destination NE nodes in the Network Map
|
Select Layer 2 as the layer rate from the drop-down list in the Network Map toolbar. Select the source ONS 15454 NE in the Network Map, right-click the NE, and choose Create L2 Service > Create EVC. The pointer displays a line extending from the source NE; select the destination NE. The Create EVC Circuit wizard opens. Source and destination NEs are preset to the selected source and destination NE nodes in the Network Map.
|
To create an EVC:
Step 1
Select a node for which to create an EVC and open the Create EVC Circuit wizard. For an explanation of wizard launch points, see Table 13-7.
Step 2
In the Info View pane:
a.
In the EVC Details area, do the following:
•
In the EVC Name field, enter the name of the EVC.
•
In the EVC Description field, enter the description of the EVC.
•
From the EVC Type drop-down list, select the EVC type: Private Line, Virtual Private Line, Private LAN, or Virtual Private LAN.
•
From the State drop-down list, select the EFP state: Up and Down. This EFP state maps to the EFP admin state in the Cisco IOS software.
•
Open Ended—Check the Open Ended check box to create an open-ended circuit.
b.
In the Bandwidth area, do the following:
•
In the Bandwidth Tx field, enter the bandwidth to be transmitted and click the appropriate radio button.
•
In the Bandwidth Rx field, enter the bandwidth to be received and click the appropriate radio button.
c.
Click Next.
Step 3
In the Source pane:
a.
From the Node drop-down list, select the source node.
b.
To choose a port to serve as the source EFP, confirm the details and perform actions where allowed:
•
Shelf—Displays the shelf number, which is automatically retrieved from the NE.
•
From the Slot drop-down list, select the slot.
•
From the Port drop-down list, select the port. The ports populated in the drop-down list depend on the selected slot.
c.
Check the Channel Group check box to select a channel group to serve as the source EFP.
•
From the Channel Group drop-down list, select the channel group to serve as the source EFP.
•
Click Manual Load Balancing to configure manual load balancing on the ports of the channel group. The Manual Load Balancing dialog box appears.
•
In the Primary Load-Balanced Link area, from the Primary drop-down list, select a port.
•
In the Backup Load-Balanced Link area, from the Available Ports list, select the required ports. Click the right arrow button to move the ports to the Selected Ports list.
•
Click Apply.
d.
Click Next.
Step 4
In the Destination pane:
a.
From the Node drop-down list, select the destination node.
b.
To choose a port to serve as the destination EFP, confirm the details and perform actions where allowed:
•
Shelf—Displays the shelf number, which is automatically retrieved from the NE.
•
From the Slot drop-down list, select the slot.
•
From the Port drop-down list, select the port. The ports populated in the drop-down list depend on the selected slot.
c.
Check the Channel Group check box to choose a channel group to serve as the destination EFP, and then do the following:
•
From the Channel Group drop-down list, select the channel group to serve as the destination EFP.
•
Click Manual Load Balancing to configure manual load balancing on the ports of the channel group. The Manual Load Balancing dialog box appears.
•
In the Primary Load-Balanced Link area, from the Primary drop-down list, select a port.
•
In the Backup Load-Balanced Link area, from the Available Ports list, select the required ports. Click the right arrow button to move the ports to the Selected Ports list.
•
Click Apply.
d.
Click Next.
Step 5
In the Routing pane:
Note
The Automatic Routing and Use Required Nodes options are mutually exclusive.
•
If you want the route to be calculated by the system, check the Automatic Routing check box. Go to Step 6.
•
If you want to manually select the route. check the Use Required Nodes/Spans check box Go to Step 7.
Step 6
The Node Selection pane is display-only and shows the EVC route as a blue link. Click Next and go to Step 8.
Step 7
In the Node Selection pane:
a.
To specify the nodes to include in (or exclude from) the EVC, modify, as needed, the options in the NE Map:
•
Select the node and click the Include Node/Link button. The selected node is added and is displayed in the Required NEs/Links section.
•
Select the node and click the Exclude Node/Link button. The selected node is excluded and is displayed in the Excluded NEs/Links section.
•
The nodes have independent routing constraints. Click Calculate Routing to calculate the routing.
•
Click Clear to clear the routing constraints.
b.
The Routing Constraints area displays the following details:
•
Constraints—The working NEs added using the Include Node/Link option and the working NEs excluded using the Exclude Node/Link option. To delete a node, right-click the node and click Delete.
•
Spans Summary—A summary of the spans, links, and ports used by the Layer 2 service.
c.
Click Next.
Step 8
In the Review EFP pane, specify the VLAN configuration for the EFPs:
a.
Select an EFP in the EVC path:
•
The node is populated in the Node drop-down list.
•
The port is populated in the Port drop-down list.
b.
In the Outer VLAN Configuration area, do the following:
•
Select the type of VLAN tagging by clicking the appropriate radio button: Double Tagged, Single Tagged, Untagged, Default, or Any.
•
From the TP ID drop-down list, select the TP ID: dot1q, dot1ad, 0x9100, or 0x9200.
•
In the VLAN Tag field, enter the VLAN tag.
•
The Exact check box is enabled only if you select the VLAN tagging type as Single Tagged. Check the Exact check box if the EFP must match the exact VLAN tag.
c.
In the Inner VLAN Configuration area, do the following:
•
From the TP ID drop-down list, select the TP ID: dot1q, dot1ad, 0x9100, or 0x9200.
•
In the VLAN Tag field, enter the VLAN tag.
d.
In the Rewrite Ingress Operation area, do the following:
•
From the Operation drop-down list, select the rewrite operation: PUSH 1, PUSH 2, POP 1, POP 2, Translate 1-to-1, Translate 1-to-2, or Translate 2-to-1.
•
From the Outer VLAN TP ID drop-down list, select the outer VLAN TP ID: dot1q, dot1ad, 0x9100, or 0x9200.
•
In the Outer VLAN Tag field, enter the outer VLAN tag.
•
From the Inner VLAN TP ID drop-down list, select the inner VLAN TP ID: dot1q, dot1ad, 0x9100, or 0x9200.
•
In the Inner VLAN Tag field, enter the inner VLAN tag.
•
Check the Symmetric check box to enable the symmetric rewrite operation.
e.
In the Miscellaneous Configuration area, do the following:
•
(For Multipoint EVCs) In the Split Horizon area, check the Enable Split Horizon check box to enable the split horizon for the EFPs.
•
In the Statistics area, check the Ingress check box to enable ingress statistics collection, or check the Egress check box to enable egress statistics collection.
f.
Click Apply to apply this configuration on the selected EFP.
g.
Click Apply All to derive the EFP configuration on all the EFPs in the EVC path from the source UNI and network-to-network interface (NNI) EFP configuration.
The source node UNI and NNI EFP configuration that is specified are copied to the destination node UNI and NNI, respectively. The source node NNI configuration is copied to all the other EFPs. If the EVC has only one node, the Apply All button is disabled.
Step 9
Click Provision. An EVC is created and the details are displayed in the EVC Service table. If the details are not displayed in the EVC Service table, refresh the table.
For more information about the EVC Service table, see Understanding the EVC Service Table. For more information about troubleshooting EVCs, see Understanding the EVC Cross-Connections Table.
13.6.2 Understanding the EVC Service Table
For a description of EVC, see What Is an EVC?.
View or modify an EVC from the EVC Service table. The EVC Service table lists the EVCs created. To launch the EVC Service table, select an NE or a group and choose Configuration > PT System > Display > EVC Table.
The following topics describe what you can do in the EVC Service table:
•
How Do I View or Modify an EVC?
•
How Do I Delete an EVC?
•
How Do I Trace an EVC?
The following table describes the fields in the EVC Service table.
Table 13-8 Field Descriptions for the EVC Service Table
Field
|
Description
|
Name
|
Displays the name of the EVC.
|
Description
|
Displays the description of the EVC.
|
Discovery State
|
Displays the result of the Prime Optical consistency check. There are two discovery states:
• Discovered—The Layer 2 service is marked as Discovered if the Prime Optical consistency check is successful.
• Incomplete—The Layer 2 service is marked as Incomplete if the Prime Optical consistency check fails. The EVC is not an end-to-end connection.
|
Operational State
|
Displays the operational state of the EVC circuit: Up or Down.
|
13.6.3 How Do I View or Modify an EVC?
For descriptions of EVC, EFP, bridge domain, IGMP snooping, and MVR, see the following sections:
•
What Is an EVC?
•
What Is an EFP?
•
What Is a Bridge Domain?
•
What Is IGMP Snooping?
•
What Is MVR?
View or modify an EVC using the Modify EVC Circuit wizard.
Note
Some of the fields in the Modify EVC Circuit wizard are not editable.
Note
When updated data is available, an information bar appears. Click Refresh Data to retrieve updated data.
To view or modify an EVC:
Step 1
Select a row in the EVC Service table. The row is highlighted in gray.
Step 2
In the EVC Service table, choose Edit > View/Modify (or click View/Modify in the toolbar). The Modify EVC Circuit wizard opens.
Step 3
In the General tab (which is display only), confirm the following details:
•
Name—Displays the name of the EVC.
•
Description—Displays the description of the EVC.
•
Monitoring—Display only. Displays the monitoring status of the service:
–
Monitored—All NEs involved are in service and reachable.
–
Not monitored—All the NEs involved are out of service or unreachable.
–
Partially monitored—The NEs involved are in a mixed status (some NEs are reachable and others are not).
•
Circuit Status—Displays the status of the EVC: Discovered or Incomplete.
•
Service ID—Displays the service ID of the EVC.
•
EVC Type—Displays the type of the EVC. The EVC type can be:
–
Ethernet Private Line
–
Ethernet Virtual Private Line
–
Ethernet Private LAN
–
Ethernet Virtual Private LAN
Step 4
In the Endpoint EFPs tab, the endpoints are listed in a table. Do any of the following:
a.
Add Drop—Click the Add Drop button to add a drop. To add a drop, see How Do I Add a Drop?.
b.
Delete Drop—To delete a drop, do the following:
•
Select the endpoint from the Endpoints table.
•
Click the Delete Drop button.
•
Click OK in the confirmation message box. The endpoint is deleted.
c.
(Optional) Click Reset to clear the changes made in the Endpoints tab.
d.
Click Apply to apply the changes made in the Endpoints tab.
Step 5
In the EFP Configuration tab, view or modify the EFP configuration settings:
a.
Node ID—Display only. Click the right arrow to expand the node ID row. You can view the following details:
•
Slot/Port—Display only. Displays the slot number and the port number.
•
Outer—Display only. Displays the outer VLAN tagging type.
•
Inner—Display only. Displays the inner VLAN tagging type.
•
Rewrite Ingress Operation—Display only. Displays the rewrite ingress operation status. Click the right arrow to expand the rewrite ingress operation row. You can view the Outer (symmetric) and Inner rows.
•
Statistics—Display only. Displays the type of statistics collection (ingress or egress).
b.
TP ID—Display only. Displays the TP ID.
c.
VLAN Tag—Display only. Displays the VLAN tag details.
d.
Admin State—Displays the admin state. Click the cell to enable the drop-down list. From the drop-down list, select the admin state: Up and Down.
e.
MLB—Displays the manual load balancing configuration. Click the cell to enable the drop-down list. From the drop-down list, select the manual load balancing configuration.
f.
(Optional) Click Reset to clear the changes made in the EFP Configuration tab.
g.
Click Apply to apply the changes made in the EFP Configuration tab.
Step 6
In the QoS tab, view or modify the QoS settings on individual EFPs and the node:
a.
Node—Display only. Displays the node ID.
b.
Ingress Policy—Displays the ingress policy applied. Click the cell to enable the drop-down list. All the available ingress QoS policies are populated in the drop-down list. From the drop-down list, select the ingress QoS policy that you want to apply.
c.
Egress Policy—Displays the egress policy applied. Click the cell to enable the drop-down list. All the available egress QoS policies are populated in the drop-down list. From the drop-down list, select the egress QoS policy that you want to apply.
d.
(Optional) Click Reset to clear the changes made in the QoS tab.
e.
Click Apply to apply the changes made in the QoS tab.
Step 7
In the IGMP Snooping tab, view or modify the IGMP snooping settings:
a.
In the Bridge Domain Configuration table, view or modify the following:
•
Bridge Domain—Display only. Displays the node ID, slot number, and port number.
•
In the IGMP Snooping column, check the check box to enable IGMP snooping on the corresponding bridge domain.
•
In the Immediate Leave column, check the check box to enable immediate leave. When you enable IGMP immediate leave, IGMP snooping immediately removes a port when it detects an IGMP version 2 leave message on that port.
•
In the Report Suppression column, check the check box to enable report suppression. When you enable report suppression, the bridge domain forwards only one IGMP report for each multicast query.
b.
In the EFP Configuration table, do the following:
•
Ethernet Flow Port—Display only. Displays the node ID, slot number, and port number.
•
In the IGMP Static Router Port column, click the cell to enable the drop-down list. The options are True and False. To add a static router to the EFP, from the drop-down list, select True.
c.
(Optional) Click Reset to clear the changes made in the IGMP Snooping tab.
d.
Click Apply to apply the changes made in the IGMP Snooping tab.
Step 8
In the MAC Learning tab, view or modify the MAC learning settings:
a.
In the Bridge Domain Configuration table, view or modify the following:
•
Bridge Domain—Display only. Displays the node ID, slot number, and port number.
•
In the MAC Learning column, check the check box to enable MAC learning on the corresponding bridge domain.
•
In the Limit column, double-click the cell and enter the upper limit on the number of MAC addresses that reside in a bridge domain. The default MAC address limit on a bridge domain is 1000. The maximum MAC address limit on a bridge domain is 128000.
b.
To add MAC addresses, do the following in the EFP Configuration table:
•
Select a node.
•
Click the Add MAC Addresses button. The Add Static MAC Addresses dialog box opens.
Note
You can add multiple MAC addresses.
•
In the MAC Address field, enter the MAC address.
•
Click Add. The MAC address appears in the text box. To remove the MAC address, select the MAC address from the text box and click Remove.
•
Click Apply. The MAC address is added.
c.
To delete MAC addresses, do the following in the EFP Configuration table:
•
Select a node.
•
Click the Clear MAC Addresses button.
•
Click OK in the confirmation text box. The MAC addresses are deleted.
d.
In the EFP Configuration table, view or modify the following:
•
Node—Display only. Displays the node ID.
•
MAC Address—Display only. Displays the MAC address. To add MAC addresses, go to b. To delete MAC addresses, go to c.
e.
(Optional) Click Reset to clear the changes made in the MAC Learning tab.
f.
Click Apply to apply the changes made in the MAC Learning tab.
Step 9
In the MVR tab, view or modify the MVR settings:
a.
In the Bridge Domain Configuration table, view or modify the following:
•
Bridge Domain—Display only. Displays the node ID, slot number, and port number.
•
In the MVR column, check the check box to enable MVR for the corresponding bridge domain.
b.
In the EFP Configuration table, view or modify the following:
•
Ethernet Flow Point—Display only. Displays the node ID, slot number, and port number.
•
In the MVR Type column, click the cell to enable the drop-down list. The MVR Type can be None, Source, or Receiver for each EFP.
•
In the Source Service ID column, click the cell, and from the drop-down list, select an MVR-enabled service.
•
In the Immediate Leave column, check the check box to enable the drop-down list. The options are True and False. When you enable immediate leave, MVR immediately removes a port when it detects a leave message on that port.
•
In the VLAN column, double-click the cell and enter the VLAN ID.
c.
(Optional) Click Reset to clear the changes made in the MVR tab.
d.
Click Apply to apply the changes made in the MVR tab.
Step 10
In the Alarm tab, do any of the following:
•
Click the Sync Alarms button to synchronize the alarms.
•
Click the Toggle Filter button to filter the data displayed in the table.
13.6.4 How Do I Delete an EVC?
To delete an EVC:
Step 1
From the EVC Service table, select the EVC that you want to delete. The row that you select is highlighted in gray.
Step 2
In the toolbar, click Delete.
Step 3
Click OK in the confirmation message box.
If one or more NEs forming the EVC are not in service or not reachable, the corresponding cross-connections are not deleted and an error message is displayed. However, the cross-connections on the reachable NEs are deleted.
13.6.5 How Do I Trace an EVC?
Note
When updated data is available, an information bar appears. Click Refresh Data to retrieve updated data.
To view a high-level trace or detailed trace for an EVC:
Step 1
From the EVC Service table, select the EVC for which you want to view a high-level trace or detailed trace. The row that you select is highlighted in gray.
Step 2
Choose Configuration > Trace (or click the Trace tool). The EVC Circuit Trace window opens.
Step 3
From the EVC Circuit Trace window, do any of the following:
•
Save—Choose File > Save to save your settings. Your settings become a custom map that does not affect the default map for the nodes currently displayed in the Network Map. Users who have not saved their custom map will still see the default map for those nodes.
•
Save As Default—Choose File > Save As Default to save your settings (map background, node icons, and x and y coordinates) as the default settings. Your settings become the default map for the nodes currently displayed in the Network Map, and this default map is seen by users who have not saved their custom map for those nodes. There can be only one default setting per group of nodes in the Network Map.
•
Exit—Choose File > Exit to close the EVC Circuit Trace window.
•
Refresh Data—Choose View > Refresh Data (or click the Refresh Data tool) to refresh the data displayed in the EVC Circuit Trace window.
•
Toggle Trace Level—Choose View > Toggle Trace Level (or click the Switch Between High-Level and Detailed Trace tool) to switch between high-level trace and detailed trace.
•
Zoom In—Choose Edit > Zoom In (or click the Zoom In tool) to zoom in on an object in the map view. This tool increases the size of all of the graphic objects on the map.
•
Zoom Out—Choose Edit > Zoom Out (or click the Zoom Out tool) to zoom out on the map view. This tool decreases the size of all of the graphic objects on the map.
•
Zoom Area—Choose Edit > Zoom Area (or click the Zoom Area tool) to pan and zoom the view to a different region of the map. Hold down the left mouse button and use the Zoom Area box to highlight an area on the map. When you release the left mouse button, the zoom is applied on the selected area of the map.
Step 4
In high-level trace mode and detailed trace mode, do any of the following from the node:
•
Right-click the node and click Open NE Explorer to open the NE explorer.
•
Right-click the node and click Open IOS Console to launch the Cisco IOS CLI window.
•
Right-click the node and click Filter Alarm Table to enable node-level filtering in the Alarm tab.
Step 5
To enable link-level filtering in the Alarm tab, right-click the link and click Filter Alarm Table.
Step 6
In detailed trace mode, do any of the following from the port:
•
Right-click the port and click Open Port to open the property sheet for the corresponding card.
•
Right-click the port and click Filter Alarm Table to enable port-level filtering in the Alarm tab.
Step 7
To view or modify an EVC, see How Do I View or Modify an EVC?.
13.6.5.1 How Do I Add a Drop?
Add a drop using the Add Drop wizard.
To add a drop:
Step 1
Complete Step 1 through Step 3 in How Do I View or Modify an EVC?.
Step 2
Click the Add Drop button. The Add Drop wizard launches.
Step 3
In the Destination pane, do the following:
a.
From the Node drop-down list, select the destination node.
b.
To choose a port to serve as the destination EFP, confirm the details and perform actions where allowed:
•
Shelf—Displays the shelf number, which is automatically retrieved from the NE.
•
From the Slot drop-down list, select the slot.
•
From the Port drop-down list, select the port. The ports populated in the drop-down list depend on the selected slot.
c.
Check the Channel Group check box to choose a channel group to serve as the destination EFP.
•
From the Channel Group drop-down list, select the channel group to serve as the destination EFP.
•
Click Manual Load Balancing to configure manual load balancing on the ports of the channel group. The Manual Load Balancing dialog box appears.
•
In the Primary Load-Balanced Link area, from the Primary drop-down list, select a port.
•
In the Backup Load-Balanced Link area, from the Available Ports list, select the required ports. Click the right arrow button to move the ports to the Selected Ports list.
•
Click Apply.
d.
Click Next.
Step 4
In the Routing pane, do the following:
Note
The Automatic Routing and Use Required Nodes options are mutually exclusive.
•
If you want the route to be calculated by the system, check the Automatic Routing check box. Go to Step 5.
•
If you want to manually select the route, check the Use Required Nodes/Spans check box. Include or exclude NEs and links from the path. Go to Step 6.
Step 5
The Node Selection pane is display-only and shows the EVC route as a blue link. Click Next and go to Step 7.
Step 6
In the Node Selection pane, do any of the following:
a.
To specify the nodes to include in (or exclude from) the EVC, modify, as needed, the options in the NE Map:
•
Select the node and click the Include Node/Link button. The selected node is added and is displayed in the Required NEs/Links section.
•
Select the node and click the Exclude Node/Link button. The selected node is excluded and is displayed in the Excluded NEs/Links section.
•
The nodes have independent routing constraints. Click Calculate Routing to calculate the routing.
•
Click Clear to clear the routing constraints.
b.
The Routing Constraints area displays the following details:
•
Working—The working NEs added using the Include Node/Link option and the working NEs excluded using the Exclude Node/Link option. To delete a node, right-click the node and click Delete.
•
Spans Summary—A summary of the spans, links, and ports used by the Layer 2 service.
c.
Click Next.
Step 7
In the Review EFP pane, specify the VLAN configuration for the EFPs:
a.
Select an EFP in the EVC path:
•
The node is populated in the Node drop-down list.
•
The port is populated in the Port drop-down list.
b.
In the Outer VLAN Configuration area, do the following:
•
Select the type of VLAN tagging by clicking the appropriate radio button: Double Tagged, Single Tagged, Untagged, Default, or Any.
•
From the TP ID drop-down list, select the TP ID: dot1q, dot1ad, 0x9100, or 0x9200.
•
In the VLAN Tag field, enter the VLAN tag.
•
The Exact check box is enabled only if you select the VLAN tagging type as Single Tagged. Check the Exact check box to match the exact tag.
c.
In the Inner VLAN Configuration area, do the following:
•
From the TP ID drop-down list, select the TP ID: dot1q, dot1ad, 0x9100, or 0x9200.
•
In the VLAN Tag field, enter the VLAN tag.
d.
In the Rewrite Ingress Operation area, do the following:
•
From the Operation drop-down list, select the rewrite operation: PUSH 1, PUSH 2, POP 1, POP 2, Translate 1-to-1, Translate 1-to-2, or Translate 2-to-1.
•
From the Outer VLAN TP ID drop-down list, select the outer VLAN TP ID: dot1q, dot1ad, 0x9100, or 0x9200.
•
In the Outer VLAN Tag field, enter the outer VLAN tag.
•
From the Inner VLAN TP ID drop-down list, select the inner VLAN TP ID: dot1q, dot1ad, 0x9100, or 0x9200.
•
In the Inner VLAN Tag field, enter the inner VLAN tag.
•
Check the Symmetric check box to enable the symmetric rewrite operation.
e.
In the Miscellaneous Configuration area, do the following:
•
(For Multipoint EVCs) In the Split Horizon area, check the Enable Split Horizon check box to enable the split horizon for the EFPs.
•
In the Statistics area, check the Ingress check box to enable ingress statistics collection or check the Egress check box to enable egress statistics collection.
f.
Click Apply to apply this configuration on the selected EFP.
g.
Click Apply All to derive the EFP configuration on all the EFPs in the EVC path from the source UNI and network-to-network interface (NNI) EFP configuration.
The source node UNI and NNI EFP configuration that is specified are copied to the destination node UNI and NNI, respectively. The source node NNI configuration is copied to all the other EFPs. If the EVC has only one node, the Apply All button is disabled.
Step 8
Click Provision. An endpoint is created and the details are displayed in the Endpoints table in the Endpoint EFPs tab.
13.7 Understanding Advanced Troubleshooting Options
Use the Advanced Troubleshooting options to troubleshoot Layer 2 services. In Prime Optical, the PT System Advanced Troubleshooting options are visible only to SuperUser and NetworkAdmin users.
Choose Configuration > PT System > Advanced Troubleshooting. The following options are available:
•
TP Tunnel Cross-Connections Table—Allows you to launch the TP Tunnel Cross-Connections table.
•
Pseudowire Cross-Connections Table—Allows you to launch the Pseudowire Cross-Connections table.
•
EVC Cross-Connections Table—Allows you to launch the EVC Cross-Connections table.
•
Refresh L2 Service Data Discovery—Allows you to refresh Layer 2 services.
From the TP Tunnel Cross-Connections table, Pseudowire Cross-Connections table, and EVC Cross-Connections table, you can identify whether the Operational State or Admin State of a particular service is Down. The Discovery State column displays whether the discovery is successful or not. You can perform the following operations from these tables:
•
Rediscover
•
Refresh
•
Delete
•
Open the corresponding service table
The following topics describe the Advanced Troubleshooting options:
•
Understanding the MPLS-TP Tunnel Cross-Connections Table
•
Understanding the Pseudowire Cross-Connections Table
•
Understanding the EVC Cross-Connections Table
•
Understanding the Refresh L2 Service Data Discovery Option
13.7.1 Understanding the MPLS-TP Tunnel Cross-Connections Table
Step 1
Select an NE or a group.
Step 2
Choose Configuration > PT System > Advanced Troubleshooting > TP Tunnel Cross-Connections Table. The MPLS-TP Tunnel Cross-Connections table opens.
Step 3
From the MPLS-TP Tunnel Cross-Connections table, do any of the following:
•
Delete—To delete an MPLS-TP cross-connection:
–
Select the MPLS-TP cross-connection that you want to delete. The row you select is highlighted in gray.
–
Choose Edit > Delete.
–
Click OK in the confirmation message box. The MPLS-TP cross-connection is deleted.
•
Open TP Tunnel Table—To cross-launch the TP Tunnel Service table:
–
Select the MPLS-TP cross-connection for which you want to cross-launch the TP Tunnel Service table. The row you select is highlighted in gray.
–
Choose Edit > Open TP Tunnel Table (or click Open TP Tunnel Table in the toolbar). The TP Tunnel Service table for the selected MPLS-TP cross-connection opens.
•
Rediscover—To rediscover an MPLS-TP cross-connection:
–
Select the MPLS-TP cross-connection that you want to rediscover. The row you select is highlighted in gray.
–
Choose Configuration > Rediscover (or click Rediscover in the toolbar).
–
Click OK in the confirmation message box. The data for the selected MPLS-TP cross-connection is deleted from the Prime Optical database and then rediscovered from the NE.
•
Update—To force polling on an MPLS-TP cross-connection:
–
Select the MPLS-TP cross-connection on which you want to force polling on. The row you select is highlighted in gray.
–
Choose Configuration > Update (or click Update in the toolbar). Polling is forced on the selected MPLS-TP cross-connection. If there are any changes, the selected MPLS-TP cross-connection is updated.
The following table describes the fields in the MPLS-TP Tunnel Cross-Connections table.
Table 13-9 Field Descriptions for the MPLS-TP Tunnel Cross-Connections Table
Field
|
Description
|
Service Name
|
Displays the name of the MPLS-TP tunnel cross-connection.
|
Description
|
Displays the description of the MPLS-TP tunnel cross-connection.
|
Service ID
|
Displays the service ID of the MPLS-TP tunnel cross-connection.
|
Node ID
|
Displays the node ID of the MPLS-TP tunnel cross-connection.
|
Discovery State
|
Displays the discovery state of the MPLS-TP tunnel cross-connection. Values are:
• Clean—Discovery is successful and Prime Optical was able to save the data in the database.
• Dirty—Prime Optical was unable to save some of the data in the database.
|
Operational State
|
Displays the operational state of the MPLS-TP tunnel cross-connection: Up or Down.
|
Admin State
|
Displays the admin state of the MPLS-TP tunnel cross-connection: Up or Down.
|
Cross-Connection Type
|
Displays the cross-connection type of the MPLS-TP tunnel: Midpoint or Endpoint.
|
13.7.2 Understanding the Pseudowire Cross-Connections Table
Step 1
Select an NE or a group.
Step 2
Choose Configuration > PT System > Advanced Troubleshooting > Pseudowire Cross-Connections Table. The Pseudowire Cross-Connections table opens.
Step 3
From the Pseudowire Cross-Connections table, do any of the following:
•
Delete—To delete a pseudowire cross-connection:
–
Select the pseudowire cross-connection that you want to delete. The row you select is highlighted in gray.
–
Choose Edit > Delete.
–
Click OK in the confirmation message box. The pseudowire cross-connection is deleted.
•
Open Pseudowire Table—To cross-launch the PW Service table:
–
Select the pseudowire cross-connection for which you want to cross-launch the PW Service table. The row you select is highlighted in gray.
–
Choose Edit > Open Pseudowire Table (or click Open Pseudowire Table in the toolbar). The PW Service table for the selected pseudowire cross-connection opens.
•
Rediscover—To rediscover a pseudowire cross-connection:
–
Select the pseudowire cross-connection that you want to rediscover. The row you select is highlighted in gray.
–
Choose Configuration > Rediscover (or click Rediscover in the toolbar).
–
Click OK in the confirmation message box. The data for the selected pseudowire cross-connection is deleted from the Prime Optical database and then rediscovered from the NE.
•
Update—To force polling on a pseudowire cross-connection:
–
Select the pseudowire cross-connection on which you want to force polling on. The row you select is highlighted in gray.
–
Choose Configuration > Update (or click Update in the toolbar). Polling is forced on the selected pseudowire cross-connection. If there are any changes, the selected pseudowire cross-connection is updated.
The following table describes the fields in the Pseudowire Cross-Connections table.
Table 13-10 Field Descriptions for the Pseudowire Cross-Connections Table
Field
|
Description
|
Service Name
|
Displays the name of the pseudowire cross-connection.
|
Description
|
Displays the description of the pseudowire cross-connection.
|
Service ID
|
Displays the service ID of the pseudowire cross-connection.
|
Node ID
|
Displays the node ID of the pseudowire cross-connection.
|
Discovery State
|
Displays the discovery state of the pseudowire cross-connection. Values are:
• Clean—Discovery is successful and Prime Optical was able to save the data in the database.
• Dirty—Prime Optical was unable to save some of the data in the database.
|
Operational State
|
Displays the operational state of the pseudowire cross-connection: Up or Down.
|
Admin State
|
Displays the admin state of the pseudowire cross-connection: Up or Down.
|
Cross-Connection Type
|
Displays the cross-connection type of the pseudowire: PW Midpoint or PW Endpoint.
|
13.7.3 Understanding the EVC Cross-Connections Table
Step 1
Select an NE or a group.
Step 2
Choose Configuration > PT System > Advanced Troubleshooting > EVC Cross-Connections Table. The EVC Cross-Connections table opens.
Step 3
From the EVC Cross-Connections table, do any of the following:
•
Delete—To delete an EVC cross-connection:
–
Select the EVC cross-connection that you want to delete. The row you select is highlighted in gray.
–
Choose Edit > Delete.
–
Click OK in the confirmation message box. The EVC cross-connection is deleted.
•
Open EVC Table—To cross-launch the EVC Service table:
–
Select the EVC cross-connection for which you want to cross-launch the EVC Service table. The row you select is highlighted in gray.
–
Choose Edit > Open EVC Table (or click Open EVC Table in the toolbar). The EVC Service table for the selected EVC cross-connection opens.
•
Rediscover—To rediscover an EVC cross-connection:
–
Select the EVC cross-connection that you want to rediscover. The row you select is highlighted in gray.
–
Choose Configuration > Rediscover (or click Rediscover in the toolbar).
–
Click OK in the confirmation message box. The data for the selected EVC cross-connection is deleted from the Prime Optical database and then rediscovered from the NE.
•
Update—To force polling on an EVC cross-connection:
–
Select the EVC cross-connection on which you want to force polling on. The row you select is highlighted in gray.
–
Choose Configuration > Update (or click Update in the toolbar). Polling is forced on the selected EVC cross-connection. If there are any changes, the selected EVC cross-connection is updated.
The following table describes the fields in the EVC Cross-Connections table.
Table 13-11 Field Descriptions for the EVC Cross-Connections Table
Field
|
Description
|
Service Name
|
Displays the name of the EVC cross-connection.
|
Description
|
Displays the description of the EVC cross-connection.
|
Service ID
|
Displays the service ID of the EVC cross-connection.
|
Node ID
|
Displays the node ID of the EVC cross-connection.
|
Discovery State
|
Displays the discovery state of the EVC cross-connection. Values are:
• Clean—Discovery is successful and Prime Optical was able to save the data in the database.
• Dirty—Prime Optical was unable to save some of the data in the database.
|
Operational State
|
Displays the operational state of the EVC cross-connection: Up or Down.
|
Admin State
|
Displays the admin state of the EVC cross-connection: Up or Down.
|
Service Type
|
Displays the service type of the EVC cross-connection.
|
13.7.4 Understanding the Refresh L2 Service Data Discovery Option
To refresh all the Layer 2 services, choose Configuration > PT System > Advanced Troubleshooting > Refresh L2 Service Data Discovery.
The Refresh L2 Service Data Discovery option allows you retrieve the current data from the Prime Optical database. After you click Refresh L2 Service Data Discovery, the following tables are updated with the current data from the Prime Optical database:
•
TP Tunnel Service Table
•
PW Service Table
•
EVC Service Table
•
TP Tunnel Cross-Connections Table
•
Pseudowire Cross-Connections Table
•
EVC Cross-Connections Table
13.8 CPT System QoS
This section describes the following:
•
How Do I Create and Manage QoS Objects?
•
How Do I Provision QoS Objects in the CPT System?
13.8.1 How Do I Create and Manage QoS Objects?
For a description of the CPT System QoS, see What Is CPT System QoS?.
The PT System QoS Editor allows you to create and manage QoS objects in the Prime Optical database. To launch the PT System QoS Editor, choose Configuration > PT System > Provision > QoS Editor.
The following table lists the tabs and the function of each option in the PT System QoS Editor.
Table 13-12 PT System QoS Editor Tabs and Options
Tab
|
Options
|
Function
|
Class Maps—See How Do I Create and Manage Class Maps?
|
Add
|
Allows you to add a class map.
|
Remove
|
Allows you to delete a class map.
|
Edit
|
Allows you to edit a class map.
|
Matching Attributes area
|
Displays the matching attributes and the value for each attribute.
|
Actions—See How Do I Add and Manage Actions?
|
Add
|
Allows you to add an action.
|
Remove
|
Allows you to delete an action.
|
Edit
|
Allows you to edit an action.
|
Traffic Marking
|
Allows you to create and manage traffic markers.
|
Ingress Policing
|
Allows you to configure ingress policing.
Policing provides a means to limit the amount of bandwidth that the traffic traveling through a given port or a service instance can use. Policing works by defining an amount of data that the router is willing to receive in kilobytes per second (KB/s). When policing is configured, it limits the flow of data through the router by dropping or marking down the QoS value.
When policing is configured, traffic is placed in one of the following categories:
• Conform
• Exceed
• Violate
You can decide the action to be applied from the following three categories:
• Packets that conform can be configured to be transmitted.
• Packets that exceed can be configured to be sent with a decreased priority.
• Packets that violate can be configured to be dropped.
|
Egress Shaping
|
Allows you to configure egress shaping.
Traffic shaping allows you to control the traffic going out of an interface in order to match its flow to the speed of the remote target interface and to ensure that the traffic conforms to policies contracted for it.
You can use shaping to meet downstream requirements, thereby eliminating bottlenecks in topologies with data-rate mismatches. Shaping is the process of delaying packets in queues to make them conform to a specified profile.
|
Policy Maps—See How Do I Create and Manage Policy Maps?
|
Add
|
Allows you to add a policy map.
|
Remove
|
Allows you to delete a policy map.
|
Edit
|
Allows you to edit a policy map.
|
Table Maps—See How Do I Create and Manage Table Maps?
|
Add
|
Allows you to add a table map.
|
Remove
|
Allows you to delete a table map.
|
Edit
|
Allows you to edit a table map.
|
Attributes area
|
Displays the attributes and the value for each attribute.
|
13.8.1.1 How Do I Create and Manage Class Maps?
Create and manage class maps using the PT System QoS Editor. You can perform the following operations:
•
Create a class map—How Do I Create a Class Map?
•
Edit a class map—How Do I Edit a Class Map?
•
Delete a class map—How Do I Delete a Class Map?
13.8.1.1.1 How Do I Create a Class Map?
To create a class map:
Step 1
Choose Configuration > PT System > Provision > QoS Editor. The PT System QoS Editor opens.
Step 2
Go to the Class Maps tab.
Step 3
Click the Add a Class Map button. The Add Class Map dialog box opens. Do the following:
a.
In the Class Map Name field, enter the name of the class map.
b.
Select the match criteria by clicking one of the following radio buttons:
•
Match All—If you want the criteria to match all rules from c to g.
Note
If you select the Match All radio button, the mpls experimental topmost check box is disabled because it is not applicable.
•
Match Any—If you want the criteria to match any rule from c to g.
Note
You can enter multiple values in the cos, mpls experimental, qos group, vlan, ip dscp, and ip precedence fields. The values that you enter must be separated by a blank space.
c.
Check the check box preceding the cos field and enter a value from 0 to 7 in the cos field.
d.
Check the check box preceding the mpls experimental topmost field and enter a value from 0 to 7 in the mpls experimental topmost field.
e.
Check the check box preceding the qos group field and enter a value from 0 to 9 in the qos group field.
f.
Check the check box preceding the vlan field; then, enter a value from 1 to 4094 or ranges of VLANs [1-4094]. You can enter up to 30 values.
g.
Check the check box preceding the ip dscp and ip precedence drop-down list:
•
From the drop-down list, select ip dscp and enter a value from 0 to 63 in the ip dscp field.
•
From the drop-down list, select ip precedence and enter a value from 0 to 7 in the ip precedence field.
Step 4
Click OK. The class map is created. The following details appear in a table in the Class Maps tab:
•
Class Map—Displays the class map name.
•
Match Criteria—Displays the match criteria you selected.
•
Matching Attributes:
–
Match Attribute—Displays the attribute.
–
Attribute Value—Displays the value of the attribute.
13.8.1.1.2 How Do I Edit a Class Map?
To edit a class map:
Step 1
Choose Configuration > PT System > Provision > QoS Editor. The PT System QoS Editor opens.
Step 2
Go to the Class Maps tab.
Step 3
Select the class map that you want to edit.
Step 4
Click the Edit a Class Map button. The Edit Class Map dialog box opens.
Step 5
Edit the class map details, as appropriate.
Step 6
Click OK. The updated details appear in the Class Maps tab.
13.8.1.1.3 How Do I Delete a Class Map?
To delete a class map:
Step 1
Choose Configuration > PT System > Provision > QoS Editor. The PT System QoS Editor opens.
Step 2
Go to the Class Maps tab.
Step 3
Select the class map that you want to delete.
Step 4
Click the Remove a Class Map button.
Step 5
Click OK in the confirmation message box. The class map is deleted.
13.8.1.2 How Do I Add and Manage Actions?
Add and manage actions using the PT System QoS Editor. You can perform the following operations:
•
Add an action—How Do I Add an Action?.
•
Edit an action—How Do I Edit an Action?.
•
Delete an action—How Do I Delete an Action?.
13.8.1.2.1 How Do I Add an Action?
To add an action:
Step 1
Choose Configuration > PT System > Provision > QoS Editor. The PT System QoS Editor opens.
Step 2
Go to the Actions tab.
Step 3
Click the Add an Action button. The Add Action dialog box opens.
Step 4
In the Action Name field, enter the name of the action. A valid name contains from 1 to 50 characters. Add the following:
•
Traffic marker—To create a traffic marker, go to Step 5.
•
Ingress policy—To create an ingress policy, go to Step 6.
•
Egress shaping policy—To create an egress policy, go to Step 10.
Step 5
Select the Traffic Marking tab and click the Add a Traffic Marker button. The Add Traffic Marker dialog box opens. Do the following:
a.
From the Attribute drop-down list, select the attribute. See Table 13-13.
b.
In the Value field, enter the value for the attribute you selected. See Table 13-13.
Table 13-13 Attribute and Value
Attribute
|
Value
|
cos
|
0 to 7
|
ip precedence
|
0 to 7
|
ip dscp
|
0 to 63
|
qos group
|
0 to 9
|
discard class
|
0 to 2
|
c.
Click OK. The new traffic marker appears in the Traffic Marking tab.
Step 6
Go to the Ingress Policing tab and do the following:
a.
From the Rate drop-down list, select the rate. The options are:
•
Single-Rate Dual Color (CIR)
•
Single-Rate Dual Color (PIR)
•
Single-Rate Three Color
•
Dual-Rate Three Color
b.
Enter values for any of the following options that remain after you select a rate. (The following options are enabled or disabled depending on the rate you select. For example, if you select Single-Rate Dual Color (CIR) as the rate, the Peak Info Rate and Peak Burst Size options are disabled.)
•
In the Committed Info Rate field, enter the value; then, from the drop-down list, select the appropriate bit rate.
•
In the Peak Info Rate field, enter the value; then, from the drop-down list, select the appropriate bit rate.
•
In the Burst Size field, enter the value; then, from the drop-down list, select the appropriate bit rate.
•
In the Peak Burst Size field, enter the value; then, from the drop-down list, select the appropriate bit rate.
Step 7
In the Ingress Policing tab, go to the Conform Actions subtab and click the Add a Conform Action button. The Add Conform Action dialog box opens.
a.
From the Action drop-down list, select the attribute. See Table 13-14.
b.
In the Value field, enter the value for the selected attribute. See Table 13-14.
Table 13-14 Attribute and Value
Attribute
|
Value
|
DROP
|
—
|
TRANSMIT
|
If no actions are specified, the default conform action is transmit.
|
set-discard-class-transmit
|
0 to 2
|
set-dscp-transmit
|
0 to 63
|
set-prec-transmit
|
0 to 7
|
set-cos-transmit
|
0 to 7
|
set-qos-transmit
|
0 to 9
|
c.
Click OK. The new conform action appears in the Conform Actions subtab. Edit or delete a conform action:
•
To edit a conform action, select the row and click the Edit a Conform Action button. The Edit Conform Action dialog box opens. Edit the details, as appropriate.
•
To delete a conform action, select the row and click the Remove a Conform Action button. The conform action is deleted.
Step 8
In the Ingress Policing tab, go to the Exceed Actions subtab and click the Add an Exceed Action button. The Add Exceed Action dialog box opens.
a.
From the Action drop-down list, select the attribute. See Table 13-15.
b.
In the Value field, enter the value for the selected attribute. See Table 13-15.
Table 13-15 Attribute and Value
Attribute
|
Value
|
DROP
|
If no actions are specified, the default exceed action is drop.
|
TRANSMIT
|
—
|
set-discard-class-transmit
|
0 to 2
|
set-dscp-transmit
|
0 to 63
|
set-prec-transmit
|
0 to 7
|
set-cos-transmit
|
0 to 7
|
set-qos-transmit
|
0 to 9
|
c.
Click OK. The exceed action appears in the Exceed Actions subtab. Add or edit an exceed action:
•
To edit an exceed action, select the row and click the Edit an Exceed Action button. The Edit Exceed Action dialog box opens. Edit the details, as appropriate.
•
To delete an exceed action, select the row and click the Remove an Exceed Action button. The exceed action is deleted.
Step 9
In the Ingress Policing tab, go to the Violate Actions subtab and click the Add a Violate Action button. The Add Violate Action dialog box opens.
a.
From the Action drop-down list, select the attribute. See Table 13-16.
b.
In the Value field, enter the value for the selected attribute. See Table 13-16.
Table 13-16 Attribute and Value
Attribute
|
Value
|
DROP
|
If no actions are specified, the default violate action is drop.
|
TRANSMIT
|
—
|
set-discard-class-transmit
|
0 to 2
|
set-dscp-transmit
|
0 to 63
|
set-prec-transmit
|
0 to 7
|
set-cos-transmit
|
0 to 7
|
set-qos-transmit
|
0 to 9
|
c.
Click OK. The violate action appears in the Violate Actions subtab. Add or edit a violate action:
•
To edit a violate action, select the row and click the Edit a Violate Action button. The Edit Violate Action dialog box opens. Edit the details, as appropriate.
•
To delete a violate action, select the row and click the Remove a Violate Action button. The violate action is deleted from the table.
Step 10
Go to the Egress Shaping tab and do the following:
a.
Click the Priority radio button to enable the Priority field.
Note
If you do not want to enter a priority, check the Blank check box to disable the Priority option.
•
In the Priority field, enter the value. See Table 13-17.
•
From the drop-down list, select the unit. See Table 13-17.
Table 13-17 Unit and Value
Unit
|
Value
|
kbps
|
8 to 10000000
|
%
|
1 to 100
|
level
|
1 to 2
|
b.
Click the Average Rate radio button to set the average rate.
•
In the Average Rate field, enter the value.
•
From the drop-down list, select the unit.
Note
The Minimum Bandwidth and Remaining Bandwidth options are enabled only if you select Average Rate. These options are mutually exclusive.
•
Click the Minimum Bandwidth radio button and enter a value in the Minimum Bandwidth field. From the drop-down list, select the unit.
•
Click the Remaining Bandwidth radio button and enter a value in the Remaining Bandwidth field. From the drop-down list, select the unit.
Step 11
Click OK. The new action appears in the Actions tab.
13.8.1.2.2 How Do I Edit an Action?
To edit an action:
Step 1
Choose Configuration > PT System > Provision > QoS Editor. The PT System QoS Editor opens.
Step 2
Go to the Actions tab.
Step 3
Select the action that you want to edit.
Step 4
Click the Edit an Action button. The Edit Action dialog box opens.
Step 5
Edit the action details, as appropriate.
Step 6
Click OK. The updated details appear in the Actions tab.
13.8.1.2.3 How Do I Delete an Action?
To delete an action:
Step 1
Choose Configuration > PT System > Provision > QoS Editor. The PT System QoS Editor opens.
Step 2
Go to the Actions tab.
Step 3
Select the action that you want to delete from the table.
Step 4
Click the Remove an Action button.
Step 5
Click OK in the confirmation message box. The action is deleted.
13.8.1.3 How Do I Create and Manage Policy Maps?
Create and manage policy maps in the PT System QoS Editor. You can perform the following operations:
•
Create a policy map—How Do I Create a Policy Map?.
•
Edit a policy map—How Do I Edit a Policy Map?.
•
Delete a policy map—How Do I Delete a Policy Map?.
13.8.1.3.1 How Do I Create a Policy Map?
To create a policy map:
Step 1
Choose Configuration > PT System > Provision > QoS Editor. The PT System QoS Editor opens.
Step 2
Go to the Policy Maps tab.
Step 3
Click the Add a Policy Map button. The Add Policy Map dialog box opens.
Step 4
In the Policy Map Name field, enter the name. A valid name contains from 1 to 50 characters.
Step 5
Click the Add Policy Map Attributes button. The Add Policy Map Attributes dialog box opens.
Step 6
Class Map—Enter the name of a class map or click Browse to select a class map. The Select a Class Map dialog box opens.
a.
To select a class map that you created:
•
Select the class map from the Class Map area. The selected class map name appears in the Selected Class Map field.
•
Click OK. The class map is added as an attribute.
b.
To select a default class map:
•
Check the check box preceding the Default Class Map drop-down list.
•
From the Default Class Map drop-down list, select the default class map. The selected default class map appears in the Selected Class Map field.
•
Click OK. The default class map is added as an attribute.
You can create and manage class maps from the Select a Class Map dialog box. For more information, see How Do I Create and Manage Class Maps?.
Step 7
Action—Enter the name of an action or click Browse to browse for an action. The Select an Action dialog box opens.
a.
Select an action. The name of the selected action appears in the Selected Action field.
b.
Click OK. The action is added.
You can create and manage actions from the Select an Action dialog box. For more information, see How Do I Add and Manage Actions?.
Step 8
Child Policy—Enter the name of a child policy or click Browse to browse for a child policy map. The Select a Policy Map dialog box opens.
a.
Select the child policy map. The name of the child policy map appears in the Selected Policy Map field.
b.
Click OK. The child policy map is added.
Step 9
Click OK in the Add Policy Map Attributes dialog box. The details of the class map, child policy, and action you added appear in the Add Policy Map window.
Step 10
Click OK in the Add Policy Map window. The new policy map appears in the Policy Maps tab.
13.8.1.3.2 How Do I Edit a Policy Map?
To edit a policy map:
Step 1
Choose Configuration > PT System > Provision > QoS Editor. The PT System QoS Editor opens.
Step 2
Go to the Policy Maps tab.
Step 3
Select the policy map that you want to edit.
Step 4
Click the Edit a Policy Map button. The Edit Policy Map dialog box opens.
Step 5
Edit the policy map details, as appropriate.
Step 6
Click OK. The updated details appear in the Policy Maps tab.
13.8.1.3.3 How Do I Delete a Policy Map?
To delete a policy map:
Step 1
Choose Configuration > PT System > Provision > QoS Editor. The PT System QoS Editor opens.
Step 2
Go to the Policy Maps tab.
Step 3
Select the policy map that you want to delete.
Note
If the selected policy map is acting as a child policy in another policy map, you cannot delete it.
Step 4
Click the Remove a Policy Map button.
Step 5
Click OK in the confirmation message box. The policy map is deleted.
13.8.1.4 How Do I Create and Manage Table Maps?
Create and manage table maps in the PT System QoS Editor. You can perform the following operations:
•
Create a table map—How Do I Create a Table Map?.
•
Edit a table map—How Do I Edit a Table Map?.
•
Delete a table map—How Do I Delete a Table Map?.
13.8.1.4.1 How Do I Create a Table Map?
To create a table map:
Step 1
Choose Configuration > PT System > Provision > QoS Editor. The PT System QoS Editor opens.
Step 2
Go to the Table Maps tab.
Step 3
Click the Add a Table Map button. The Add Table Map dialog box opens.
Step 4
In the Table Map Name field, enter the table map name.
Note
The Default Copy and Default Value options are mutually exclusive.
Step 5
Check the Default Copy check box to copy the value of the qos-group set at ingress to the MPLS EXP or VLAN CoS bit. The lower three bits of the qos-group are used as to-value.
Step 6
In the Default Value field, enter the default value. Valid values are from 0 to 999. If there is no combination of qos-group and discard-class provisioned in the table map, set the MPLS EXP bit or the VLAN CoS bit to the value shown in the text box.
Step 7
Click the Add Table Map Attributes button in the Add Table Name dialog box to add attributes. The Add Table Map Attributes dialog box opens.
Step 8
In the Add Attributes dialog box, do the following:
a.
In the QoS Group field, enter a value from 0 to 999.
b.
In the Discard Class field, enter a value from 0 to 999.
c.
In the MPLS or CoS field, enter a value from 0 to 999.
d.
Click OK. The attributes are added and the details are displayed in a table in the Add Table Map dialog box. Edit or delete the attributes:
•
To edit the attributes, select the row and click the Edit Attributes button. The Edit Attributes dialog box opens. Edit the details, as appropriate.
•
To delete an attribute, select the row and click the Remove Attributes button. The attribute is deleted from the table.
Step 9
Click OK in the Add Table Map dialog box. The table map is created and the following details appear in a table in the Table Maps tab:
•
Table Map—Displays the name of the table map.
•
Default Copy—Indicates whether default copy is enabled. The value can be True or False.
•
Default—Displays the default value.
•
Attributes:
–
QoS Group—Displays the QoS group value.
–
Discard Class—Displays the discard class value.
–
MPLS or CoS—Displays the MPLS or CoS value.
13.8.1.4.2 How Do I Edit a Table Map?
To edit a table map:
Step 1
Choose Configuration > PT System > Provision > QoS Editor. The PT System QoS Editor opens.
Step 2
Go to the Table Maps tab.
Step 3
Select the table map that you want to edit.
Step 4
Click the Edit a Table Map button. The Edit Table Map dialog box opens.
Step 5
Edit the table map details, as appropriate.
Step 6
Click OK. The updated details appear in the Table Maps tab.
13.8.1.4.3 How Do I Delete a Table Map?
To delete a table map:
Step 1
Choose Configuration > PT System > Provision > QoS Editor. The PT System QoS Editor opens.
Step 2
Go to the Table Maps tab.
Step 3
Select the table map that you want to delete.
Step 4
Click the Remove a Table Map button.
Step 5
Click OK in the confirmation text box. The table map is deleted.
13.8.2 How Do I Provision QoS Objects in the CPT System?
For a description of the CPT System QoS, see What Is CPT System QoS?.
Provision QoS objects in the PT System using the Provisioning PT System QoS wizard. To launch the wizard, choose Configuration > PT System > Provision > QoS Provisioning.
To provision QoS objects in the PT System:
Step 1
Choose Configuration > PT System > Provision > QoS Provisioning. The Provisioning CPT QoS wizard opens.
Step 2
In the Select Class Maps pane, view or modify the following:
a.
Available Class Maps—Displays the class maps that you created using the PT System QoS Editor.
•
Select the class map that you want to provision. Select multiple class maps by holding down the Ctrl key.
•
Move the class maps from the Available Class Maps area to the Selected Class Maps area. Use the arrow buttons, as appropriate.
b.
Selected Class Maps—Displays the selected class maps.
•
Select the class map that you want to deselect and use the arrow buttons, as appropriate.
c.
Click Next.
Step 3
In the Select Policy Maps pane, view or modify the following:
a.
Available Policy Maps—Displays the policy maps that you created using the PT System QoS Editor.
•
Select the policy map that you want to provision. Select multiple policy maps by holding down the Ctrl key.
•
Move the policy maps from the Available Policy Maps area to the Selected Policy Maps area. Use the arrow buttons, as appropriate.
b.
Selected Policy Maps—Displays the selected policy maps.
•
Select the policy map that you want to deselect and use the arrow buttons, as appropriate.
c.
Click Next.
Step 4
In the Select Table Maps pane, do the following:
a.
Available Table Maps—Displays the table maps that you created using the PT System QoS Editor.
•
Select the table map that you want to provision. Select multiple table maps by holding down the Ctrl key.
•
Move the table maps from the Available Table Maps area to the Selected Table Maps area. Use the arrow buttons, as appropriate.
b.
Selected Table Maps—Displays the selected table maps.
•
Deselect any of the table maps. Select the table map that you want to deselect and use the arrow buttons, as appropriate.
c.
Click Next.
Step 5
In the Select CPTs pane, select the node on which to provision the QoS objects and do any of the following:
•
Check the Network check box to provision the QoS objects in all the available CPTs in the network.
•
Check the NE ID check box to provision the QoS objects in all the available CPTs in the node.
•
Check the Shelf check box to provision the QoS objects in all the available CPTs in the shelf.
•
Check the Slot check box to provision the QoS objects in that particular slot.
Step 6
Click Finish. The QoS Provisioning pane opens and displays the progress:
•
Progress Bar—Displays the progress of the provisioning operation.
•
Validation Result—The CPT QoS provisioning result is displayed in the Validation Result area of the pane. The result can be one of the following:
–
Success—CPT QoS provisioning succeeded. Proceed to Step 7.
–
In Progress—CPT QoS provisioning is in progress. The Close button is disabled while provisioning is in progress.
–
Partially Failed—CPT QoS provisioning failed on some NEs. The details of the QoS objects and the NEs that failed are displayed in the Provisioning Log area.
–
Failed—CPT QoS provisioning failed. The reason for the failure is displayed in the Provisioning Log area.
•
Provisioning Log—Displays the reason for the CPT QoS provisioning failure. Click Save Log to save the log in the client file system. You cannot save the log in the Prime Optical server.
Step 7
Click Close to exit the Provisioning PT System QoS wizard.
Step 8
Open the NE Explorer of the target NEs and choose PT System > Provisioning > QoS. In the QoS property pane, you can view the QoS objects provisioned. For more information, see QoS.
13.9 CPT System
This section describes the following:
•
Understanding CPT Cards
•
Overview of the CPT System Property Sheet
•
Understanding the CPT System Alarms
13.9.1 Understanding CPT Cards
Note
CPT System is displayed as "PT System" in the Prime Optical user interface.
The CPT System is supported on the CPT 200 and CPT 600 chassis. The CPT 200 chassis consists of two service slots and has a 160-GB switch capacity. The CPT 600 chassis consists of six service slots and has a 480-GB switch capacity.
The following are the CPT cards:
•
PTF_10GE_4—See Slot Properties—PTF_10GE_4.
•
PT_10GE_4—See Slot Properties—PT_10GE_4.
The PTSA_GE panel is a standalone unit and can be connected to the PT System. The PTSA_GE panel enables the number of ports to be scaled on the CPT System. For more information, see Slot Properties—PTSA_GE.
PTF_10GE_4 and PT_10GE_4 cards are supported on the CPT 200 and CPT 600 platforms. The CPT System complies with RoHS-6 standards.
The following system configuration is recommended on the CPT 200 shelf:
•
Standalone PTF_10GE_4 card
•
Standalone TNC, TNCE, TSC, or TSCE card
•
One or more PTSA_GE panels
The following system configuration is recommended on the CPT 600 shelf:
•
Redundant PTF_10GE_4 cards
•
One PT_10GE_4 card
•
Redundant TNC, TNCE, TSC, or TSCE cards
•
One or more PTSA_GE panels
The CPT System integrates DWDM, OTN, Ethernet, and standards-based MPLS-TP in a single system. The CPT System also integrates with other Cisco platforms such as the ONS 15454, and Carrier Routing System to deliver a combined IP/MPLS and MPLS-TP solution under a single control plane, forwarding mechanism, and NMS. This solution enables you to interoperate with existing IP/MPLS networks.
The CPT System works in the metro edge and access portion of the network, providing an integrated packet and transport solution. The CPT System significantly reduces rack space and power consumption.
The following topics describe the CPT cards:
•
Slot Properties—PTF_10GE_4
•
Slot Properties—PT_10GE_4
•
Slot Properties—PTSA_GE
13.9.2 Overview of the CPT System Property Sheet
For descriptions of the CPT System, CPT cards, and LACP, see the following sections:
•
What Is the CPT System?
•
Understanding CPT Cards
•
What Is LACP?
Note
CPT System is displayed as "PT System" in the Prime Optical user interface.
When you choose Configuration > NE Explorer for the ONS 15454 SONET or ONS 15454 SDH, the window that Prime Optical displays consists of a tree on the left side and a properties pane on the right. The tree provides a hierarchical view of the NE's physical shelves and slots. In the tree, click PT System to open the PT System property sheet. The properties pane shows information about the PT System.
This section includes:
•
Identification
•
Channel Groups
•
Configuration Mode
•
IOS CLI
•
MPLS-TP
•
Pseudowire Class
•
QoS
•
Service Alarm
•
Timing
When you open the PT System, the default property displayed is the Identification property.
13.9.2.1 Identification
The Identification property displays the list of CPT cards managed by the PT System. The Identification property displays the details in a table. The table has two columns:
•
Physical Location—Displays the following details:
–
Shelf number
–
Slot number
–
Fan-Out-Group (FOG) number
•
Module Name—Displays the name of the card or panel.
13.9.2.2 Channel Groups
The Channel Groups property property has two tabs:
•
Channel Groups—Allows you to perform the following operations:
–
Create channel groups—To create a channel group, see How Do I Create Channel Groups?.
–
Edit channel groups—To edit a channel group, see How Do I Modify Channel Groups?.
–
Delete channel groups—To delete a channel group, select the channel group from the Channel Groups table and click the Delete a Channel Group button.
–
Filter—Allows you to filter the data displayed in the Channel Groups table.
–
Configure channel groups to use LACP—To configure channel groups to use LACP, see How Do I Configure Channel Group Using LACP?.
–
Configure actions for each Layer 2 protocol—To configure actions for each Layer 2 protocol, see How Do I Configure Actions for Each Layer 2 Protocol?.
–
Create load balance configuration—To create a load balance configuration, see How Do I Configure Manual Load Balancing?.
–
Edit load balance configuration—To edit a load balance configuration, see How Do I Modify Manual Load Balancing Configuration?.
–
Delete load balance configuration—Select the load balance configuration from the Manual Load Balancing table and click the Delete a Load Balance Configuration button.
–
Filter—Allows you to filter the data displayed in the Manual Load Balancing table.
•
Layer 2 Protocols—Allows you to modify the action for each Layer 2 protocol, see Layer 2 Protocols Tab.
13.9.2.2.1 Channel Groups Tab
The Channel Groups tab has two tables:
•
Channel Groups Table—See Table 13-18.
•
Manual Load Balancing Table—See Table 13-19.
Table 13-18 Field Descriptions for the Channel Groups Table
Field
|
Description
|
Channel Group
|
Displays the channel group ID.
|
Name
|
Displays the name of the channel group.
|
Ports
|
Displays the port details.
|
MTU
|
Displays the MTU value.
|
Ingress Policy Map
|
Displays the ingress policy map details.
|
Ingress Table Map
|
Displays the ingress table map details.
|
Ingress Table Map Config
|
This field is disabled in Prime Optical 9.6.3.
|
Egress Policy Map
|
Displays the egress policy map details.
|
Table 13-19 Field Descriptions for the Manual Load Balancing Table
Field
|
Description
|
Primary Port
|
Displays the primary port details.
|
Secondary Port
|
Displays the secondary port details.
|
13.9.2.2.2 Layer 2 Protocols Tab
The Layer 2 Protocols tab allows you to view and modify actions for Layer 2 protocols. To modify an action, click the cell and select the action from the drop-down list.
Table 13-20 Field Descriptions for the Layer 2 Protocols Tab
Field
|
Description
|
Port
|
Displays the port number.
|
CDP
|
Displays the Layer 2 action configured for CDP.
|
DOT1X
|
Displays the Layer 2 action configured for DOT1X.
|
DTP
|
Displays the Layer 2 action configured for DTP.
|
LACP
|
Displays the Layer 2 action configured for LACP.
|
PAGP
|
Displays the Layer 2 action configured for PAGP.
|
VTP
|
Displays the Layer 2 action configured for VTP.
|
STP
|
Displays the Layer 2 action configured for STP.
|
13.9.2.3 Configuration Mode
The Configuration Mode property is display only. The Operation Mode field in the Configuration Mode property displays the operation mode of the PT System. The operation mode can be IOS Mode or CTC Mode.
If the operation mode is CTC Mode, all the following properties are displayed:
•
Channel Groups
•
Configuration Mode
•
IOS CLI
•
Pseudowire Class
•
QoS
•
Service Alarm
If the operation mode is IOS Mode, only the following two properties are displayed:
•
Configuration Mode
•
IOS CLI
Note
If you switch from CTC Mode to IOS Mode, all the Layer 2 services are deleted automatically.
In IOS Mode, you cannot perform the following operations:
•
Create Layer 2 services
•
View Layer 2 services
•
Modify Layer 2 services
•
Trace Layer 2 services
•
Troubleshoot Layer 2 services
13.9.2.4 IOS CLI
Monitor Layer 2 service level performance counters using the IOS CLI property. From the PT System IOS CLI Interface area, click Launch CLI.
•
If you are using a Solaris or Linux operating system, an xterm window runs a Telnet tunnel connection to the active PTF_10GE_4 card IOS console of the PT System.
•
If you are using a Windows operating system and if Telnet is installed on the PC running the Prime Optical client, Telnet is directly used to open the tunnel connection.
From the IOS CLI window, you can run the show interfaces command. You can also run other Cisco IOS commands on the IOS CLI, but it depends on the security settings and the account active on the PT System.
13.9.2.5 MPLS-TP
The MPLS-TP property allows you to:
•
Configure global settings—Global Settings
•
Create, edit, and delete BFD templates—BFD Template
13.9.2.5.1 Global Settings
The following table describes the fields in the Global Settings tab.
Table 13-21 Field Descriptions for the Global Settings Table
Field
|
Description
|
Node ID
|
Enter the source node ID for all the MPLS-TP tunnels configured on the router.
|
Global ID
|
Enter the default global ID used for all the endpoints and midpoints. Enter a value from 0 to 2147483647. The default value is 0.
|
WTR Timer
|
Enter the wait-to-restore (WTR) timer. This timer controls the length of time that the system needs to wait before reverting to the original working path following the repair of a fault on the original working path. Enter a value from 0 to 2147483647.
|
TP Fault OAM area
|
Refresh Timer
|
Enter the maximum time between successive fault OAM messages specified in seconds. Enter a value from 1 to 255. The default value is 20.
|
MPLS Fast Switch Trigger Range area
|
Min
|
Enter the minimum MPLS fast switchover value.
|
Max
|
Enter the maximum MPLS fast switchover value.
|
13.9.2.5.2 BFD Template
The BFD Template table lists the BFD templates. From the BFD Template tab, you can:
•
Create BFD template—To create a BFD template, see How Do I Create a BFD Template?.
•
Edit BFD template—To edit a BFD template, see How Do I Edit a BFD Template?.
•
Delete BFD template—To delete a BFD template, see How Do I Delete a BFD Template?.
The following table describes the BFD Template table fields.
Table 13-22 Field Descriptions for the BFD Template Property
Field
|
Description
|
Name
|
Displays the name of the BFD template.
|
Single Hop
|
Displays whether single hop is enabled or disabled.
|
Unit
|
Displays the unit of time: Milliseconds or Microseconds.
|
Min_Tx Interval
|
Displays the transmit interval between BFD packets.
|
Min_Rx Interval
|
Displays the receive interval between BFD packets.
|
Multiplier
|
Displays the number of consecutive BFD control packets that must be missed before BFD declares that a peer is unavailable.
|
13.9.2.6 Pseudowire Class
The Pseudowire Class property allows you to perform the following operations:
•
Create pseudowire class—To create a pseudowire class, see How Do I Create a Pseudowire Class?.
•
Edit pseudowire class—To edit a pseudowire class, see How Do I Modify a Pseudowire Class?.
•
Delete pseudowire class—Select the pseudowire class from the Pseudowire Class table and click the Delete a Pseudowire Class button.
The following table describes the Pseudowire Class table fields.
Table 13-23 Field Descriptions for the Pseudowire Class Table
Field
|
Description
|
Name
|
Displays the name of the pseudowire class.
|
Encapsulation
|
Displays the encapsulation type.
|
Protocol
|
Displays the protocol details.
|
Interwork
|
Displays the type of interworking.
|
Ctrl Word
|
Displays whether Ctrl Word is enabled or disabled.
|
Preferred Path
|
Displays whether preferred path is enabled or disabled.
|
Fallback Disable
|
Displays whether fallback is disabled.
|
Tunnel Type
|
Displays the tunnel type.
|
Tunnel Number
|
Displays the tunnel number.
|
Enable Sequencing
|
Displays whether sequencing is enabled.
|
Sequencing Mode
|
Displays the sequencing mode if sequencing is enabled.
|
Resync Timer
|
Displays the resync timer.
|
Static OAM Enable
|
Displays whether static OAM is enabled.
|
OAM Class
|
Displays the OAM class.
|
BFDoVCCV Enable
|
Displays whether BFD over VCCV is enabled.
|
BFD
|
Displays the BFD template details.
|
AC Status
|
Displays whether AC status signaling is enabled or disabled.
|
Master Redundancy
|
Displays whether master redundancy is enabled or disabled.
|
13.9.2.7 QoS
The QoS property has three tabs:
•
Class Map—Displays the name of the class maps provisioned using the Provisioning PT System QoS wizard.
•
Policy Map—Displays the name of the policy maps provisioned using the Provisioning PT System QoS wizard.
•
Table Map—Displays the name of the table maps provisioned using the Provisioning PT System QoS wizard.
13.9.2.8 Service Alarm
Service alarms apply to three different levels:
•
Port
•
Packet Transport System (PTS)
•
Channel group
Service alarms are reported in the Prime Optical alarm browser as a sum of Layer 2 service alarms. From the Service Alarm property, execute a specific query on an NE to find out which service is impacted by these alarms.
Note
For the list of service alarms, see Table 13-27.
For information on the Service Alarm property tabs, see:
•
How Do I Retrieve Alarms by Service Type?.
•
How Do I Retrieve Affected Layer 2 Services by Alarm Type?.
13.9.2.8.1 How Do I Retrieve Alarms by Service Type?
The Retrieve Alarms on Service tab allows you to retrieve the Layer 2 alarms by service type.
To retrieve the Layer 2 alarms by service type on the PT System:
Step 1
Click the Packet Transport System radio button.
Step 2
From the Service Type drop-down list, select the service type (Carrier Ethernet, Pseudowire, or MPLS TP tunnel).
Step 3
In the Service ID field, enter the service ID.
Step 4
Click Show. The Layer 2 alarms by service type on the PT System are displayed in the table.
Step 5
(Optional) Click Reset to reset the Service Type drop-down list and the Service ID field.
Step 6
(Optional) Click Clear Table to clear the results and run a new query.
To retrieve the Layer 2 alarms by service type on a specific port:
Step 1
Click the Port radio button.
Step 2
From the Slot drop-down list, select the slot.
Step 3
From the Port drop-down list, select the port.
Step 4
From the Service Type drop-down list, select the service type (Carrier Ethernet, Pseudowire, or MPLS TP tunnel).
Step 5
In the Service ID field, enter the service ID.
Step 6
Click Show. The Layer 2 alarms by service type on the selected port are displayed in the table.
Step 7
(Optional) Click Reset to reset the Service Type drop-down list and the Service ID field.
Step 8
(Optional) Click Clear Table to clear the results and run a new query.
To retrieve the Layer 2 alarms by service type on a channel group:
Step 1
Click the Channel Group radio button.
Step 2
From the Channel Group drop-down list, select the channel group.
Step 3
From the Service Type drop-down list, select the service type (Carrier Ethernet, Pseudowire, or MPLS TP tunnel).
Step 4
In the Service ID field, enter the service ID.
Step 5
Click Show. The Layer 2 alarms by service type on the selected channel group are displayed in the table.
Step 6
(Optional) Click Reset to reset the Service Type drop-down list and the Service ID field.
Step 7
(Optional) Click Clear Table to clear the results and run a new query.
13.9.2.8.2 How Do I Retrieve Affected Layer 2 Services by Alarm Type?
The Retrieve Alarm-Affected Services tab allows you to retrieve the affected Layer 2 services by alarm type.
•
To retrieve the affected Layer 2 services by alarm type on the PT System, go to Step 1.
•
To retrieve the affected Layer 2 services by alarm type on a specific port, go to Step 2.
•
To retrieve the affected Layer 2 services by alarm type on a channel group, go to Step 3.
Step 1
To retrieve the affected Layer 2 services by alarm type on the PT System:
a.
Click the Packet Transport System radio button.
b.
From the Service Type drop-down list, select the service type (Carrier Ethernet, Pseudowire, or MPLS TP tunnel).
c.
From the Alarm Type drop-down list, select the alarm type. See Table 13-28 for the list of alarm types.
d.
Click Show. The affected Layer 2 services by alarm type on the PT System are displayed in the table.
e.
(Optional) Click Reset to reset the Service Type and Alarm Type drop-down lists.
Step 2
To retrieve the affected Layer 2 services by alarm type on a specific port:
a.
Click the Port radio button.
b.
From the Slot drop-down list, select the slot.
c.
From the Port drop-down list, select the port.
d.
From the Service Type drop-down list, select the service type (Carrier Ethernet, Pseudowire, or MPLS TP tunnel).
e.
From the Alarm Type drop-down list, select the alarm type. See Table 13-28 for the list of alarm types.
f.
Click Show. The affected Layer 2 services by alarm type on the selected port are displayed in the table.
g.
(Optional) Click Reset to reset the Service Type and Alarm Type drop-down lists.
Step 3
To retrieve the affected Layer 2 services by alarm type on a channel group:
a.
Click the Channel Group radio button.
b.
From the Channel Group drop-down list, select the channel group.
c.
From the Service Type drop-down list, select the service type (Carrier Ethernet, Pseudowire, or MPLS TP tunnel).
d.
From the Alarm Type drop-down list, select the alarm type. See Table 13-28 for the list of alarm types.
e.
Click Show. The affected Layer 2 services by alarm type on the selected channel group are displayed in the table.
f.
(Optional) Click Reset to reset the Service Type and Alarm Type drop-down lists.
Step 4
(Optional) Click Service Table to cross-launch the service table from the Retrieve Alarm-Affected Services tab. For example, if you select Pseudowire as the service type, the Pseudowire Service table opens.
Step 5
(Optional) Click the Filter button to filter the affected Layer 2 services displayed in the table. Filter by:
•
Service ID
•
Name
•
Description
Step 6
(Optional) Click Clear Table to clear the results and run a new query.
13.9.2.9 Timing
A separate external TDM circuit is required to provide synchronized timing to multiple remote NEs for packet transport networks such as the CPT System. The Synchronous Ethernet (SycnE) feature addresses this requirement by providing effective timing to the remote NEs through a packet network without using an external circuit for timing.
The Timing property allows you to configure SyncE ports.
The following table describes the Timing property table fields.
Table 13-24 Field Descriptions for the Timing Property Table
Field
|
Description
|
Card
|
Display only. Displays the card number and slot number.
|
Port
|
Display only. Displays the port number (n-n) and rate.
|
ProvidesSync
|
Display only. Selects the port automatically after the port is used as a clock source.
|
SyncMsgIn
|
Sets the EnableSync card parameter. Enables synchronization status messages, which allow the node to choose the best timing source.
|
Admin SSM In
|
Overrides the synchronization status message (SSM) and the synchronization traceability unknown (STU) value. If the node does not receive an SSM signal, it defaults to STU. The options are:
• PRS—Primary reference source (Stratum 1)
• ST2—Stratum 2
• TNC—Transit node clock
• ST3E—Stratum 3E
• ST3—Stratum 3
• SMC-SONET minimum clock
• ST4—Stratum 4
• DUS—Do not use for timing synchronization
• RES—Reserved; quality level set by the user
|
Send DoNotUse
|
When checked, sends a DUS message as the QL value.
|
ESMC Enable
|
Check the check box on the port where you want to enable SyncE. You can select the clock source among the Ethernet Synchronization Message Channel (ESMC) enabled ports. To select the clock source among the OTN ports, do not check the check box.
|
13.9.2.10 How Do I Create Channel Groups?
For a description of LACP, see What Is LACP?.
Create channel groups from the PT System using the Channel Group Creation wizard.
Step 1
Select an ONS 15454 NE and open the NE Explorer (see NE Explorer for information on opening an NE Explorer).
Step 2
In the NE Explorer tree, click PT System to open the PT System property sheet.
Step 3
Go to the Provisioning area and select Channel Groups. The Channel Groups page opens.
Step 4
Click the Create a Channel Group button. The Channel Group Creation wizard opens.
Step 5
In the Identification area, do the following:
a.
In the Name field, enter the name of the channel group.
b.
From the ID drop-down list, select an ID for this channel group. Valid values are from 1 to 128.
c.
In the MTU field, enter the MTU value.
d.
Check the Fast Switchover check box to enable fast switchover for this channel group.
Step 6
In the Ports area, do the following:
a.
From the Standalone list, choose the ports that will belong to this channel group and click the right arrow button to move the selected ports to the Bundled list.
b.
Displays the selected ports. To change the port selection, use the arrow keys, as appropriate.
Step 7
In the LACP area, do the following:
a.
Check the LACP check box to configure the channel group using LACP (see How Do I Configure Channel Group Using LACP? for information on configuring the channel group using LACP).
b.
In the Minimum Bundle field, enter the minimum number of ports that must be active for the channel group to be active. The default value is 1.
c.
In the Maximum Bundle field, enter the maximum number of ports to bundle in a channel group. The default value is 8.
Step 8
In the Layer 2 Action area, use the Layer 2 Action Configuration wizard to configure the actions for each Layer 2 protocol (see How Do I Configure Actions for Each Layer 2 Protocol? for information on configuring actions for each Layer 2 protocol).
Step 9
Click OK. The channel group details appear in a table in the Provisioning > Channel Groups page of the PT System property sheet.
13.9.2.10.1 How Do I Configure Channel Group Using LACP?
For the description of LACP, see What Is LACP?.
Configure channel groups to use LACP using the LACP Configuration dialog box.
Step 1
Complete Step 1 through Step 6 in How Do I Create Channel Groups?.
Step 2
Check the LACP check box. The Configure Port's LACP link becomes active.
Step 3
Click the Configure Port's LACP link. The LACP Configuration dialog box opens.
Step 4
Port—Display only. The Port column lists all the ports that are added to the channel group.
Step 5
Choose Active or Passive for each port from the LACP Config drop-down list.
Step 6
Enter the LACP priority in the Priority field for each port. Valid values are from 1 to 32768. The default value is 32768.
Step 7
Click OK. The channel group is configured to use LACP.
13.9.2.10.2 How Do I Configure Actions for Each Layer 2 Protocol?
Use the Layer 2 Action Configuration dialog box to configure actions for the following Layer 2 protocols:
•
Link Aggregation Control Protocol (LACP)
•
Port Aggregation Protocol (PAgP)
•
Dynamic Trunking Protocol (DTP)
•
IEEE 802.1x
•
Cisco Discovery Protocol (CDP)
•
VLAN Trunking Protocol (VTP)
•
Spanning Tree Protocol (STP)
Note
You can also configure actions for each Layer 2 protocol from the Layer 2 Protocols tab in the Channel Groups property.
Step 1
Complete Step 1 through Step 7 in How Do I Create Channel Groups?.
Step 2
In the Layer 2 Action area, click the Configure Layer 2 Action link. The Layer 2 Action Configuration dialog box opens.
Step 3
The Protocol column displays the protocols. From the Action drop-down list, select an action: Drop, Forward, and Peer.
For example, if you to want choose Drop as the action for LACP, click the action row corresponding to LACP to enable the drop-down list. From the drop-down list, select Drop.
Step 4
Click OK. The selected action is configured for the Layer 2 protocol.
13.9.2.10.3 How Do I Configure Manual Load Balancing?
Configure manual load balancing using the Manual Load Balancing dialog box.
Step 1
Select an ONS 15454 NE and open the NE Explorer (see NE Explorer for information on opening an NE Explorer).
Step 2
In the NE Explorer tree, click PT System to open the PT System property sheet.
Step 3
Go to the Provisioning area and select Channel Groups. The Channel Groups page opens.
Step 4
From the Channel Group table, select a channel group. The Manual Load Balancing table is updated with the load balancing details.
Step 5
In the Manual Load Balancing area of the Channel Groups page, click the Create a Load Balance Configuration button. The Manual Load Balancing dialog box opens.
Step 6
In the Primary Load-Balanced Link area, from the Primary Port drop-down list, select the port.
Step 7
In the Backup Load-Balanced Link area, do the following:
•
Available Ports—Lists the available ports. Select the required ports and click the right arrow button to move the ports to the Selected Ports list.
•
Selected Ports—Lists the selected ports. To deselect any of the ports, select the port and click the left arrow button.
Step 8
Click OK. Manual load balancing is configured and the details appear in the Manual Load Balancing table.
13.9.2.10.4 How Do I Modify Manual Load Balancing Configuration?
Modify the manual load balancing configuration using the Manual Load Balancing dialog box.
Step 1
Select an ONS 15454 NE and open the NE Explorer (see NE Explorer for information on opening an NE Explorer).
Step 2
In the NE Explorer tree, click PT System to open the PT System property sheet.
Step 3
Go to the Provisioning area and select Channel Groups. The Channel Groups page opens.
Step 4
From the Channel Group table, select a channel group.
Step 5
In the Manual Load Balancing table, select the manual load balancing configuration that you want to modify.
Step 6
Click the Edit a Load Balance Configuration button. The Manual Load Balancing dialog box opens.
Step 7
Display only. In the Primary Load-Balanced Link area, the Primary Port field displays the port number.
Step 8
In the Backup Load-Balanced Link area, modify the following:
•
Available Ports—Lists the available ports. Select the required ports and click the right arrow button to move the ports to the Selected Ports list.
•
Selected Ports—Lists the selected ports. To deselect any of the ports, select the port and click the left arrow button.
Step 9
Click OK. The manual load balancing configuration is modified and the updated details appear in the Manual Load Balancing table.
13.9.2.11 How Do I Modify Channel Groups?
For the description of LACP, see What Is LACP?.
Modify a channel group from the PT System using the Edit Channel Group wizard.
Note
Some of the fields in the Edit Channel Group wizard are not editable.
Step 1
Select an ONS 15454 NE and open the NE Explorer (see NE Explorer for information on opening an NE Explorer).
Step 2
In the NE Explorer tree, click PT System to open the PT System property sheet.
Step 3
Go to the Provisioning area and select Channel Groups. The Channel Groups page opens.
Step 4
From the Channel Groups table, select the channel group that you want to edit and click the Edit a Channel Group button. The Edit Channel Group wizard opens.
Step 5
In the Identification area, view or modify the following fields:
a.
Name—Displays the name of the channel group. To modify the name:
•
Delete the previous entry.
•
In the Name field, enter the new name.
b.
ID—Display only. Displays the channel group ID.
c.
MTU—Displays the MTU value. To modify the MTU value:
•
Delete the previous entry.
•
In the MTU field, enter the new value.
d.
Fast Switchover—Displays whether fast switchover is enabled for this channel group.
•
To disable fast switchover, uncheck the Fast Switchover check box.
•
To enable fast switchover, check the Fast Switchover check box.
Step 6
In the Ports area:
•
Standalone—Displays the list of standalone ports. To modify your previous selection, use the arrow keys, as appropriate.
•
Bundled—Displays the list of bundled ports. To modify the port selection, use the arrow keys, as appropriate.
Step 7
In the LACP area, modify the following:
Note
You can modify the fields in the LACP area only if there are no bundled ports.
a.
LACP—Displays whether LACP is configured.
•
To disable LACP, uncheck the LACP check box.
•
To enable LACP, check the LACP check box and configure the channel group to use LACP (see How Do I Configure Channel Group Using LACP?).
b.
Minimum Bundle—Displays the minimum bundle value. To modify the value:
•
Delete the previous entry.
•
In the Minimum Bundle field, enter the new value. The default value is 1.
c.
Maximum Bundle—Displays the maximum bundle value. To modify the value:
•
Delete the previous entry.
•
In the Maximum Bundle field, enter the new value. The default value is 8.
Step 8
In the Layer 2 Action area, use the Layer 2 Action Configuration wizard to modify the actions for each Layer 2 protocol (see How Do I Configure Actions for Each Layer 2 Protocol?).
Step 9
Click OK. The updated details appear in the Channel Groups table in the Provisioning > Channel Groups page of the PT System property sheet.
13.9.2.12 How Do I Create a Pseudowire Class?
Create a pseudowire class from the PT System using the Create Pseudowire Class wizard.
Step 1
Select an ONS 15454 NE and open the NE Explorer (see NE Explorer for information on opening an NE Explorer).
Step 2
In the NE Explorer tree, click PT System to open the PT System property sheet.
Step 3
Go to the Provisioning area and select Pseudowire Class. The Pseudowire Class page opens.
Step 4
Click the Create a Pseudowire Class button. The Create Pseudowire Class wizard opens.
Step 5
In the Identification area, perform actions where allowed:
a.
In the Name field, enter the name of the pseudowire class.
b.
Encapsulation—Display only. The encapsulation type for tunneling Layer 2 traffic over a pseudowire is set to MPLS and cannot be changed.
c.
Interworking—The Interworking option enables the translation between the different Layer 2 encapsulations. From the Interworking drop-down list, select VLAN or Ethernet.
d.
Choose LDP or None to specify the signaling protocol to be used to manage the pseudowires created from this pseudowire class.
e.
Check the Control Word check box to enable the control word in a dynamic pseudowire connection.
f.
Check the Master Redundancy check box to place the pseudowire redundancy group on this node in master mode.
Step 6
In the Preferred Path area, specify the MPLS-TP or MPLS-TE tunnel path that must be used by the pseudowire. Do the following:
a.
Check the Enable check box to enable the preferred path.
b.
Choose TP or TE as the tunnel type for the preferred path.
c.
In the Tunnel ID field, enter the tunnel ID.
d.
Check the Disable Fallback check box to disable the router from using the default path when the preferred path is unreachable.
Step 7
In the Sequencing area, specify the direction in which the sequencing of packets in a pseudowire must be enabled. Do the following:
a.
Check the Enable check box to enable sequencing.
b.
From the Sequencing drop-down list, select the direction. The options are Transmit, Receive, and Both.
•
Transmit—Updates the sequence number field in the headers of packets sent over the pseudowire according to the data encapsulation method that is used.
•
Receive—Keeps the sequence number field in the headers of packets received over the pseudowire. The packets that are not received in sequence are dropped.
•
Both—Enables both the transmit and receive options.
c.
The Resync field is optional and is enabled only if you chose LDP as the protocol in the Identification area. In the Resync field, enter the resync value.
Step 8
In the BFDoVCCV area, enable Bidirectional Forwarding Detection (BFD) over virtual circuit connection verification (VCCV) for a pseudowire class. Do the following:
a.
Check the Enable check box to enable BFD over VCCV.
b.
From the BFD Template drop-down list, choose a BFD template.
c.
Check the AC Status Signalling check box to enable end-to-end attachment circuit status code notification using BFDoVCCV.
Step 9
In the OAM Status area, do the following:
a.
Check the Enable check box to enable static OAM.
b.
From the OAM Class drop-down list, select a static OAM class.
Step 10
Click OK. The pseudowire class is created and appears in the Pseudowire Class table in the Provisioning > Pseudowire Class page of the PT System property sheet.
13.9.2.13 How Do I Modify a Pseudowire Class?
Modify a pseudowire class from the PT System using the Edit Pseudowire Class wizard.
Step 1
Select an ONS 15454 NE and open the NE Explorer (see NE Explorer for information on opening an NE Explorer).
Step 2
In the NE Explorer tree, click PT System to open the PT System property sheet.
Step 3
Go to the Provisioning area and select Pseudowire Class. The Pseudowire Class page opens.
Step 4
Select the pseudowire class that you want to edit and click the Edit a Pseudowire Class button. The Edit Pseudowire Class wizard opens.
Step 5
In the Identification area, do the following:
Note
The Name field and the Encapsulation field are not editable.
•
From the Interworking drop-down list, select VLAN or Ethernet to enable the translation between the different Layer 2 encapsulations.
•
Choose LDP or None to specify the signaling protocol to be used to manage the pseudowires created from this pseudowire class.
•
Check the Control Word check box to enable the control word in a dynamic pseudowire connection.
•
Check the Master Redundancy check box to place the pseudowire redundancy group on this node in master mode.
Step 6
In the Preferred Path area, specify the MPLS-TP or MPLS-TE tunnel path that must be used by the pseudowire. You can make the following modifications:
•
Check the Enable check box to enable the preferred path.
•
Choose TP or TE as the tunnel type for the preferred path.
•
In the Tunnel ID field, enter the tunnel ID.
•
Check the Disable Fallback check box to disable the router from using the default path when the preferred path is unreachable.
Step 7
In the Sequencing area, specify the direction in which the sequencing of packets in a pseudowire must be enabled. You can make the following modifications:
•
Check the Enable check box to enable sequencing.
•
From the Sequencing drop-down list, select the direction. The options are Transmit, Receive, and Both.
–
Transmit—Updates the sequence number field in the headers of packets sent over the pseudowire according to the data encapsulation method that is used.
–
Receive—Keeps the sequence number field in the headers of packets received over the pseudowire. The packets that are not received in sequence are dropped.
–
Both—Enables both the transmit and receive options.
•
The Resync field is optional and is enabled only if you chose LDP as the protocol in the Identification area. In the Resync field, enter the resync value.
Step 8
In the BFDoVCCV area, enable BFD over VCCV for a pseudowire class. You can make the following modifications:
•
Check the Enable check box to enable BFD over VCCV.
•
From the BFD Template drop-down list, choose a BFD template.
•
Check the AC Status Signalling check box to enable end-to-end attachment circuit status code notification using BFDoVCCV.
Step 9
In the OAM Status area, you can make the following modifications:
•
Check the Enable check box to enable static OAM.
•
From the OAM Class drop-down list, select a static OAM class.
Step 10
Click OK. The updated details are displayed in the Pseudowire Class table in the Provisioning > Pseudowire Class page of the PT System property sheet.
13.9.2.14 How Do I Create a BFD Template?
To create a BFD template:
Step 1
Select a CPT-200 or CPT-600 NE and open the NE Explorer (see NE Explorer for information on opening an NE Explorer).
Step 2
In the NE Explorer tree, click PT System to open the PT System property sheet.
Step 3
Go to the Provisioning area and select MPLS-TP. The MPLS-TP page opens.
Step 4
Go to the BFD Template tab.
Step 5
Click the Create a BFD Template button. The Create BFD Template dialog box opens.
Step 6
In the Name field, enter the BFD template name.
Note
The Single Hop check box is checked and cannot be changed.
Step 7
In the Multiplier field, enter the number of consecutive BFD control packets that must be missed before BFD declares that a peer is unavailable.
Step 8
In the Tx field, use the arrow buttons and select the transmit interval between BFD packets.
Step 9
In the Rx field, use the arrow buttons and select the receive interval between BFD packets.
Step 10
From the Time Unit drop-down list, select the time unit. The options are Milliseconds or Microseconds.
Step 11
Click OK. The BFD template is created.
13.9.2.15 How Do I Edit a BFD Template?
To edit a BFD template:
Step 1
Select a CPT-200 or CPT-600 NE and open the NE Explorer (see NE Explorer for information on opening an NE Explorer).
Step 2
In the NE Explorer tree, click PT System to open the PT System property sheet.
Step 3
Go to the Provisioning area and select MPLS-TP. The MPLS-TP page opens.
Step 4
Go to the BFD Template tab.
Step 5
Click the Edit a BFD Template button. The Edit BFD Template dialog box opens.
Step 6
View or modify the following fields, as appropriate:
•
Name—Display only. Displays the BFD template name.
•
Single Hop—Display only. The Single Hop check box is checked.
•
Multiplier—Displays the number of consecutive BFD control packets that must be missed before BFD declares that a peer is unavailable. To modify the value, use the arrow buttons.
•
Tx—Displays the transmit interval between BFD packets. To modify the value, use the arrow buttons.
•
Rx—Displays the receive interval between BFD packets. To modify the value, use the arrow buttons.
•
Time Unit—Displays the time unit. To modify the time unit, select the time unit from the Time Unit drop-down list.
Step 7
Click OK. The BFD template is modified.
13.9.2.16 How Do I Delete a BFD Template?
To delete a BFD template:
Step 1
Select a CPT-200 or CPT-600 NE and open the NE Explorer (see NE Explorer for information on opening an NE Explorer).
Step 2
In the NE Explorer tree, click PT System to open the PT System property sheet.
Step 3
Go to the Provisioning area and select MPLS-TP. The MPLS-TP page opens.
Step 4
Go to the BFD Template tab.
Step 5
From the BFD Template table, select the template that to delete.
Step 6
Click the Delete a BFD Template button.
Step 7
Click OK in the confirmation message box. The BFD template is deleted.
13.9.3 Understanding the CPT System Alarms
In Prime Optical 9.6.3, new alarms have been introduced for the CPT System. This section includes:
•
Equipment Alarms
•
Satellite Alarms
•
Port Alarms
•
Service Alarms
13.9.3.1 Equipment Alarms
Table 13-25 describes the equipment alarms.
Table 13-25 Equipment Alarms
Alarm
|
Description
|
Logical Object
|
CUTOVER
|
The Planned Switch Over alarm is raised when a planned switchover of the PTF_10GE_4 card occurs.
|
EQPT
|
RESOURCES_LOW
|
The Running Low on Resources alarm is raised if the resource memory is very low or if more resources cannot be configured.
|
EQPT
|
RESOURCES_OVER
|
The No More Resources Available alarm is raised if the resource memory is used completely or if configuring of resources is not possible.
|
EQPT
|
13.9.3.2 Satellite Alarms
Table 13-26 lists and describes the satellite alarms. The satellite alarms listed in the following table are raised when satellite communication is impacted between PTF_10GE_4, PT_10GE_4, and PTSA_GE.
Table 13-26 Satellite Alarms
Alarm
|
Description
|
SAT_DISCOVERY_FAIL
|
Satellite panel discovery failure.
|
SAT_ACT_LINK_FAIL
|
Satellite panel active link failure.
|
SAT_COMM_FAIL
|
Satellite panel communication failure.
|
SAT_IMPROPER_CONFIG
|
Satellite panel improper configuration.
|
SAT_FAN_MEA
|
Satellite panel fan mismatch of equipment and attributes.
|
SAT_FAN_FAIL
|
Satellite panel fan failure.
|
SAT_FAN_DEGRADE
|
Satellite panel partial fan failure.
|
SAT_FAN_MFGMEM
|
Satellite panel fan manufacturing data memory (EEPROM) failure.
|
SAT_FAN_MISSING
|
Satellite panel fan unit is missing.
|
SAT_IHITEMP
|
Satellite panel industrial high temperature.
|
SAT_HITEMP
|
Satellite panel high temperature.
|
SAT_BAT_FAIL
|
Satellite panel battery failure.
|
SAT_BAT_FAIL_A
|
Satellite panel battery A failure.
|
SAT_BAT_FAIL_B
|
Satellite panel battery B failure.
|
13.9.3.3 Port Alarms
Table 13-27 describes the port alarms.
Table 13-27 Port Alarms
Alarm Name/Condition
|
PTF_10GE_4 Client
|
Required on PTF_10GE_4 Trunk Ports
|
Required on PT_10GE_4 Client
|
Required on PTSA_GE 1G Port
|
Required on PTSA_GE Client
|
MAC_MOVE—MAC address is relearned on a different port in the same bridge domain
|
Yes
|
Yes
|
Yes
|
Yes
|
—
|
SAT_ACTIVE_LINK_FAIL—Satellite panel active link failure
|
Yes
|
Yes
|
Yes
|
—
|
—
|
Legacy Alarms on PTF_10GE_4 and PT_10GE_4
|
SYNCLOSS
|
Yes
|
Yes
|
Yes
|
Yes
|
Yes
|
SIGLOSS
|
Yes
|
Yes
|
Yes
|
Yes
|
Yes
|
LOCAL-FAULT
|
Yes
|
Yes
|
Yes
|
No
|
Yes
|
REMOTE-FAULT
|
Yes
|
Yes
|
Yes
|
No
|
Yes
|
SF
|
No
|
Yes
|
No
|
No
|
No
|
SD
|
No
|
Yes
|
No
|
No
|
No
|
FEC-MISM
|
No
|
Yes
|
No
|
No
|
No
|
UNC-WORD
|
No
|
Yes
|
No
|
No
|
No
|
GCC-EOC
|
No
|
Yes
|
No
|
No
|
No
|
HELLO
|
—
|
Yes
|
—
|
—
|
—
|
ISIS-ADJ-FAIL
|
No
|
No
|
No
|
No
|
No
|
PROV-MISMATCH
|
Yes
|
Yes
|
Yes
|
Yes
|
Yes
|
TRAIL-SIGNAL
|
—
|
—
|
—
|
—
|
—
|
LMP-SD
|
No
|
No
|
No
|
No
|
No
|
LMP-SF
|
No
|
No
|
No
|
No
|
No
|
LMP-UNALLOC
|
No
|
No
|
No
|
No
|
No
|
LMP-FAIL
|
No
|
No
|
No
|
No
|
No
|
UNC-WORD
|
No
|
Yes
|
No
|
No
|
No
|
LOF
|
Yes
|
Yes
|
Yes
|
Yes
|
Yes
|
LOS
|
Yes
|
Yes
|
Yes
|
Yes
|
Yes
|
OUT-OF-SYNC
|
Yes
|
Yes
|
Yes
|
Yes
|
Yes
|
OTUK-IAE
|
No
|
Yes
|
No
|
No
|
No
|
OTUK-SD
|
No
|
Yes
|
No
|
No
|
No
|
OTUK-SF
|
No
|
Yes
|
No
|
No
|
No
|
OTUK-TIM
|
No
|
Yes
|
No
|
No
|
No
|
LOM
|
No
|
Yes
|
No
|
No
|
No
|
OTUK-LOF
|
No
|
Yes
|
No
|
No
|
No
|
FEC-MISM
|
No
|
Yes
|
No
|
No
|
No
|
OTUK-AIS
|
No
|
Yes
|
No
|
No
|
No
|
ODUK-BDI-PM
|
—
|
Yes
|
—
|
—
|
—
|
OTUK-BDI
|
—
|
Yes
|
—
|
—
|
—
|
ODUK-SD-PM
|
—
|
Yes
|
—
|
—
|
—
|
ODUK-SF-PM
|
—
|
Yes
|
—
|
—
|
—
|
ODUK-TIM-PM
|
—
|
Yes
|
—
|
—
|
—
|
ODUK-AIS-PM
|
—
|
Yes
|
—
|
—
|
—
|
ODUK-LCK-PM
|
—
|
Yes
|
—
|
—
|
—
|
ODUK-OCI-PM
|
—
|
Yes
|
—
|
—
|
—
|
HI-RXPOWER
|
Yes
|
Yes
|
Yes
|
Yes
|
Yes
|
LO-RXPOWER
|
Yes
|
Yes
|
Yes
|
Yes
|
Yes
|
HI-TXPOWER
|
Yes
|
Yes
|
Yes
|
Yes
|
Yes
|
LO-TXPOWER
|
Yes
|
Yes
|
Yes
|
Yes
|
Yes
|
HI-LASERBIAS
|
Yes
|
Yes
|
Yes
|
Yes
|
Yes
|
LO-LASERBIAS
|
Yes
|
Yes
|
Yes
|
Yes
|
Yes
|
HI-LASERTEMP
|
Yes
|
Yes
|
Yes
|
Yes
|
Yes
|
LO-LASERTEMP
|
Yes
|
Yes
|
Yes
|
Yes
|
Yes
|
HI-PELTIER
|
—
|
—
|
—
|
—
|
—
|
LO-PELTIER
|
—
|
—
|
—
|
—
|
—
|
HI-XCVRVOLT
|
—
|
—
|
—
|
—
|
—
|
LO-XCVRVOLT
|
—
|
—
|
—
|
—
|
—
|
WVL-MISMATCH
|
No
|
Yes
|
No
|
No
|
No
|
PORT-COMM-FAI
|
—
|
—
|
—
|
—
|
—
|
DSP-FAIL
|
—
|
—
|
—
|
—
|
—
|
UT-COMM-FAIL
|
—
|
—
|
—
|
—
|
—
|
UT-FAIL
|
—
|
—
|
—
|
—
|
—
|
LASER-OFF-WVL
|
—
|
—
|
—
|
—
|
—
|
TX-OFF-NON-CI
|
Yes
|
Yes
|
Yes
|
Yes
|
Yes
|
PORT-CODE-MIS
|
—
|
—
|
—
|
—
|
—
|
PORT-COMM-FAI
|
—
|
—
|
—
|
—
|
—
|
PORT-MISMATCH
|
—
|
—
|
—
|
—
|
—
|
PORT-MISSING
|
—
|
—
|
—
|
—
|
—
|
LPBKTERMINAL
|
Yes
|
Yes
|
Yes
|
Yes
|
Yes
|
LPBKFACILITY
|
Yes
|
Yes
|
Yes
|
Yes
|
Yes
|
HELLO
|
—
|
—
|
—
|
—
|
—
|
ISIS-ADJ-FAIL
|
—
|
—
|
—
|
—
|
—
|
AS-CMD
|
—
|
—
|
—
|
—
|
—
|
AS-MT
|
—
|
—
|
—
|
—
|
—
|
NEIGHBOR-ADJACENCY-FAILURE
|
Yes
|
Yes
|
Yes
|
Yes
|
No
|
LINK-FLAPPING
|
Yes
|
Yes
|
Yes
|
Yes
|
No
|
MIS-CONFIGURED-SEGMENT
|
Yes
|
Yes
|
Yes
|
Yes
|
No
|
VLB-FAILED
|
Yes
|
Yes
|
Yes
|
Yes
|
No
|
VLB-DEACTIVATED
|
Yes
|
Yes
|
Yes
|
Yes
|
No
|
PRIMARY-EDGE-PORT-ELECTED
|
Yes
|
Yes
|
Yes
|
Yes
|
No
|
SECONDARY-EDGE-PORT-ELECTED
|
Yes
|
Yes
|
Yes
|
Yes
|
No
|
SEGMENT-HEALED
|
Yes
|
Yes
|
Yes
|
Yes
|
No
|
STNC-GENERATED
|
Yes
|
Yes
|
Yes
|
Yes
|
No
|
VLB-ACTIVATED
|
Yes
|
Yes
|
Yes
|
Yes
|
No
|
VLB-TRIGGER-DELAY-ACTIVE
|
Yes
|
Yes
|
Yes
|
Yes
|
No
|
13.9.3.4 Service Alarms
Table 13-28 describes the service alarms.
Table 13-28 Service Alarms
Alarms
|
Description
|
Level
|
PW Alarms
|
WKG_PW_CP_DOWN
|
Working pseudowire control plane down alarm. This alarm is raised on the port if the working pseudowire control plane is down.
|
Port/PTS_CHANNEL_GROUP
|
PRT_PW_CP_DOWN
|
Protect pseudowire control plane down alarm. This alarm is raised on the port if the protect pseudowire control plane is down.
|
Port/PTS_CHANNEL_GROUP
|
WKG_PW_CC_DOWN
|
Working pseudowire continuity check down alarm. This alarm is raised on the port if the working pseudowire continuity check is down.
|
Port/PTS_CHANNEL_GROUP
|
PRT_PW_CC_DOWN
|
Protect pseudowire continuity check down alarm. This alarm is raised on the port if the protect pseudowire continuity check is down.
|
Port/PTS_CHANNEL_GROUP
|
PW_ WKSWPR
|
Pseudowire traffic switched to protection alarm. This alarm is raised on the port when the pseudowire traffic is switched from the working path to the protected path.
|
Port/PTS_CHANNEL_GROUP
|
WKG_PW_LOC_AC_TX_FLT
|
Working pseudowire local AC Tx port fault alarm. This alarm is raised when a working pseudowire local AC Tx port fault is detected.
|
Port/PTS_CHANNEL_GROUP
|
PRT_PW_LOC_AC_TX_FLT
|
Protect pseudowire local AC Tx port fault alarm. This alarm is raised when a protect pseudowire local AC Tx port fault is detected.
|
Port/PTS_CHANNEL_GROUP
|
WKG_PW_LOC_AC_RX_FLT
|
Working pseudowire local AC Rx port fault alarm. This alarm is raised when a working pseudowire local AC Rx port fault is detected.
|
Port/PTS_CHANNEL_GROUP
|
PRT_PW_LOC_AC_RX_FLT
|
Protect pseudowire local AC Rx port fault alarm. This alarm is raised when a protect pseudowire local AC Rx port fault is detected.
|
Port/PTS_CHANNEL_GROUP
|
WKG_PW_REM_AC_TX_FLT
|
Working pseudowire remote AC Tx port fault alarm. This alarm is raised when a working pseudowire remote AC Tx port fault is detected.
|
Port/PTS_CHANNEL_GROUP
|
PRT_PW_REM_AC_TX_FLT
|
Protect pseudowire remote AC Tx port fault alarm. This alarm is raised when a protect pseudowire remote AC Tx port fault is detected.
|
Port/PTS_CHANNEL_GROUP
|
WKG_PW_REM_AC_RX_FLT
|
Working pseudowire remote AC Rx port fault alarm. This alarm is raised when a working pseudowire remote AC Rx port fault is detected.
|
Port/PTS_CHANNEL_GROUP
|
PRT_PW_REM_AC_RX_FLT
|
Protect pseudowire remote AC Rx port fault alarm. This alarm is raised when the protect pseudowire remote AC Rx port fault is detected.
|
Port/PTS_CHANNEL_GROUP
|
S_PE Alarms
|
WKG_LOC_PW_NOT_FWD
|
Working local pseudowire not forwarding alarm. This alarm is raised when the local working pseudowire is not forwarding traffic.
|
PTS**
|
PRT_LOC_PW_NOT_FWD
|
Protected local pseudowire not forwarding alarm. This alarm is raised when the local protect pseudowire is not forwarding traffic.
|
PTS**
|
WKG_REM_PW_NOT_FWD
|
Working remote pseudowire not forwarding alarm. This alarm is raised when the remote working pseudowire is not forwarding traffic.
|
PTS**
|
PRT_REM_PW_NOT_FWD
|
Protect remote pseudowire not forwarding alarm. This alarm is raised when the remote protect pseudowire is not forwarding the traffic.
|
PTS**
|
MPLS_TP Alarms
|
TP_TUNNEL_DOWN
|
MPLS-TP tunnel down alarm. This alarm is raised when the working or protect LSP is down.
|
PTS**
|
WKG_LSP_DOWN
|
Working LSP down alarm. This alarm is raised on the port if the working LSP is down.
|
Port/PTS_CHANNEL_GROUP
|
PRT_LSP_DOWN
|
Protect LSP down alarm. This alarm is raised on the port if the protect LSP is down.
|
Port/PTS_CHANNEL_GROUP
|
WKG_LSP_AIS
|
Working LSP alarm indication signal. This alarm is raised when the working LSP receives an LSP alarm indication signal.
|
Port/PTS_CHANNEL_GROUP
|
PRT_LSP_AIS
|
Protect LSP alarm indication signal. This alarm is raised when the protect LSP receives an LSP alarm indication signal.
|
Port/PTS_CHANNEL_GROUP
|
WKG_LSP_RDI
|
Working LSP remote defect indication. This alarm is raised when the working LSP receives an LSP remote defect indication.
|
Port/PTS_CHANNEL_GROUP
|
PRT_LSP_RDI
|
Protect LSP remote defect indication. This alarm is raised when the protect LSP receives an LSP remote defect indication.
|
Port/PTS_CHANNEL_GROUP
|
BFD_DOWN
|
BFD down alarm. This alarm is raised when the BFD is not enabled on the port.
|
Port/PTS_CHANNEL_GROUP
|
TP_WKSPWR
|
TP traffic switched to protection alarm. This alarm is raised when the MPSL-TP traffic switches from working pseudowire to protected pseudowire.
|
Port/PTS_CHANNEL_GROUP
|
WKG_TP_LOCKOUT
|
Working TP lockout alarm. This alarm is raised when the lockout request is set to ON for the working MPLS-TP.
|
Port/PTS_CHANNEL_GROUP
|
PRT_TP_LOCKOUT
|
Protect TP lockout alarm. This alarm is raised when the lockout request is set to ON for the protect MPLS-TP.
|
Port/PTS_CHANNEL_GROUP
|
WKG_LSP_LDI
|
Working LSP link defect indication. This alarm is raised when the working LSP receives an LSP link defect indication.
|
Port/PTS_CHANNEL_GROUP
|
PRT_LSP_LDI
|
Protect LSP link defect indication. This alarm is raised when the protect LSP receives an LSP link defect indication.
|
Port/PTS_CHANNEL_GROUP
|
WKG_LSP_LKR
|
Working LSP lock report alarm. This alarm is raised when an interface is administratively shutdown on a working path in an MPLS-TP tunnel.
|
Port/PTS_CHANNEL_GROUP
|
PRT_LSP_LKR
|
Protect LSP lock report alarm. This alarm is raised when an interface is administratively locked and a lockout request (LKR) is generated on the nearest reachable endpoint.
|
Port/PTS_CHANNEL_GROUP
|
EVC Alarms
|
EFP_FAIL
|
EFP failed alarm. This alarm is raised when the EFP fails due to incomplete hardware provisioning or when the interface on which the EFP is present goes down.
|
Port
|
MPLS_TE
|
TE_TUNNEL_DOWN
|
TE tunnel down alarm. This alarm is raised when the working and protected MPLS-LSP goes down.
|
PTS**
|